Executive Summary: The Institutional Rules of Operational Due Diligence (ODD)
What is Operational Due Diligence (ODD) in Private Equity Buyouts?
Operational Due Diligence (ODD) is the systematic, rigorous investigation of a target company's operational infrastructure, manufacturing facilities, supply chain architecture, workforce productivity, internal financial controls, and technology systems prior to transaction closing.
While **Commercial Due Diligence (CDD)** investigates market sizing, competitive positioning, and customer retention, and **Financial Due Diligence (FDD / Quality of Earnings)** validates historical EBITDA accruals and working capital pegs, **Operational Due Diligence (ODD)** answers the ultimate execution question: *Can this company physically deliver the management plan underwritten by the deal team, and at what true cash cost?*
In modern corporate private equity, growth equity, and institutional M&A, the cost of overlooking operational reality is devastating. Private equity sponsors frequently underwrite aggressive 15% to 25% annual revenue growth trajectories predicated on expanding product volumes. However, without rigorous ODD, deal teams frequently discover post-close that: 1. **The Factory Floor is at Effective Capacity:** While management claimed 70% capacity utilization based on theoretical nameplate ratings, actual Overall Equipment Effectiveness (OEE) reveals that key bottleneck machines are running at 94% utilization with zero redundancy, requiring an immediate $12M to $20M unbudgeted capital expenditure (CapEx) program just to support baseline growth. 2. **Maintenance CapEx Has Been Systematically Starved:** In the 24 months preceding an auction, sell-side founders or corporate parents routinely defer routine preventative maintenance and spare parts inventory, artificially suppressing recorded operating expenses to inflate EBITDA multiples. Post-close, the buyer inherits catastrophic equipment downtime and urgent overhaul bills. 3. **Severe Single-Source Supplier Vulnerabilities:** Over 40% of critical raw materials or specialized subcomponents may depend on uncontracted, single-source vendors operating in volatile offshore jurisdictions without secondary supply agreements or dual-tooling safety stock. 4. **Key Person Operational Dependencies:** Critical operating know-how, proprietary machine calibration parameters, and vendor discount pricing relationships frequently reside exclusively in the heads of two or three plant veterans who have no retention agreements, no documented standard operating procedures (SOPs), and plans to retire within six months of transaction close. 5. **Compromised Internal Controls and Segregation of Duties:** Fast-growing middle-market businesses frequently lack institutional cash disbursement governance, allowing single individuals to approve purchase orders, add new vendor bank accounts, and authorize ACH wire releases—creating unacceptable exposure to financial fraud, inventory shrinkage, and regulatory non-compliance.
An institutional ODD deck does not merely document operational problems; it translates shop-floor operational physics into investment committee economics. It establishes whether an identified deficiency is an unfixable structural defect (deal killer), a basis for renegotiating headline transaction value (escrow indemnity / purchase price adjustment), or a high-return operational lever for the post-close Value Creation Plan (VCP).
Exhibit 1: Operational Due Diligence (ODD) Multi-Workstream Assessment Dashboard
Table 1: Institutional Operational Due Diligence (ODD) Workstream Taxonomy & Scope
The 6 Pillars of Operational Due Diligence: Deconstructing Operational Reality from Management Hype
Conducting an institutional ODD review requires moving beyond high-level executive slide decks and getting dirty on the shop floor, reviewing maintenance work order databases, interviewing plant managers without corporate sponsors present, and pressure-testing the physical supply chain. The evaluation must be organized across six MECE operational pillars:
### Pillar 1: Manufacturing Capacity, Throughput Velocity, and OEE Decomposition Management presentation decks routinely declare: *"Our state-of-the-art facilities operate at 65% capacity, providing abundant room for 3x revenue expansion without additional capital investment."* An experienced ODD advisor immediately challenges this claim by decomposing theoretical capacity into empirical **Overall Equipment Effectiveness (OEE)**:
$\text{OEE} = \text{Availability} \times \text{Performance} \times \text{Quality}$
Where: - **Availability** measures actual operating runtime against planned scheduled production hours (deducting unscheduled breakdowns, machine setup changeovers, and operator meal breaks). - **Performance** measures actual operating speed against the manufacturer's ideal design cycle speed (capturing micro-stoppages, operator pacing drag, and material feed jams). - **Quality** measures first-pass yield of acceptable finished parts (deducting scrap, rework, and destructive testing samples).
In a typical middle-market manufacturer, while nameplate machinery Availability may appear to be 85%, actual Performance runs at 80% due to machine wear, and first-pass Quality sits at 92%. The resulting baseline OEE is: $\text{OEE} = 0.85 \times 0.80 \times 0.92 = 62.56\%$
More critically, ODD investigates **line bottlenecks**. A manufacturing facility is governed by the Theory of Constraints: plant throughput is dictated solely by the slowest work center in the sequence (the drum-buffer-rope constraint). If CNC machining cells are running at 94% utilization on three shifts while downstream assembly is only at 45%, the plant is effectively 100% constrained. Any revenue expansion underwritten by the private equity deal team requires either: - A $14.5M CapEx injection to purchase secondary CNC machine tools and expand physical electrical substation drops, or - Transitioning to higher-cost third-party contract machining, eroding gross margins by 450 to 600 basis points.
### Pillar 2: Maintenance Capital Expenditure (CapEx) Forensic Normalization One of the most pervasive value-destroying traps in private equity buyouts is the conflation of Growth CapEx with Maintenance CapEx. Sell-side management teams have strong financial incentives to categorize all capital spending as "growth" to convince buyers that baseline Maintenance CapEx is negligible, or worse, to defer routine maintenance altogether.
ODD audits equipment maintenance histories across two dimensions: 1. **Preventative vs. Reactive Maintenance Ratio:** In world-class manufacturing, 80%+ of maintenance work orders are proactive (scheduled lubrication, vibration analysis, thermal imaging, and planned bearing replacements). In distressed or artificially juiced targets, reactive "run-to-failure" maintenance accounts for 60%+ of work orders. 2. **True Steady-State Maintenance CapEx Baseline:** ODD reconstructs the true depreciation-replacement curve of plant equipment. If historical depreciation is $8M per year but historical capitalized Maintenance CapEx has averaged only $2.5M per year for the past three years while machine operating hours doubled, the target has built up a massive **Deferred Maintenance Liability**. ODD quantifies this deferred maintenance overhang and deducts it dollar-for-dollar from the enterprise purchase price or models an immediate Day-1 cash restoration fund.
### Pillar 3: Supply Chain Architecture and Single-Source Concentration The post-2020 macroeconomic environment proved that low-cost single-country sourcing is a catastrophic operational vulnerability. ODD stress-tests the target's supplier base across three concentric rings of risk: - **Tier-1 Sole Sourcing:** Identifying all raw material components, specialized forgings, custom electronic PCBs, or active pharmaceutical ingredients (APIs) where the target relies on a single vendor with no pre-qualified secondary supplier. - **Contractual & Commercial Defensibility:** Determining whether supplier relationships are governed by long-term Master Service Agreements (MSAs) with guaranteed pricing collars and minimum inventory safety allocations, or whether the company operates on informal purchase orders subject to immediate unilateral price increases. - **Geopolitical & Freight Vulnerability:** Mapping maritime shipping lanes, customs clearance choke points, and foreign exchange exposure. A component sourced from an overseas vendor with a 24-week lead time requires the target to hold 90 to 120 days of finished buffer inventory, tying up millions in trapped working capital cash ($CCC$).
### Pillar 4: Quality Management, EHS Compliance, and Environmental Liabilities Operational quality failures do not merely trigger product scrap; they destroy brand equity and trigger devastating customer chargebacks, warranty claims, and regulatory recalls.
ODD inspects the target's Quality Management System (QMS): - **Traceability Architecture:** In regulated industries (aerospace, automotive, medical device, food & beverage), can the target track a defective lot back to the specific raw material batch, machine operator, shift timestamp, and subcomponent supplier within two hours? - **Warranty Reserve Adequacy:** ODD performs a cohort lag analysis on warranty claims. If management accrues 1.5% of revenue for warranty expense but historical return trends show claims lagging shipment by 14 months with an actual cumulative payout rate of 3.8%, ODD flags a material unrecorded balance sheet liability. - **Environmental, Health, and Safety (EHS):** ODD inspects OSHA 300 logs, hazardous waste manifests, EPA Title V air permits, and wastewater discharge treatment systems. An unpermitted wastewater discharge or historic underground fuel tank leakage represents strict joint-and-several environmental liability that can exceed the entire equity check of the transaction.
### Pillar 5: Operational Technology (OT) and Shop-Floor Cyber Vulnerability Historically, IT due diligence focused on enterprise software (ERP, CRM, email). However, modern private equity transactions require auditing **Operational Technology (OT)**—the physical programmable logic controllers (PLCs), robotic arms, distributed control systems (DCS), and computer numerical control (CNC) equipment running the physical plants.
Target companies frequently air-gap enterprise corporate networks but leave plant floor OT networks running obsolete Windows 7 / XP embedded operating systems with default factory administrative passwords ('admin' / '1234') connected directly to supervisory telemetry monitors. A ransomware attack penetrating an unsegmented OT network halts physical production lines instantaneously, inflicting hundreds of thousands of dollars per day in direct business interruption losses. ODD assesses network segmentation (Purdue Model Level 0-4), industrial endpoint protection, and the viability of manual fallback procedures.
### Pillar 6: Management Controls, Labor Ergonomics, and Key Person Risk The most sophisticated physical machinery is useless without skilled operators and disciplined supervision. ODD investigates the human dimension of operations: - **Direct Labor Stability & Wage Arbitrage:** Does the plant rely heavily on temporary staffing agencies (often 30%-50% of the shop-floor workforce), masking extreme turnover, elevated scrap rates, and severe training drag? - **Spans of Control and Organizational Delayering:** Are frontline supervisors managing appropriate cohorts (1:12 to 1:18 in manufacturing, 1:20 to 1:25 in warehousing), or are there bottleneck "player-coach" supervisors managing 40+ workers across multi-acre facilities? - **Segregation of Duties (SoD) & Internal Cash Governance:** Does the target maintain strict operational and financial checks and balances? ODD audits whether single individuals have unchecked authority across the complete Procure-to-Pay (P2P) lifecycle (e.g., entering new vendor master records, approving purchase orders, and authorizing bank wire releases). Failure in SoD creates direct vulnerability to vendor embezzlement and inventory diversion.
Checklist 1: Preliminary ODD Data Room & Target Discovery Gate: 10 Operational Deal-Breaker Filters
Manufacturing & Supply Chain Diligence: Capacity, OEE, and Bottleneck Economics
When private equity deal teams evaluate an acquisition, the financial model almost always assumes that operating leverage will expand margins: fixed overhead will stay relatively flat while output surges. The operational due diligence team's primary responsibility is to rigorously test whether this assumption holds physical reality.
### The Mechanics of Capacity Diligence Capacity cannot be evaluated as an aggregate number. A manufacturing plant is a network of interconnected physical workstations, each with its own throughput constraints, setup changeover times, and operator skill requirements.
To determine true capacity, ODD executes a four-step diagnostic: 1. **Nameplate vs. Effective Capacity Mapping:** Nameplate capacity represents the manufacturer's theoretical speed running 24 hours per day, 365 days per year (8,760 hours/yr) under perfect laboratory conditions. Effective capacity subtracts mandatory planned downtime (scheduled preventive maintenance, holiday shutdowns, shift changeovers, and tooling setups). 2. **Setup and Tooling Changeover Drag:** In high-mix, low-volume manufacturing businesses, setup times represent massive capacity leakage. If a stamping press requires 4.5 hours of tooling changeover between production runs and runs three changeovers per week, 13.5 hours of prime weekly machine time (over 15% of a two-shift schedule) is completely lost to non-productive downtime. ODD evaluates whether Single-Minute Exchange of Die (SMED) lean principles can recover this trapped capacity without capital expenditure. 3. **Scrap and Yield Cascades:** In multi-stage manufacturing, scrap rates compound geometrically down the line. If a product passes through four sequential workstations with individual yields of 95%, 92%, 96%, and 90%, the cumulative first-pass yield of the line is only: $\text{Cumulative First-Pass Yield} = 0.95 \times 0.92 \times 0.96 \times 0.90 = 75.51\%$ Nearly 25% of starting raw materials and front-end machine labor is scrapped before reaching finished goods packaging. If the investment thesis assumes volume expansion, scrap handling costs and working capital drag will spiral out of control unless front-end process stability is remediated. 4. **Labor Constraint vs. Machine Constraint:** A plant may have 20 CNC machining centers, but if the local labor market cannot supply qualified five-axis CNC machinists and the plant is running only one shift due to chronic staffing shortages, the facility is labor-constrained, not asset-constrained. ODD benchmarks local machinist hourly wage rates ($32/hr vs. the target's below-market $24/hr), identifying that management must implement an immediate 30% shop-floor wage adjustment post-close to attract and retain the labor necessary to run a second shift.
Exhibit 2: Manufacturing Footprint Capacity Utilization, OEE & Growth Bottleneck Analysis
Table 2: Plant Operational Metrics & Overall Equipment Effectiveness (OEE) Benchmark Matrix
Procurement Diligence & Single-Source Supplier Vulnerability
In private equity value creation modeling, procurement savings frequently represent the largest and fastest source of EBITDA expansion. However, before an operating partner can model 5% to 8% direct material cost takeout, the ODD team must rigorously evaluate the target's supplier concentration and purchasing governance.
### Deconstructing the Addressable Spend Cube ODD conducts a forensic spend cube analysis, categorizing 100% of the target's historical annual procurement disbursements across: - **Direct Material Spend:** Raw materials, specialized components, subassemblies, and packaging directly integrated into finished goods. - **Indirect Spend (MRO):** Maintenance, Repair, and Operations supplies, plant tooling, factory consumables, protective equipment (PPE), and industrial lubricants. - **Logistics & Freight Spend:** Inbound freight, cross-docking, ocean container shipping, linehaul trucking, and outbound parcel delivery. - **SG&A / Corporate Services Spend:** IT hardware/software licensing, telecommunications, corporate travel, external legal/accounting advisory, and temporary labor agencies.
In unoptimized targets, procurement is frequently decentralized: plant managers and maintenance leads issue independent purchase orders to local suppliers at non-negotiated spot prices, creating massive internal price dispersion (e.g., Plant A paying $42/unit for steel bar stock while Plant B pays $51/unit for the exact same grade).
### Single-Source Supplier Vulnerability Pareto Analysis The most dangerous operational vulnerability uncovered during procurement diligence is **sole-source supply exposure**. ODD builds a Pareto vulnerability curve, identifying all SKU categories where: 1. A single vendor supplies 100% of the target's requirements. 2. The supplier owns the proprietary tooling, casting molds, or intellectual property required to manufacture the part. 3. Qualifying a secondary replacement supplier requires a 9 to 18-month regulatory re-certification or automotive PPAP (Production Part Approval Process) validation cycle.
When this situation exists, the target company is entirely captive to the vendor's financial stability, labor relations, and pricing discretion. If that single supplier experiences a factory fire, a labor strike, or a private equity buyout of its own, the target's physical production lines grind to an immediate halt. ODD establishes whether the vendor has signed a formal Supply Continuity Agreement, requires the seller to establish an escrow tooling holdback, or models the working capital required to build a 180-day strategic safety buffer stock.
Exhibit 3: Supply Chain Single-Source Concentration & Lead-Time Volatility Matrix
Table 3: Supplier Concentration, Dual-Sourcing Qualification & Critical Material Risk Matrix
Operational Governance, Key Person Risk & Segregation of Duties
While plant machinery and supplier contracts constitute the physical anatomy of operations, governance controls represent the central nervous system. In founder-led or middle-market businesses, operational governance is frequently informal, personalized, and dangerously reliant on key individuals.
### Auditing Key Person Dependencies and Operational Institutionalization ODD conducts structured, confidential interviews with tier-2 and tier-3 operating personnel (shift supervisors, maintenance leads, quality technicians, procurement specialists) to evaluate whether standard operating procedures (SOPs) are institutionalized or tribal.
Key indicators of operational fragility include: - **Tribal Machine Calibration:** Machine setup adjustments, feed rates, and formulation ratios are recorded in operator personal notebooks or set by 'feel' rather than locked into password-protected CNC machine controllers. - **Concentrated Commercial/Vendor Relationships:** The Director of Procurement negotiates multi-million dollar contracts via personal cell phone calls with vendors, with no formal request for quotation (RFQ) documentation or competitive bid sheets. - **Single-Point Engineering Know-How:** A single chief engineer or founder holds exclusive understanding of the proprietary firmware code or product design formulas, with zero documented design schematics, CAD files, or cross-trained engineering backbench.
If key personnel depart post-acquisition, the buyer inherits operational paralysis. ODD quantifies the cost of de-risking this vulnerability: establishing structured retention bonuses, budgeting immediate executive search fees to recruit professional operations talent, and funding a 90-day comprehensive SOP documentation initiative.
### Segregation of Duties (SoD) and Internal Fraud Prevention In growing companies, employees often accumulate overlapping administrative privileges across ERP and banking portals to 'keep business moving fast'. ODD maps user access matrices to uncover critical **Segregation of Duties (SoD) conflicts**: - **Procurement & Vendor Master Integrity:** Can the same individual create or edit a vendor master file, issue a purchase order, confirm goods receipt, and approve the invoice for payment? If so, the target possesses zero structural defense against phantom vendor invoicing fraud. - **Payroll & Direct Labor Controls:** Can plant supervisors alter employee clock-in hours, approve overtime sheets, and distribute physical payroll cards? - **Inventory Adjustments & Scrap Sign-Off:** Can warehouse managers execute manual inventory cycle count write-downs without independent finance or internal audit countersignatures?
ODD establishes the operational control baseline: enforcing dual-authorization wire release protocols (mandatory dual sign-off on all disbursements >$25,000), implementing automated three-way matching (PO, Goods Receipt, Vendor Invoice) in the ERP, and locking down user permission matrices before funds flow at closing.
Simulate & Prototype: Operational Due Diligence Presentation Guide: Frameworks, Red Flag Diagnostics, and Investment Committee Decks
Drag to draw custom components, test consulting layout presets, and preview presentation architecture live before generating with AI.
Exhibit 4: Operational Governance, Segregation of Duties (SoD) & Cash Control Architecture
Table 4: Internal Controls, Segregation of Duties (SoD) & Fraud Risk Rating Matrix
Dollarizing Operational Debt: The Remediation CapEx & EBITDA Haircut Bridge
The defining hallmark of an elite ODD presentation is the rigorous financialization of physical findings. An Investment Committee does not want an unstructured catalog of maintenance gripes or mechanical observations; it requires an **auditable financial bridge** demonstrating exactly how operational realities impact the valuation model, debt leverage ratios, and purchase price negotiations.
Operational findings must be categorized into three distinct financial buckets:
### Bucket 1: The 'Operational Debt' CapEx Bridge (Purchase Price Adjustments & Escrows) Just as technical debt represents the future cost of refactoring unstable software code, **Operational Debt** represents the unavoidable capital expenditure required to restore physical assets, regulatory compliance, and technology infrastructure to an acceptable baseline.
In our representative middle-market industrial transaction case study ($120M Enterprise Value, $16.0M Reported EBITDA): - **Deferred Plant Maintenance Catch-Up:** Rebuilding two primary stamping presses, replacing worn overhead crane cables, and repairing leaking facility roof sections requires **$3.8M**. - **Environmental Remediation & Hazardous Material Abatement:** Removing underground storage tanks and installing mandatory VOC carbon scrubber filters requires **$1.4M**. - **OT & Industrial Cyber Hardening:** Segmenting the factory OT network, deploying industrial firewalls, and patching PLCs requires **$650k**. - **Total Operational Debt:** **$5.85M**.
The deal team leverages this empirical $5.85M finding in purchase price negotiations: demanding an immediate dollar-for-dollar reduction in the headline purchase price or an escrow indemnity holdback, directly protecting the sponsor's equity check.
### Bucket 2: EBITDA Normalization Haircuts (Adjusting the Earnings Base) Sell-side Quality of Earnings reports frequently present an aggressively inflated EBITDA baseline. ODD uncovers recurring operational expenses that were omitted or artificially suppressed: - **Understaffed Plant Management Normalization:** The target operated without an Environmental Health & Safety (EHS) director, a continuous improvement manager, and a certified quality engineer, forcing the founder to cover these roles. Re-staffing the organization with professional operational leadership adds **-$550k/year** in recurring SG&A. - **Direct Labor Wage Rate Market Realignment:** Shop-floor turnover sits at 44% because base wages are $3.50/hr below prevailing regional market rates. Increasing base pay across 180 hourly workers to stabilize retention adds **-$720k/year**. - **Preventative Maintenance Expensing Normalization:** Historical operating expenses reflect run-to-failure maintenance. Restoring routine preventative maintenance cycles adds **-$380k/year**. - **Total Operational EBITDA Haircut:** **-$1.65M/year**.
Adjusting reported EBITDA from $16.0M down to the underwritten normalized baseline of **$14.35M** at an 8.0x multiple represents an implied enterprise valuation impact of **$13.2M**.
### Bucket 3: 100-Day Value Creation Upside (Operational EBITDA Expansion) While ODD acts as an essential shield against downside risks, it also serves as the spear for post-close value creation. By identifying operational waste during diligence, the team quantifies bankable EBITDA expansion opportunities: - **Strategic Procurement Direct Cost-Out:** Aggregating raw material spend and eliminating decentralized spot purchasing yields a 5.5% direct material savings across $42M addressable spend: **+$2.31M/year**. - **Scrap Reduction & First-Pass Yield Improvement:** Elevating line yields from 88.6% to 95.0% through automated optical inspection and progressive die re-tooling saves **+$1.25M/year**. - **Warehouse Footprint & Outbound Freight Consolidation:** Re-routing freight linehauls and consolidating from three regional warehouses to two centralized distribution centers delivers **+$940k/year**. - **Total Bankable Operational EBITDA Expansion:** **+$4.50M/year** over 24 months, expanding underwritten EBITDA from $14.35M to **$18.85M**.
Checklist 2: The Pre-Investment Committee ODD Verification & Sign-Off Checklist: 10 Governance Gates
The 100-Day Post-Close Operational Value Creation & Remediation Roadmap
Identifying operational vulnerabilities during due diligence is meaningless unless the sponsor has an actionable, disciplined execution plan ready for execution on Day 1. The operational due diligence deliverable must conclude with a comprehensive **100-Day Operational Value Creation & Remediation Roadmap**.
The 100-day execution framework divides operational initiatives into three sequential, overlapping flight paths:
### Flight Path 1: Days 1 to 30 — Operational Stabilization, Cyber Lockdown & Cash Controls The immediate objective of the first 30 days is operational risk containment and establishing baseline financial hygiene: - **Day-1 Cash & Disbursement Control Governance:** Transition banking authorizations to mandatory dual-signoff protocols on all disbursements >$25,000; reconfigure ERP permissions to eliminate vendor master file SoD conflicts. - **OT & Industrial Cyber Isolation:** Deploy network segmentation firewalls between plant-floor industrial control networks (PLCs/SCADA) and corporate enterprise networks; change all administrative passwords on industrial machinery controllers. - **Safety & Hazardous Maintenance Remediation:** Execute immediate emergency repairs on flagged life-safety hazards (overhead crane cables, chemical containment berms, unshielded machine pinch points) to ensure worker protection and OSHA compliance. - **Key Operator Retention Agreements:** Execute formal retention bonus agreements with top 8 mission-critical plant supervisors, tooling specialists, and master machinists identified during ODD.
### Flight Path 2: Days 31 to 60 — Line Debottlenecking, Tooling Standardization & Supplier Engagement The second month focuses on unblocking shop-floor throughput and attacking high-risk supplier vulnerabilities: - **Bottleneck Work Center Optimization (SMED):** Launch rapid-exchange tooling Kaizen events on the CNC machining constraint line; compress setup changeover times from 185 to 45 minutes, immediately liberating 15% trapped machine capacity. - **Single-Source Vendor Continuity Agreements:** Initiate negotiations with the top 3 sole-source casting and component suppliers; execute formal 24-month Supply Continuity Agreements with pre-agreed volume pricing collars and minimum safety stock commitments. - **Strategic Buffer Inventory Sourcing:** Fund and place initial purchase orders for 180-day strategic buffer inventory on long-lead overseas microcontrollers and critical resin polymers ($4.5M working capital allocation). - **Quality Control In-Line Vision System Deployment:** Install optical automated inspection sensors on final assembly lines, catching machining defects at the workstation level to drive scrap reduction from 11.4% to <5.0%.
### Flight Path 3: Days 61 to 100+ — Strategic Procurement Cost-Out & Institutional Lean Transformation The final phase of the 100-day plan transitions from defensive remediation to aggressive EBITDA value creation: - **Direct Material Spend Sourcing Waves:** Issue competitive RFPs across addressable direct spend categories (steel bar stock, packaging, commercial freight); aggregate multi-plant volumes to capture the targeted 5.5% direct cost takeout ($2.31M annual run-rate EBITDA savings). - **Total Productive Maintenance (TPM) Rollout:** Transition maintenance operations from reactive firefighting to automated predictive maintenance; install IoT vibration monitoring sensors on primary production motors. - **Standard Operating Procedure (SOP) Digitalization:** Complete comprehensive video- and tablet-based SOP documentation across all core work centers, eliminating tribal operating knowledge and establishing formal new-hire onboarding curricula. - **Transformation Management Office (TMO) Cadence:** Transition diligence workstream leads into a permanent weekly operational steering committee cadence, tracking initiative progress through Stage-Gates L1 (Idea Validation) through L5 (General Ledger Cash Realization).
Exhibit 5: The 100-Day Post-Close Operational Value Creation & Remediation Roadmap
How to Structure an 8-Slide Executive ODD Presentation for Investment Committees
When presenting operational due diligence findings to a private equity Investment Committee, brevity, numerical precision, and decision orientation are paramount. Committee members (Senior Partners, Investment Directors, and Independent Advisors) have limited patience for 80-slide engineering catalogs. They need to understand: What are the fatal risks? What is the true normalized EBITDA? How much CapEx is required? How do we fix the operations post-close?
An institutional, decision-ready ODD Investment Committee presentation follows an uncompromising 8-slide architecture:
### Slide 1: Executive Summary & Operational Deal Scorecard - **Visual Architecture:** 3-column split dashboard (Background & Operational Scope | Key Diligence Findings & Red Flags | Final Operational Recommendation & Valuation Adjustments). - **Core Content:** Summarizes physical audit scope (number of plants inspected, hours on shop floor, third-party engineering specialists engaged); presents high-level traffic-light assessment across 6 core workstreams; states total recommended purchase price reduction / escrow holdback ($5.85M) and normalized EBITDA impact (-$1.65M).
### Slide 2: Manufacturing Footprint, Asset Quality & Facility Condition - **Visual Architecture:** Geographic facility map paired with multi-facility asset scorecard (Plant Location, Square Footage, Machine Replacement Value, Age Profile, Cleanroom / Power Specs). - **Core Content:** Details physical plant conditions; identifies maintenance backlog; highlights environmental permits and compliance status; outlines expansion physical limits.
### Slide 3: Capacity Utilization, Bottleneck Analysis & OEE Decomposition - **Visual Architecture:** Dual column chart comparing nameplate vs. effective vs. bottleneck machine utilization, supported by an empirical OEE waterfall bridge (Availability x Performance x Quality). - **Core Content:** Proves whether current operations can physically support underwritten revenue growth; identifies exact machine constraints; establishes whether growth requires CapEx or operational lean debottlenecking.
### Slide 4: Supply Chain Architecture, Lead-Time Volatility & Supplier Concentration - **Visual Architecture:** 2x2 supplier vulnerability matrix (Spend Volume vs. Single-Source Criticality) paired with an inbound logistics lead-time flight path. - **Core Content:** Isolates top-10 single-source suppliers; quantifies revenue at risk from supply chain disruption; details working capital requirements for strategic safety inventory buffers.
### Slide 5: Quality Systems, Warranty Exposure & EHS Compliance - **Visual Architecture:** Historical scrap/rework trendline chart paired with a cohort warranty claim lag curve and OSHA safety record benchmarking panel. - **Core Content:** Documents first-pass quality yields; calculates unaccrued warranty liabilities; reviews Phase I environmental findings and remediation requirements.
### Slide 6: Operational Governance, Segregation of Duties & Key Person Risk - **Visual Architecture:** Organizational governance tree highlighting key person single-points-of-failure paired with an internal controls / SoD heat matrix. - **Core Content:** Identifies mission-critical operating personnel requiring retention packages; details banking and procurement internal control failures requiring immediate Day-1 intervention.
### Slide 7: Operational Financial Bridge: Normalized EBITDA & Remediation CapEx - **Visual Architecture:** Waterfall bridge chart reconciling Reported Management EBITDA to Underwritten Normalized EBITDA, paired with a table detailing Operational Debt CapEx deductions. - **Core Content:** Dollarizes all operational findings; breaks down normalized labor, maintenance, and SG&A additions; provides exact purchase price adjustment recommendations.
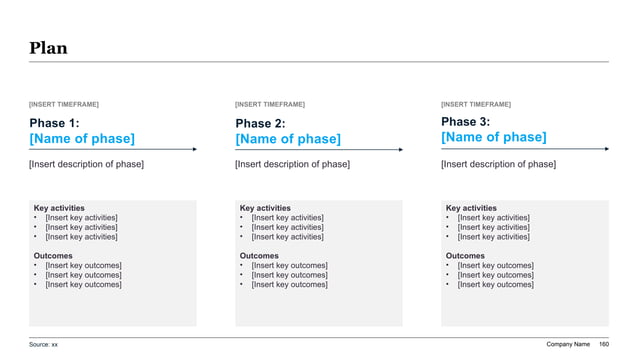
### Slide 8: The 100-Day Operational Value Creation & Remediation Roadmap - **Visual Architecture:** 3-phase horizontal Gantt roadmap (Days 1-30 Stabilization | Days 31-60 Line Debottlenecking | Days 61-100+ Procurement & Lean Optimization) with assigned workstream leads and milestone gates. - **Core Content:** Details immediate Day-1 risk mitigation actions; maps 24-month bankable operational EBITDA expansion initiatives (+ $4.5M/yr); establishes the permanent Transformation Office (TMO) governance cadence.
XLSlides AI Prompt Recipe: Generating Institutional ODD Investment Committee Decks
Act as a Senior Private Equity Operating Partner and Operational Due Diligence (ODD) Practice Leader presenting a high-stakes ODD review to the Investment Committee. Generate a comprehensive, decision-ready 8-slide Operational Due Diligence presentation outline based on the following target parameters: - Target Company: [Insert Target Name, e.g., Apex Precision Industrial Components] - Sector & Business Model: [e.g., High-mix precision CNC machining and subassemblies for aerospace and medical devices] - Manufacturing Footprint: [e.g., 3 owned manufacturing facilities in Ohio and Indiana, total 220,000 sq ft, 85 active CNC machines, 280 direct labor employees] - Financial Context: [e.g., $115M Revenue, $16.8M Reported EBITDA, 8.5x EV underwrite, $42M direct material spend] - Key Diligence Findings: [e.g., Deferred maintenance backlog on primary forging press ($2.8M), critical single-source foundry supplier in Ohio representing 28% of COGS with no secondary source, plant OEE operating at 58.4% due to 3-hour setup changeovers, unsegmented factory OT network running legacy Windows 7 PLCs, high shop-floor turnover (42%) driven by below-market wages] For each of the 8 slides, generate: 1. Executive Slide Action Title (Must express an answer-first analytical conclusion with specific quantitative metrics, not a generic topic heading). 2. Layout & Visual Exhibit Specification (Specify the exact slide layout: e.g., 3-column split dashboard, OEE waterfall bridge chart, 2x2 supplier concentration matrix, or 100-day Gantt roadmap). 3. Primary Quantitative Evidence & Benchmarks (Deconstruct the numbers: empirical OEE %, unbudgeted CapEx $, normalized labor additions, scrap reduction $, and working capital requirements). 4. Direct Investment Committee Risk & Valuation Implication (Explicitly categorize findings into: Fatal Deal Breakers, Purchase Price Deductions / Escrows, or Post-Close 100-Day Value Creation Levers). 5. Executive Callout & Recommendation Note (What specific decision must the Investment Committee make regarding purchase agreements, debt covenant cushions, or closing conditions). Enforce executive consulting language: avoid passive descriptions, prioritize MECE structure, eliminate AI marketing buzzwords, and ensure all operational findings tie directly to balance sheet liquidity and P&L cash flow realization.
Frequently Asked Questions About Operational Due Diligence Presentations
Build Executive-Ready Due Diligence Decks in Seconds with XLSlides
Methodology And Sources
- Private Equity Operational Due Diligence: A Comprehensive Practice Framework for Institutional LPs and GPs(Institutional Limited Partners Association (ILPA))
- Uncovering Hidden Operational Value and Operational Risks in Buyout Due Diligence(Bain & Company Global Private Equity Report)
- Operational Due Diligence: Lessons from 100+ Plant Floor and Supply Chain Diagnostics in Private Equity(McKinsey & Company Operations Practice)
- Defending EBITDA: Why Operational Due Diligence Makes or Breaks the PE Investment Case(Alvarez & Marsal Private Equity Performance Improvement)
- Operational Risk Assessment in Alternative Investments: Internal Controls, Segregation of Duties, and Fraud Prevention(Chartered Alternative Investment Analyst (CAIA) Association)