Executive Summary: Translating Deal Underwriting into Operational Value Creation
In institutional private equity, the Value Creation Plan (VCP) is the single most critical strategic deliverable produced during the post-acquisition lifecycle. While the pre-deal Investment Committee (IC) memo establishes the valuation thesis, debt financing package, and financial return hurdles (target MOIC of 2.5x–3.5x and IRR of 22%–28%), the VCP operationalizes that investment thesis into an actionable, multi-year execution roadmap managed by portfolio leadership and audited by the sponsor's Operating Committee.
A common failure mode across middle-market buyouts and corporate carve-outs is treating the VCP presentation as a high-level corporate strategy deck filled with generic growth ambitions, vague synergy buckets, and aspirational bullet points. Top-tier private equity sponsors (including Blackstone, KKR, Carlyle, Bain Capital, Francisco Partners, and Vista Equity) enforce a fundamentally more rigorous standard: an operational contract anchored by an underwritten EBITDA expansion bridge, prioritized workstream charters, granular run-rate milestone tracking, and a disciplined transformation office governance rhythm.
A board-ready VCP deck must accomplish five non-negotiable operational objectives: 1. Establish the Operational Baseline: Reconcile audited Quality of Earnings (QoE) historical financial statements with pro forma management adjustments to create an undisputed starting EBITDA baseline that eliminates pre-deal noise. 2. Deconstruct the EBITDA Expansion Bridge: Translate macro return targets into discrete operational workstreams—pricing optimization, commercial GTM velocity, COGS and direct procurement rationalization, SG&A scale leverage, digital automation, and strategic add-on M&A. 3. Sequence the First 100 Days: Provide a weekly operational blueprint detailing quick wins (Days 1–30), deep-dive initiative design (Days 31–60), resource gating and initiative charter sign-off (Days 61–90), and formal board validation (Days 91–100). 4. Institute Transformation Governance: Establish the Transformation Office (TO / PMO) infrastructure, executive KPI scorecards, stage-gate hurdle controls, and management equity incentive plan (MEIP) alignment. 5. De-Risk Exit Valuation: Model enterprise value creation across varying exit multiples, proving that operational EBITDA expansion protects downside risk even in scenarios where exit valuation multiples contract by 2.0x–3.0x relative to entry.
This comprehensive guide provides private equity operating partners, portfolio company executive teams (CEOs, CFOs, CROs, COOs), and strategy advisors with the end-to-end framework, slide architectures, analytical tables, visual exhibits, and AI prompt recipes required to craft and present an institutional-grade Value Creation Plan that commands board conviction.
Key Takeaways: Core Principles of Institutional PE Value Creation Decks
- Reconcile Underwritten vs. Operational Baselines: Never launch a VCP presentation without reconciling pre-deal financial model assumptions against Day-1 operational reality. Quantify negative surprises immediately and re-underwrite baseline EBITDA before allocating initiative targets.
- Ground Every Dollar in a Stage-Gated Initiative Charter: Macro top-down targets ('expand gross margins by 250 bps') invite skepticism. Every dollar of bridge EBITDA must tie to a discrete initiative charter with an executive sponsor, project manager, Capex budget, and monthly P&L realization schedule.
- Separate In-Year Realized P&L from Exit Run-Rate Impact: Executive presentations must distinguish between cash EBITDA realized within the current fiscal year and annualized exit run-rate EBITDA. Lenders and boards evaluate liquidity on realized cash, while equity valuation reflects exit run-rate multiples.
- Deploy the 80/20 Rule to Avoid Initiative Fatigue: While diagnostic discovery often uncovers 50+ improvement opportunities, executive decks must focus management capital on the 8 to 12 'hero' initiatives that account for 80% of total underwritten EBITDA expansion.
- Establish Direct Accountability via Transformation Office (TO) Architecture: Operational success requires a centralized Program Management Office (PMO/TO) cadence. Slides must define weekly workstream standups, monthly Operating Committee deep dives, and clear red/yellow/green stage-gate escalation triggers.
- Align Executive Incentives with Exit Multiple Expansion: Highlight how initiative delivery accelerates enterprise value and ties directly to Management Equity Incentive Plan (MEIP) vesting hurdles, creating unified financial urgency across the sponsor and executive suite.
The Anatomy of a Private Equity Value Creation Plan
A successful Value Creation Plan deck follows a logical, deductive architecture structured around investment committee decision-making. Operating partners and consultants must resist the urge to present chronological discovery findings. Instead, the presentation should lead with the total enterprise value equation, demonstrate portfolio company baseline readiness, and unpack strategic execution workstreams.
Institutional private equity decks are typically organized into four core modules:
1. Macro Context & Re-Underwriting Baseline: Synthesizes market positioning, validated commercial due diligence insights, competitive moat reinforcement, and the reconciled Day-1 financial starting point. It explicitly addresses key variances between pre-deal investment assumptions and post-close operational realities, ensuring transparency from day one. 2. Strategic Value Pillars & Master Initiative Architecture: Clusters improvement levers into three to four overarching themes (e.g., Commercial Acceleration, Margin & Procurement Excellence, Digital & Operational Transformation). Each pillar contains prioritized initiative workstreams with clear dollar-value targets, designated management owners, and Capex allocations. 3. The EBITDA Expansion Waterfall: Translates strategic initiatives into a quantitative step-by-step bridge connecting Entry LTM EBITDA to Year-3/Year-5 Exit EBITDA, segmented by organic levers, cost rationalization, and M&A upside. Every step in the waterfall is backed by an initiative charter with measurable operational milestones. 4. First 100-Day Roadmap & Stage-Gate Governance: Details execution sequencing, weekly milestones, resource commitments, organizational enablers, and PMO oversight cadence. It provides the Operating Committee with clear stage gates (Gates 1 through 6) to monitor progress, release capital, and escalate emerging roadblocks.
By following this structured narrative, the VCP presentation provides directors, operating partners, and lenders with immediate visibility into how operational enhancements will drive equity returns, regardless of macroeconomic multiple contraction.
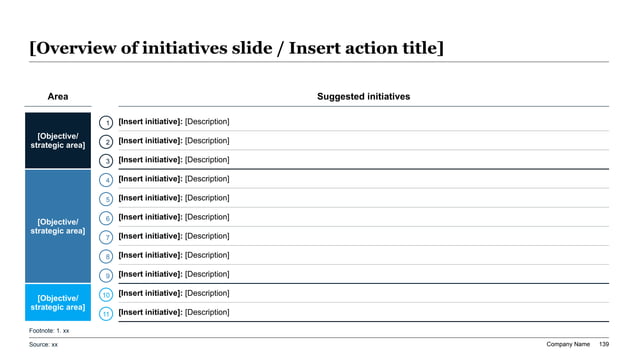
Exhibit 1: The 3 Strategic Value Pillars & 1 Core Initiatives Architecture
Investment Thesis Underwriting vs. Operational VCP Reality Matrix
Comparison between pre-deal investment committee assumptions and post-close operational reality, illustrating how the Value Creation Plan bridges underwriting gaps.
| Operational Vector | Pre-Deal IC Underwriting Assumption | Day-1 Post-Close Operational Reality | VCP Strategic Intervention & Course Correction | EBITDA Impact Risk / Mitigation |
|---|---|---|---|---|
| Organic Revenue Growth | Assumed 12.0% top-line CAGR driven by core market expansion and cross-selling. | Historical growth was heavily reliant on price inflation; sales rep churn reached 28% in Q2. | Restructure sales territory quotas, introduce tiered value pricing, and deploy a dedicated customer success cross-sell squad. | Mitigates $4.5M revenue downside; restores organic ARR trajectory to 10.5% within 9 months. |
| Gross Margin & Pricing Power | Assumed 300 bps margin expansion via unexercised enterprise pricing power. | Legacy contracts contain rigid annual price-increase caps (2.0%); rogue sales discounts average 14%. | Implement a CPQ discount matrix, eliminate rogue unapproved discounts, and introduce premium feature add-on modules. | Recovers $2.8M in annual pricing leakage; delivers 180 bps gross margin expansion by Year 2. |
| Direct Procurement & COGS | Assumed $3.0M procurement synergy from volume consolidation across suppliers. | Fragmented procurement across 4 regional operating units; zero standardized enterprise RFPs. | Consolidate direct spend across top 10 vendor categories; mandate central purchasing approval and execute competitive reverse tenders. | Secures $3.6M verified procurement cost-out; accelerates gross margin target by 6 months. |
| SG&A & Operating Leverage | Targeted 250 bps SG&A reduction through back-office shared services consolidation. | Custom ERP instances across acquired entities require high manual accounting headcount. | Deploy robotic process automation (RPA) for AP/AR, centralize finance/HR into shared services hub, and sunset legacy ERPs. | Unlocks $2.2M in annual run-rate G&A savings while improving financial reporting cycle speed by 5 days. |
| Working Capital Efficiency | Assumed net working capital at 11.0% of revenue supported by stable receivable collections. | DSO drifted from 48 to 68 days; unbilled WIP inventory increased by 35% due to supply chain buffers. | Institute strict customer billing milestone audits, automated collection escalations, and lean inventory pull controls. | Releases $6.2M in balance sheet liquidity within 120 days; eliminates need for revolving credit facility draw. |
| Add-on M&A Integration | Underwrote 2 bolt-on acquisitions at 6.0x EBITDA to expand product portfolio. | Core platform IT infrastructure lacks API maturity; previous bolt-on still operates as an unintegrated silo. | Establish an enterprise M&A integration playbook, decouple legacy codebases, and centralize commercial go-to-market teams. | De-risks multi-asset roll-up; protects underwritten 2.5x MOIC return profile. |
Quantifying the EBITDA Expansion Bridge: Baseline to Exit Multiple
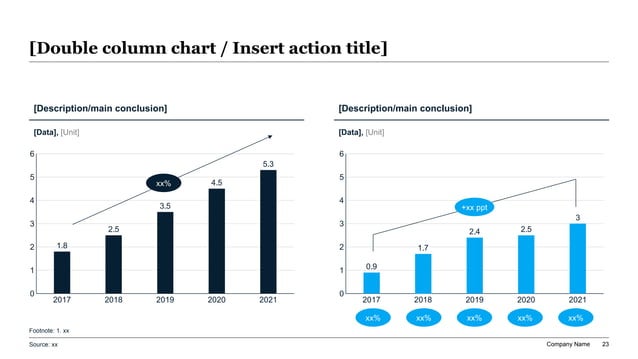
The center of gravity of every PE Value Creation Plan deck is the EBITDA Expansion Waterfall. This analytical exhibit translates qualitative management ambitions into an indisputable quantitative bridge connecting Day-1 Baseline LTM EBITDA to the Year-3 or Year-5 Exit Target EBITDA.
In top-tier presentations, the EBITDA bridge is not a generic high-level chart; it is a multi-dimensional financial schedule that reflects rigorous financial modeling discipline:
1. Starting Point Integrity: The bridge must begin with Quality of Earnings (QoE) Adjusted LTM EBITDA, explicitly stripping out non-recurring pandemic bumps, one-off customer windfalls, and unsustainable cost deferrals. Any post-close accounting adjustments discovered during Day 1–30 discovery must be explicitly reconciled here. 2. Volume vs. Price Decomposition: Organic revenue contribution must separate pure market volume growth from price realization and mix shifts. PE operating committees heavily favor margin expansion driven by pricing power and mix optimization over speculative market volume capture, as pricing flow-through carries near-100% contribution margin. 3. Gross Margin Cost-Out Levers: Procurement renegotiations, bill of materials (BOM) re-engineering, factory footprint consolidation, and direct labor productivity must be itemized as separate vertical bars, rather than lumped together. Each lever must reference historical run-rate benchmarks and clear supplier contract expiration schedules. 4. SG&A Rationalization vs. Strategic Reinvestment: A credible VCP does not merely show cost cuts. It explicitly models required reinvestment—such as hiring a high-caliber VP of Sales, implementing Salesforce/NetSuite, and expanding cybersecurity infrastructure. Netting reinvestment against cost-out demonstrates financial maturity and operational realism. 5. Programmatic M&A Contribution: For buy-and-build platform strategies, the bridge should isolate organic EBITDA expansion from inorganic EBITDA acquired through add-on acquisitions, illustrating pro forma synergy realization and multiple arbitrage. 6. Exit Multiple Sensitivity: The presentation should model enterprise value creation across a range of exit multiples, illustrating how operational EBITDA growth protects fund returns even if the exit multiple contracts by 2.0x–3.0x compared to entry.
Exhibit 2: EBITDA Bridge & Holding Period Growth Trajectory: Baseline to Target Exit Year
Comprehensive 7-Lever EBITDA Bridge Breakdown Table
Detailed financial schedule quantifying each operational value creation lever, including baseline contribution, gross savings, implementation cost, and net exit run-rate EBITDA.
| Value Creation Lever | Operational Scope & Mechanism | Gross EBITDA Opportunity | Implementation Cost / Capex | Net Exit Run-Rate EBITDA | Target Completion Gate |
|---|---|---|---|---|---|
| 1. Pricing Realization & CPQ Discipline | Eliminate rogue discounting, implement dynamic tier pricing, and enforce annual contractual CPI escalators across enterprise accounts. | +$4.20M | $0.35M (Software & training) | +$3.85M | Month 6 (Gate 2) |
| 2. Direct Spend & Procurement Synergy | Consolidate raw material suppliers, renegotiate freight/logistics contracts, and conduct competitive e-auctions for top 15 spend categories. | +$3.60M | $0.25M (Third-party audit) | +$3.35M | Month 9 (Gate 3) |
| 3. Sales Productivity & GTM Restructuring | Realign sales compensation to gross margin, deploy outbound SDR pod model, and optimize account executive territory allocation. | +$5.10M | $0.80M (Recruiting & enablement) | +$4.30M | Month 12 (Gate 4) |
| 4. Operations & Manufacturing Footprint | Consolidate 3 regional assembly facilities into 2 centers of excellence; implement lean cell manufacturing and visual shop-floor management. | +$3.10M | $1.20M (Facility transition) | +$1.90M | Month 18 (Gate 5) |
| 5. Back-Office Automation & SG&A Scale | Implement central ERP, automate accounts payable invoice matching, and transition non-core support to an offshore shared service center. | +$2.40M | $0.65M (Systems integration) | +$1.75M | Month 15 (Gate 4) |
| 6. Strategic Capability Reinvestment | Investment in strategic talent (Chief Technology Officer, Head of Product), cloud modernization, and ISO/SOC-2 compliance frameworks. | -$2.20M | $0.40M (One-off setup) | -$2.60M | Month 6 (Gate 2) |
| 7. Strategic Add-On M&A Synergies | Underwrite 2 strategic bolt-on acquisitions generating $12M revenue; capture corporate overhead duplicate removal and commercial cross-sell. | +$4.50M | $1.10M (Legal & integration PMO) | +$3.40M | Month 24 (Gate 6) |
| Total Portfolio Impact | Holistic operational transformation across revenue, margin, overhead, and programmatic M&A execution. | +$20.70M Gross | $4.75M One-off Capex | +$15.95M Net Run-Rate | Holding Period Exit |
Designing High-Impact Operational Workstreams: Pricing, Procurement, and GTM
A robust VCP presentation must translate broad financial bridge numbers into granular operational workstream charters. Each workstream represents an autonomous initiative team led by a designated management owner and supported by a sponsor operating partner.
The most lucrative and reliable operational workstreams in private equity portfolio transformations include:
1. Commercial Excellence & Strategic Pricing: Pricing is universally recognized as the highest-velocity, highest-margin lever in portfolio operations. Slides in this section must illustrate price-volume-cost sensitivity, customer contract expiration schedules, and leakage waterfalls (e.g., freight subsidies, off-invoice rebates, and payment term discounts). The deck should outline specific pricing interventions: implementing list price increases on non-core SKUs, introducing value-based tiered packaging, and establishing a deal desk with strict discount delegation of authority (DOA).
2. Direct & Indirect Procurement Optimization: Deconstruct total third-party addressable spend using spend analytics heatmaps. The deck should demonstrate how supplier spend is categorized into direct materials, logistics, temporary staffing, IT software licenses, and professional services. Highlight quick-hit vendor renegotiations based on benchmark contract pricing and longer-term demand-management policies such as specification harmonization and competitive reverse tenders.
3. Go-To-Market (GTM) Engine Optimization: Showcase pipeline conversion mathematics. Detail sales rep quota capacity, customer acquisition cost (CAC) payback periods across channels, and net revenue retention (NRR) expansion tactics. The VCP must prove that sales velocity improvements are rooted in process repeatability, outbound SDR pod architecture, and structured territory rebalancing rather than relying on hero sales reps.
4. Operational & Manufacturing Lean Flow: For industrial, distribution, and manufacturing assets, detail footprint rationalization, inventory stocking algorithms, and Overall Equipment Effectiveness (OEE) improvements. Contrast legacy batch processing with cellular lean manufacturing lines to reduce lead times and work-in-progress (WIP) working capital.
5. Digital Infrastructure & Back-Office Automation: Modernize core technology foundations to support scalable growth. Slides should map ERP consolidation, automated accounts payable/receivable invoice matching, cloud infrastructure cost optimization, and robotic process automation (RPA) across shared service hubs.
Exhibit 3: Value Creation Levers to Run-Rate EBITDA Contribution Flow
The First 100 Days Diagnostic & Initiative Scoping Checklist
The First 100-Day Implementation Timeline & Stage-Gate Governance
The credibility of a Value Creation Plan presentation hinges on execution sequencing. PE boards and operating committees are intimately aware of execution risk; they know that even the most compelling strategic theses fail without rigorous project management.
To demonstrate execution feasibility, the VCP deck must map initiatives across a structured First 100 Days timeline, transitioning seamlessly into a 4-stage gating process that governs the multi-year holding period:
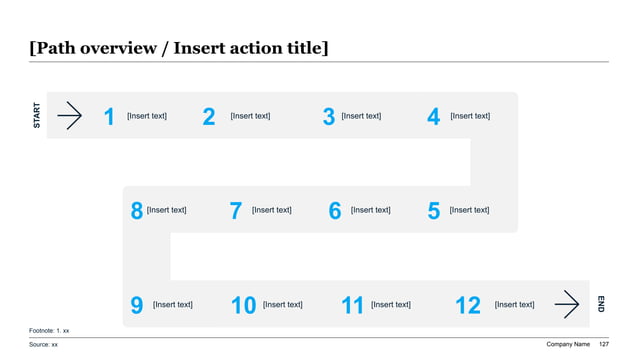
- Stage 1: Diagnostic & Opportunity Identification (Days 1–30). Focuses on rapid baseline discovery, employee interviews, vendor contract collection, customer segmentation, and initial hypothesis formulation. - Stage 2: Initiative Chartering & Solution Design (Days 31–60). Translates broad ideas into rigorous business cases. Each initiative charter specifies the baseline cost, target run-rate EBITDA, required Capex/Opex investment, implementation milestones, key performance indicators (KPIs), and clear risk mitigations. - Stage 3: Operational Piloting & Validation (Days 61–90). Tests new pricing structures, sales commission plans, or procurement vendor tenders in limited test environments or regional pilots to validate assumptions and refine rollout models. - Stage 4: Full-Scale Execution & Run-Rate Realization (Days 91–365+). Full organizational rollout, supported by automated weekly Transformation Office dashboard tracking, board variance reporting, and financial auditing by the corporate controller.
Exhibit 4: First 100-Day Execution Roadmap & Governance Sequence
VCP Initiative Charter & Stage-Gate Governance Matrix
Governance scorecard defining stage-gate criteria, approval authorities, delivery evidence required, and escalation triggers across each transformation milestone.
| Stage Gate | Governance Milestone | Approval Authority | Required Evidence & Documentation | Red Flag / Escalation Trigger |
|---|---|---|---|---|
| Gate 1 (Day 30) | Diagnostic & Opportunity Sizing Sign-off | PortCo CEO & PE Operating Partner | Validated baseline financial model, high-level opportunity sizing deck, and talent assessment scorecards. | Variance > 15% between underwritten IC thesis and Day-1 audited financial baseline. |
| Gate 2 (Day 60) | Detailed Initiative Charter & Business Case Approval | Transformation Office (PMO) & PortCo CFO | Signed initiative charter, month-by-month cash flow schedule, required software Capex quotes, and RACI matrix. | Initiative payback period exceeds 18 months or lacks designated executive owner. |
| Gate 3 (Day 90) | Pilot Testing & Operational Readiness Validation | Steering Committee / Workstream Leads | Pilot customer feedback data, CPQ test transaction logs, supplier tender proposal evaluations, and risk mitigation register. | Pilot pricing friction causes unexpected customer churn > 2.0% in test cohort. |
| Gate 4 (Day 100) | Full VCP Board Approval & Capital Allocation | Board of Directors & PE Operating Committee | Comprehensive 40-slide Value Creation Plan deck, integrated multi-year 3-statement model, and MEIP incentive matrix. | Lack of management alignment on EBITDA delivery milestones or unfunded Capex gap. |
| Gate 5 (Month 6) | Early Run-Rate Delivery & P&L Flow-Through Audit | PortCo CFO & Sponsor Investment Lead | General ledger reconciliation proving initiative dollars have flowed into reported monthly P&L figures. | Reported P&L EBITDA fails to reflect scheduled initiative run-rate benefits. |
| Gate 6 (Month 12) | Annual VCP Re-Underwriting & Second-Wave Launch | Board of Directors | Comprehensive review of Wave 1 initiative delivery, exit multiple trajectory audit, and Wave 2 growth initiative launch. | Holding period MOIC trajectory drops below 2.0x hurdle under updated financial projections. |
Transformation Governance: PMO Cadence, Incentive Alignment, and Board Reporting
The final section of the VCP deck must establish the institutional governance infrastructure that guarantees execution discipline throughout the multi-year holding period. Without continuous tracking and board accountability, even the most elegantly designed initiative charters gather dust on corporate servers.
Institutional PE governance architectures rely on three interconnected pillars:
1. The Transformation Office (TO) Operating Rhythm: Slides must outline the exact meeting cadence, attendance, and reporting deliverables across organizational tiers: - Weekly Workstream Standup (30 min): Workstream owners review operational milestones, resolve frontline roadblocks, and track leading operational indicators (e.g., quotes issued, vendor contracts signed, software test scripts completed). - Bi-Weekly PMO Review (60 min): CEO, CFO, and Transformation Director review cross-functional dependencies, resource constraints, and stage-gate progression against budget. - Monthly Operating Committee Review (90 min): PE Operating Partner, PortCo Executive Committee, and Sponsor Deal Lead conduct a formal audit of realized P&L EBITDA vs. underwritten VCP targets, reviewing variance explanations and corrective action plans. - Quarterly Board Meeting: Strategic review of multi-year enterprise value expansion, M&A pipeline execution, capital structure optimization, and exit readiness timing.
2. Management Equity Incentive Plan (MEIP) Alignment: The presentation should clearly articulate how executive compensation aligns with VCP execution. When portfolio executives see direct linkage between milestone delivery (e.g., achieving Gate 3 pricing realization or Gate 5 procurement savings) and equity vesting hurdles, execution speed accelerates exponentially. Structuring MEIP hurdles around specific MOIC tiers (e.g., 2.0x, 2.5x, 3.0x) and IRR thresholds ensures unanimous financial alignment.
3. Single Source of Truth Reporting Dashboard: Standardize VCP reporting using clear, automated executive dashboards. The deck should showcase the proposed monthly reporting format: an executive summary dashboard displaying total VCP EBITDA realized vs. target, workstream traffic-light health, Capex burn vs. budget, leading operational KPI metrics, and updated exit equity value projections.
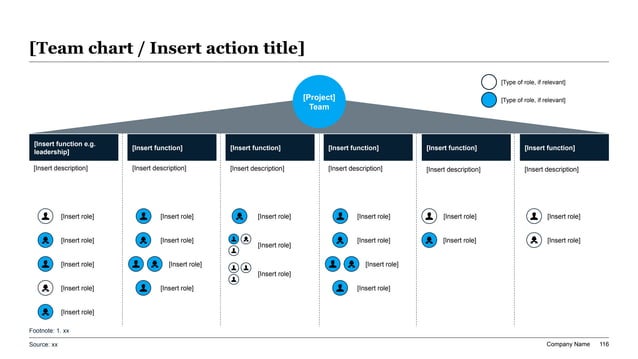
Exhibit 5: Value Creation PMO & Workstream Accountability Architecture
Operating Committee & Board VCP Approval Readiness Checklist
Common Pitfalls in PE Value Creation Decks and How to Eliminate Them
Drawing on dozens of portfolio reviews across leading middle-market and mega-cap private equity funds, several recurring mistakes consistently derail VCP presentations. Avoiding these executive traps is essential for maintaining sponsor confidence and board alignment:
1. The 'Hero Target' Fallacy: Presenting massive, ungrounded round numbers ('$10 million from international expansion') without demonstrating unit-economic feasibility. Operating committees dismiss ungrounded projections immediately. Every macro target must decompose into transaction counts, average order values, sales rep hiring ramp curves, and historical conversion benchmarks.
2. Conflating Run-Rate with Cash Flow: Announcing that an initiative generates '$4.0M in run-rate savings' starting in Q3, while ignoring that only $1.0M will physically impact the current fiscal year's cash balance due to severance schedules, vendor contract notice periods, and software deployment lead times. Experienced CFOs and PE operating partners demand clear cash timing schedules.
3. Overloading Management with 50+ Micro-Initiatives: Launching an exhaustive list of minor improvements dilutes executive focus. Portfolio management teams possess limited operational bandwidth. The VCP presentation must ruthlessly prioritize the top 8 to 12 high-impact initiatives that move the enterprise value needle, explicitly parking lower-priority ideas into a future 'Wave 2' backlog.
4. Failing to Model Capability Reinvestment: Projecting millions in cost savings without showing the necessary investments in organizational talent, cybersecurity, modern financial reporting systems, and technical infrastructure. Sponsor boards view cost-only plans as unsustainable 'slash-and-burn' strategies that impair exit multiples.
5. Relying on Passive Status Bullets: Populating progress slides with vague narrative updates like 'Continued discussions with European distributors' rather than quantitative progress metrics like 'Signed contract with Tier-1 UK distributor; first container shipment scheduled for Oct 12; $1.2M ARR run-rate locked'.
Executive AI Prompt Recipe: Structuring a Private Equity VCP Deck in XLSlides
Act as a Senior Private Equity Operating Partner at an elite buyout firm (such as Blackstone, Bain Capital, or Francisco Partners). Structure and generate a comprehensive, board-ready 10-slide Value Creation Plan (VCP) presentation for the Operating Committee and Board of Directors evaluating [Portfolio Company Name], a middle-market [Industry / Sector, e.g., B2B Industrial Automation] provider generating $[XX]M in Revenue and $[XX]M in LTM Adjusted EBITDA (current margin: [XX]%). Operational & Financial Inputs: - Holding Period Target: Expand EBITDA from $[XX]M to $[XX]M over a 4-year hold, targeting a [X.X]x MOIC and [XX]% IRR at exit. - Strategic Value Pillars: (1) Commercial Pricing & GTM Velocity, (2) Direct Procurement & Operational Lean Excellence, (3) Digital Scale & Shared Services. - Key Operational Levers: Pricing optimization ($[X.X]M net), procurement spend consolidation ($[X.X]M net), sales pod productivity ($[X.X]M net), manufacturing cell redesign ($[X.X]M net), and add-on M&A overhead synergies ($[X.X]M net). - Required Capability Reinvestment: $[X.X]M in enterprise ERP rollout and hiring VP of Product / Chief Revenue Officer. - First 100 Days Milestones: Diagnostic completion by Day 30, charter sign-offs by Day 60, pricing pilot rollout by Day 90, full board presentation at Day 100. Output Slide Architecture Requirements: 1. Slide 1 (Executive Summary): Action title summarizing the core transformation thesis, macroeconomic positioning, and underwritten enterprise value upside. 2. Slide 2 (Reconciled Baseline & Underwriting Bridge): Side-by-side comparison reconciling pre-deal IC assumptions vs Day-1 audited operational reality. 3. Slide 3 (Master Value Creation Architecture): 3-pillar strategic framework categorizing the 11 prioritized operational initiatives with clear dollar-value tags. 4. Slide 4 (EBITDA Expansion Waterfall): Granular 7-step EBITDA bridge starting from Baseline LTM EBITDA and walking to Year-4 Target Exit EBITDA, itemizing pricing, procurement, sales velocity, operational cost-out, and required reinvestment. 5. Slide 5 (Commercial & Pricing Excellence Deep-Dive): Detailed breakdown of customer price realization, CPQ discounting controls, and contract escalation mechanisms. 6. Slide 6 (Procurement & Manufacturing Operational Levers): Direct spend category consolidation table, freight logistics renegotiation, and facility footprint optimization. 7. Slide 7 (First 100 Days Chronological Roadmap): 12-step serpentine or multi-phase timeline detailing weekly operational milestones across Days 1–30, 31–60, 61–90, and 91–100. 8. Slide 8 (Initiative Charter & Stage-Gate Governance Matrix): Detailed matrix defining Stage Gates 1 through 6, specifying required delivery evidence, approval authorities, and red-flag escalation triggers. 9. Slide 9 (Transformation Office Operating Rhythm & Accountability): Organizational chart mapping PE Operating Partner, CEO, CFO, and PMO workstream leads, accompanied by weekly/monthly meeting rhythms. 10. Slide 10 (Exit Multiple Sensitivity & LP Return Profile): Matrix modeling enterprise value and investor equity returns across varying exit multiples (e.g., 9x, 11x, 13x EBITDA), proving underwriting resilience. Tone & Formatting Constraints: - Use definitive executive action titles on every slide (stating the conclusion and strategic takeaway, never passive labels like 'Agenda' or 'Initiatives'). - Maintain strict MECE (Mutually Exclusive, Collectively Exhaustive) structure. - Include specific numerical figures, percentages, dollar values, and verifiable operational metrics in all tables and visual callouts. - Format output as clean, production-ready PowerPoint specifications optimized for XLSlides generation.
The XLSlides Advantage: Institutional Precision for PE Deal & Operating Teams
Crafting a board-ready Value Creation Plan presentation traditionally consumes hundreds of hours of senior executive and consulting time. Deal leads and operating partners often find themselves stuck between two bad alternatives: paying $500,000+ to strategy consulting firms for standard slide templates, or spending midnight hours manually aligning shapes, formatting financial waterfalls, and formatting tables in standard PowerPoint.
Generic AI presentation generators cannot solve this problem because they are designed for generic consumer slides, marketing pitches, or school projects. They generate cartoonish illustrations, superficial three-word bullet points, and unstructured layouts that would be laughed out of a private equity board meeting.
XLSlides is engineered specifically for institutional corporate finance, private equity, and management consulting workflows: - Financial Table & Waterfall Rigor: Automatically convert raw financial schedules, QoE audit tables, and initiative tracking sheets into clean, professional PowerPoint tables and structured bridge exhibits. - Action Title & MECE Hierarchy: Enforce answer-first executive logic across every generated slide, ensuring that headers state the definitive strategic conclusion supported by structured data cards. - Native Editable PowerPoint Output: Every chart, table, icon, and text box exports as a 100% native vector PowerPoint element (.pptx), enabling deal teams to fine-tune figures, adjust corporate brand colors, and update data right up until the board meeting begins. - Pre-Built Institutional Frameworks: Access an extensive catalog of verified private equity slide architectures—including 100-day serpentine roadmaps, stage-gate matrices, transformation office hierarchies, and EBITDA bridge waterfalls.
Frequently Asked Questions About Private Equity Value Creation Plans
What is the primary difference between an Investment Committee Memo and a Value Creation Plan?
An Investment Committee (IC) memo is a pre-deal evaluative document designed to justify acquisition valuation, risk-adjusted returns (target IRR and MOIC), and debt financing terms to fund partners. In contrast, a Value Creation Plan (VCP) is a post-deal operational blueprint crafted during the first 100 days post-close that translates the high-level underwriting thesis into discrete operational workstreams, initiative charters, month-by-month financial bridges, and governance rhythms executed by portfolio company management.
How long should a Private Equity Value Creation Plan deck be?
A comprehensive executive VCP presentation is typically 30 to 45 slides in total, structured into a 12 to 15-slide executive core for board presentation, followed by detailed 25 to 30-slide appendix modules containing individual initiative charters, technical IT roadmaps, detailed procurement category spend data, and full 3-statement financial reconciliations.
Who is responsible for authoring the Value Creation Plan?
The VCP is a collaborative deliverable authored jointly by the Portfolio Company CEO, CFO, and executive leadership team in close partnership with the sponsor's PE Operating Partner and dedicated Transformation Office (TO/PMO) director. External strategy consultants (such as Bain, Alvarez & Marsal, or McKinsey) are frequently engaged during the first 60 days to conduct rapid diagnostics and financial modeling.
What are the most common operational levers included in a PE EBITDA bridge?
The most common operational levers are: (1) Strategic pricing optimization and CPQ discount controls, (2) Direct and indirect procurement spend consolidation, (3) Go-to-market sales rep capacity and quota restructuring, (4) Operational footprint and manufacturing lean optimization, (5) Back-office G&A automation and shared services, and (6) Strategic add-on M&A synergy capture, offset by required capability reinvestment in talent and technology.
How does the Transformation Office (TO) monitor VCP execution?
The Transformation Office operates on a strict multi-tiered governance cadence: weekly 30-minute operational standups with workstream owners to unblock bottlenecks, bi-weekly PMO milestone reviews with the CEO and CFO, and monthly Operating Committee reviews with the PE sponsor to reconcile reported P&L figures against scheduled initiative run-rate targets using red/yellow/green stage-gate scorecards.
Why do generic AI presentation generators fail at creating PE Value Creation Decks?
Generic AI slide generators fail because they rely on simplistic bullet-point generation, decorative stock graphics, and consumer-oriented templates. They lack the capability to build rigorous multi-step EBITDA bridges, structured stage-gate matrices, spend category heatmaps, and native editable PowerPoint shapes that private equity operating committees demand for multi-million dollar capital allocation decisions.
Build Institutional-Grade PE Value Creation Decks in Minutes with XLSlides
Eliminate midnight PowerPoint formatting frustration. XLSlides empowers private equity operating partners, portfolio CEOs, and strategy consultants to convert raw operational models, initiative charters, and financial bridges into polished, board-ready executive presentations with institutional layout discipline, MECE logic, and 100% editable PowerPoint output.