Executive Direct Answer: What Distinguishes an Institutional Restructuring & Turnaround Presentation?
An institutional restructuring and turnaround presentation is a high-stakes corporate governance deliverable that bridges raw financial distress, thirteen-week rolling cash forecasts (TWCF), operational cost-out initiatives, and creditor recovery waterfalls into an unassailable plan of reorganization. Unlike standard venture pitch decks, commercial sales proposals, or routine quarterly business reviews (QBRs), a turnaround presentation operates in an unforgiving, zero-tolerance environment where institutional credibility has been severely depleted, cash runway is measured in weeks or days, and counterparties (senior lenders, bondholders, trade creditors, and special board committees) hold conflicting legal and financial claims.
To re-establish leadership credibility and secure vital stakeholder concessions—such as credit facility covenant waivers, maturity extensions, emergency debtor-in-possession (DIP) financing, or consensual debt-for-equity recapitalizations—a turnaround presentation must adhere to three non-negotiable principles:
1. Complete Cash Truth & 13-Week Liquidity Transparency: Accrual P&L metrics must take a secondary role to cash flow reality. The presentation must establish the exact baseline of unrestricted operating liquidity, detail weekly customer collection variance against historical payment timing, and outline non-discretionary disbursements (payroll, critical vendor payments, debt service, and restructuring fees) to prove the enterprise has sufficient liquidity runway to execute its operational fixes.
2. De-Averaged Operational Turnaround Bridges: Vague cost reduction promises or generic synergy targets destroy credibility in a workout room. Every operational turnaround initiative must be segmented into distinct operational workstreams (headcount rationalization, third-party vendor renegotiation, manufacturing scrap reduction, SKU pruning, and commercial price realization). Each initiative must feature a dedicated business case, a designated operational owner, capital expenditure requirements, realization timelines, and probability-weighted risk haircuts.
3. Creditor Recovery & Capital Structure Solvency: Presentations to lenders and creditor committees must clearly demonstrate that the proposed operational restructuring restores sustainable debt service capacity (Interest Coverage > 2.5x, Net Debt/EBITDA < 3.5x). Furthermore, the presentation must contrast the estimated enterprise recovery value under the operational turnaround against the liquidation recovery value in a forced Chapter 7 asset fire sale, proving beyond doubt that all creditor tiers maximize economic recovery by supporting management's turnaround plan.
Generic AI slide generators that produce superficial bullet points, whimsical decorative illustrations, and unverified data tables are utterly unacceptable in high-stakes turnaround environments. Turnaround advisors, Chief Restructuring Officers (CROs), and corporate finance leaders require McKinsey-grade MECE structuring, defensible financial bridge waterfalls, rigorous milestone gating tables, and editable native PowerPoint formats that withstand intense forensic scrutiny by forensic accountants and bankruptcy counsel.
Table 1: Turnaround Presentation Architecture Matrix: Core Sections, Slide Counts, Exhibits, and Stakeholder Traps
An institutional turnaround deck follows a rigid 5-part architecture. Each section addresses a distinct governance objective, deploys specific quantitative exhibits, and avoids fatal presenter traps that alienate lenders and board committees.
| Turnaround Section | Recommended Slide Count | Primary Governance Objective | Core Analytical Exhibits | Fatal Presenter Trap to Avoid |
|---|---|---|---|---|
| 1. Executive Summary & Situation Diagnosis | 2 to 3 slides | Establish unvarnished diagnostic truth, diagnose root causes of distress, and outline the immediate 3-stage stabilization roadmap. | High-level EBITDA bridge; historical vs. distressed variance waterfall; 3-stage turnaround roadmap timeline. | Blaming external market headwinds exclusively while ignoring internal execution failures, cost creep, and delayed management reaction. |
| 2. 13-Week Cash Flow & Liquidity Runway | 3 to 4 slides | Prove immediate cash solvency, quantify minimum operating liquidity floor, and establish zero-cash date under conservative assumptions. | 13-week rolling cash forecast (TWCF) table; receipts & disbursements waterfall; liquidity headroom vs. covenant lines; AP aging analysis. | Concealing trapped overseas cash, restricted escrow balances, or upcoming balloon lease/tax obligations from liquidity headroom calculations. |
| 3. Operational EBITDA Bridge & Cost Rationalization | 4 to 6 slides | Detail self-help operational initiatives, SG&A rationalization, commercial fixes, and working capital optimization programs. | Distressed-to-Run-Rate EBITDA bridge; segmented cost-out column chart; Transformation Office (TO) master initiative tracker; risk grid. | Presenting gross savings targets without deducting severance, restructuring advisory fees, IT carve-out costs, or friction capex. |
| 4. Capital Structure, Debt Capacity & Creditor Recovery | 3 to 5 slides | Present sustainable debt capacity, covenant cure trajectory, restructuring options, and creditor recovery waterfalls. | Debt maturity ladder; credit facility headroom chart; pro-forma leverage & interest coverage schedule; going-concern vs liquidation matrix. | Proposing unrealistic debt-for-equity haircuts or maturity extensions without offering lenders structural enhancements or equity upside. |
| 5. Governance, Transformation Office PMO & Weekly Milestones | 2 to 3 slides | Demonstrate execution rigor, clear accountability, decision thresholds, and weekly reporting rhythm to restore board and creditor confidence. | Restructuring governance org chart; CRO/PMO RACI matrix; 100-day milestone Gantt chart; weekly steering committee dashboard. | Failing to designate single-point operational owners or leaving stage-gate approval thresholds undefined between CRO and existing management. |
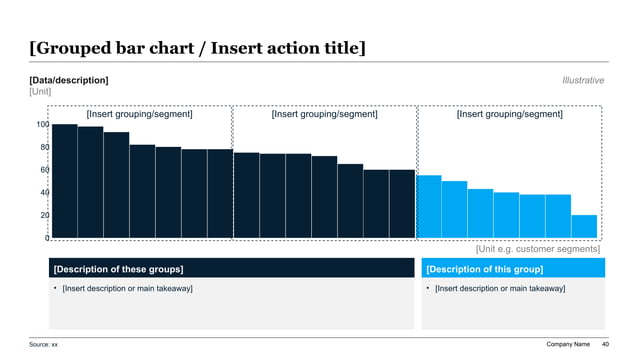
Exhibit 1: Operational Cost-Out & SG&A Rationalization Waterfall
Four Non-Negotiable Principles of High-Stakes Restructuring Presentations
- Cash Is the Only Currency of Turnaround Credibility: Accrual P&L improvements mean nothing if the enterprise runs out of liquidity before initiatives bear fruit. Every presentation must anchor on weekly receipts, mandatory disbursements, and net cash headroom against contractual covenant floors.
- Enforce Strict Stage-Gating Between Identified Ideas and Banked Cash: Never present aspirational cost cuts as guaranteed results. Categorize initiatives strictly across Stage 1 (Ideation), Stage 2 (Detailed Business Case), Stage 3 (In-Flight Execution), and Stage 4 (Realized in Bank Balances).
- Confront Root Causes Honestly—Never Sugarcoat Historical Missteps: Lenders, credit committees, and turnaround boards can detect evasive narratives immediately. Disclose historical operational failures directly, demonstrate root-cause comprehension, and show why structural governance changes prevent recurrence.
- Always Frame Creditor Concessions Against Liquidation Downside: In debt workout presentations, prove quantitatively through enterprise valuation and asset appraisal that consensual debt restructuring yields significantly higher recovery percentages than an adversarial liquidation.
The Four Distinct Restructuring Audiences: Calibrating Narrative and Exhibits
A critical error in distressed corporate communications is attempting to present a single, generalized slide deck to all corporate stakeholders. In restructuring, different stakeholders hold fundamentally divergent, and frequently antagonistic, legal mandates, fiduciary duties, and financial incentives. An institutional Chief Restructuring Officer or financial advisor meticulously tailors the turnaround narrative, exhibits, and level of operational granularity to each specific audience.
1. The Board of Directors & Special Restructuring Committee: The board's primary focus in distress is preserving enterprise value while fulfilling strict fiduciary duties to avoid insolvent trading or fraudulent conveyance claims. The presentation for the board must focus on strategic options appraisal (comparing out-of-court operational turnaround vs. Section 363 sale vs. Chapter 11 reorganization), liquidity runway and solvency milestones (identifying drop-dead dates before cash dips below minimum operating thresholds), director liability and indemnification (payroll taxes, D&O insurance, pension obligations), and management accountability.
2. Senior Secured Lenders & Bank Syndicate Credit Committees: Senior lenders hold liens over the company's accounts receivable, inventory, intellectual property, and real estate. They care primarily about capital preservation, borrowing base compliance, and downside coverage. Slides for senior lenders must emphasize 13-week cash flow receipts and disbursements with weekly variance tracking, borrowing base collateral coverage (dilution rates, ineligible reserves, inventory appraisals), and covenant compliance projections (FCCR, senior leverage ratios, liquidity buffers).
3. Junior Creditors, Mezzanine Funds & Ad-Hoc Noteholder Committees: Unsecured noteholders and mezzanine lenders face severe impairment or total wipeout if the company enters liquidation. Their interest lies in enterprise valuation, business model viability, and long-term equity recovery. Decks for junior creditors must demonstrate sustainable post-restructuring run-rate EBITDA and margin expansion potential, comprehensive debt-for-equity recapitalization models under multiple valuation multiples, and liquidation analysis showing zero recovery in Chapter 7 vs. 65-85% recovery in a consensual reorganization.
4. Operating Business Unit Leaders & Transformation Leads: Internal business leaders need clarity, tactical execution roadmaps, and psychological stability amidst restructuring turmoil. Slides for operational leadership must provide clear initiative ownership and milestone schedules without demoralizing corporate jargon, resource allocation (IT, HR, and procurement support), and quick-win identification to build execution momentum.
Checklist 1: CRO 72-Hour Day-1 Liquidity & Stabilization Audit
13-Week Cash Forecasting (TWCF) & The Cash Flow Bridge to Solvency
In any restructuring presentation, the Thirteen-Week Cash Forecast (TWCF) is the foundational document upon which all corporate credibility rests. Credit committees and restructuring courts view long-term 5-year business plans with deep skepticism; however, they scrutinize the 13-week cash model on a row-by-row, column-by-column basis. If the TWCF exhibits flawed assumptions, missing disbursement categories, or unexplained variance swings, external advisors will immediately assume the company has lost operational control.
Core Structural Components of an Institutional TWCF Slide: An executive-level TWCF slide must distill hundreds of ledger rows into four clean, digestible reporting tiers: (1) Cash Receipts (operating collections segmented by customer tiers and AR aging brackets Current/30/60/90 days with collection lag haircuts, plus non-operating inflows); (2) Operating Disbursements (gross payroll, payroll taxes, 401(k), healthcare benefits, critical raw material vendors, rent, utilities, and essential operating SG&A); (3) Non-Operating & Restructuring Disbursements (revolver interest, term loan amortization, and professional restructuring fees for legal counsel, investment bankers, and financial advisors); and (4) Net Liquidity & Headroom Reconciliation (beginning cash, net cash flow, ending cash, undrawn revolver capacity, total net available liquidity, and distance above the minimum liquidity operating floor).
The Variance Bridge Slide: A standalone 13-week forecast is incomplete without a dedicated Weekly Variance Bridge. The variance bridge compares last week's forecast to actual cash results across receipts and disbursements, isolating permanent variances (e.g., customer insolvency, lost accounts) from timing variances (e.g., collection delayed from Friday to Tuesday). Demonstrating that actual net cash flow matches forecasted cash flow within a ±3% margin over 4 consecutive weeks is the single fastest way to restore lender trust.
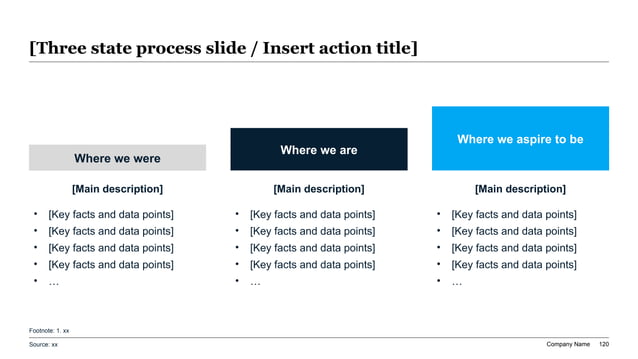
Exhibit 2: The 3-Stage Turnaround Roadmap: Emergency Stabilization, Operational Reset, and Sustainable Solvency
The Operational Turnaround EBITDA Bridge: Reversing Structural Margin Erosion
While the 13-week cash forecast secures near-term survival, the Operational EBITDA Bridge proves long-term enterprise viability. Lenders will not agree to covenant amendments or debt relief unless they see a clear, mathematically defensible path from current distressed financial performance to sustainable, cash-generative EBITDA margins.
An institutional EBITDA bridge slide starts at Historical Distressed EBITDA (often break-even or negative) and steps horizontally through five distinct operational categories to reach Stabilized Run-Rate Restructured EBITDA:
1. Commercial & Pricing Rationalization: Terminating negative-contribution SKUs and unprofitable customer contracts, enforcing strict price realization and commodity surcharge pass-through, and eliminating off-invoice unearned volume rebates.
2. Direct Cost-of-Goods-Sold (COGS) Optimization: Rightsizing shift scheduling to eliminate unbudgeted overtime, consolidating procurement spend across the top 80% of vendor contracts, and implementing shop-floor root-cause fixes to reduce scrap rates.
3. SG&A & Overhead Compression: Flattening organizational layers to reduce middle-management overhead, rationalizing redundant enterprise software licenses, and consolidating excess real estate facilities.
4. One-Time Restructuring Costs & Friction Offsets: Credibility is lost when presenters show only gross cost savings. The bridge must explicitly feature negative stepping bars for one-time cash costs: severance packages, lease break penalties, inventory write-downs, and temporary retention bonuses.
5. Probability-Weighted Haircuts: Sophisticated turnaround presenters apply strict realization haircuts: 100% of realized Stage 4 savings, 75% of Stage 3 in-flight initiatives, 50% of Stage 2 validated business cases, and 0% of Stage 1 ideas. This conservative approach prevents over-promising and under-delivering to skeptical credit committees.
Table 2: Turnaround Initiative Valuation & Realization Risk Grid
To maintain credibility with credit committees, every operational turnaround initiative must be stress-tested for implementation complexity, capital required, realization timeline, and execution risk gating.
| Initiative Workstream | Target Levers & Interventions | Run-Rate EBITDA Impact ($M) | One-Time Cash Cost ($M) | Cash Realization Velocity | Implementation Risk & Gating |
|---|---|---|---|---|---|
| Commercial & Pricing Reset | Eliminate bottom 15% unprofitable SKUs; enforce minimum gross margin floors; pass through commodity surcharges. | $14.5M | $0.8M (Customer transition) | Weeks 4 to 12 (Immediate billing impact) | Low to Medium. Customer attrition risk offset by gross margin expansion on retained accounts. |
| Procurement & Spend Rationalization | Renegotiate top 50 direct/indirect supplier contracts; mandate single-source RFP benchmarking; halt spot purchases. | $18.2M | $0.4M (Legal contract review) | Weeks 8 to 20 (Reflected in procurement run-rate) | Low. Standard commercial terms; low operational friction; requires strict purchase order gating. |
| Organizational Rightsizing & De-Layering | Consolidate regional sales management; flatten 3 middle-management layers; eliminate corporate duplication. | $22.0M | $4.5M (Severance & retention) | Weeks 6 to 16 (Immediate payroll reduction) | Medium. Requires careful institutional knowledge transfer and key personnel retention agreements. |
| Manufacturing & Logistics Productivity | Consolidate 2 distribution warehouses; optimize shift patterns; reduce freight expedited expedite costs. | $11.8M | $2.8M (Warehouse lease exit & logistics) | Weeks 12 to 26 (Operational consolidation) | Medium to High. Requires tight inventory buffering to prevent order fulfillment disruption. |
| Working Capital Cash Acceleration | Enforce strict 30-day AR terms; liquidate slow-moving inventory; stretch non-critical AP to standard 60-day terms. | $16.0M (One-time cash release) | $0.2M (Collection incentives) | Weeks 2 to 10 (Immediate liquidity injection) | Low. Standard working capital optimization; improves 13-week cash runway immediately. |
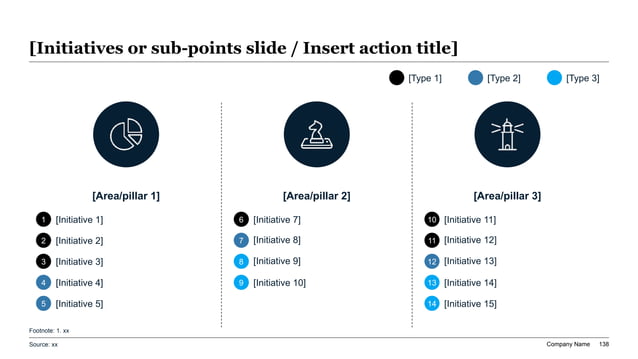
Exhibit 3: Transformation Office (TO) Master Initiative Tracker
Presenting to Secured Lenders, Private Credit, and Creditor Committees
When presenting to a bank syndicate or private credit workout team, the tone of the presentation must transition from operational enthusiasm to cold financial realism. Commercial lenders do not invest in optimistic upside; their mandate is risk mitigation, collateral preservation, and contractual recovery. Every slide in the creditor presentation must anticipate the skeptical queries of the credit committee.
Critical Slide Modules for the Creditor Presentation:
1. The Debt Maturity Ladder & Capital Structure Overview: A clean, stacked horizontal bar chart displaying debt tranches ordered by structural seniority (First Lien Revolver / ABL, Senior Secured Term Loan A/B, Second Lien Notes, Subordinated Mezzanine Debt, and Unsecured Trade Payables), visualizing the upcoming debt wall and refinancing requirements over the next 36 months.
2. Financial Covenant Stress-Testing & Cure Profile: Mapping historical and pro-forma Net Debt / EBITDA leverage and Interest Coverage against contractual covenant step-downs, demonstrating that under the proposed covenant reset, the business achieves adequate covenant headroom (minimum 15-20% buffer) even under conservative sensitivity scenarios.
3. The Liquidation Analysis (The Going-Concern Arbitrage): The single most persuasive exhibit in a distressed lender deck is the Orderly Liquidation Value (OLV) vs. Going-Concern Recovery Comparison. In an orderly liquidation, accounts receivable are heavily discounted (collections drop to 50-65% due to customer offsets), inventory is sold off at scrap value (20-40% of book value), and intellectual property yields negligible recovery. After paying professional bankruptcy fees, senior lenders face significant impairment, and junior creditors receive zero. In contrast, under the consensual restructuring plan, enterprise value is preserved, senior debt is fully covered or reinstated, and junior lenders receive meaningful recovery through restructured debt notes or equity ownership. Presenting this clear contrast provides the economic justification for lenders to approve debt concessions.
Table 3: Creditor Restructuring Options & Recovery Waterfall Matrix
Comparing the primary out-of-court and in-court restructuring pathways available to distressed corporations, evaluating lender consensus requirements, cost, execution timeline, and value preservation.
| Restructuring Pathway | Legal & Procedural Framework | Lender Approval Threshold | Execution Timeline & Cost | Senior Secured Recovery | Equity & Junior Creditor Impact |
|---|---|---|---|---|---|
| Consensual Amend & Extend (Out-of-Court) | Commercial negotiation with existing credit syndicate to extend maturities, waive covenants, and adjust margins. | 100% of affected lenders (for maturity/coupon) or 50.1-66.7% (for technical covenant waivers). | 6 to 12 weeks; Low professional fee burden ($0.5M to $1.5M). | 100% par value preserved; enhanced collateral package, warrants, or consent fees granted. | Zero equity dilution; operational control retained; existing capital structure intact. |
| Out-of-Court Debt-for-Equity Recapitalization | Comprehensive debt restructuring exchanging junior debt tranches for majority equity ownership, reducing annual debt service. | 90-95% of noteholders/junior lenders required; consensual agreement among major debt classes. | 8 to 16 weeks; Moderate professional fees ($1.5M to $4.0M). | Senior debt reinstated or partially paid down; loan-to-value (LTV) significantly reduced. | Substantial equity dilution (existing equity diluted to 5-15% or warrant stub); junior debt becomes majority owners. |
| Pre-Packaged Chapter 11 / Scheme of Arrangement | Restructuring plan negotiated and voted on prior to filing; court confirms plan rapidly under statutory rules. | Statutory threshold: 66.7% in dollar amount and 50% in number of voting claims per impaired class. | 45 to 90 days in court; Moderate to high costs ($4M to $10M). | Full or high recovery under agreed plan; binds dissenting minority creditors legally. | Pre-negotiated equity and debt distribution; minimizes commercial disruption and vendor panic. |
| Free-Fall Chapter 11 Reorganization | Emergency court filing without pre-negotiated plan; requires Debtor-in-Possession (DIP) financing and court supervision. | Varies by class voting; subject to cramdown provisions under Section 1129(b) of Bankruptcy Code. | 6 to 18+ months; Very high professional costs ($10M to $30M+). | Recovery dependent on DIP availability and enterprise valuation; risk of extended valuation litigation. | Existing equity typically wiped out; unsecured creditors receive pennies on the dollar or equity stub. |
| Section 363 Distressed Asset Sale | Expedited court-supervised auction selling assets free and clear of liens to highest bidder. | Court approval following competitive stalking-horse auction process. | 60 to 120 days; High legal and transaction banking fees. | Net proceeds paid strictly in order of legal priority; senior debt satisfied first. | Junior creditors and equity receive proceeds only if senior debt is paid in full (rare in distressed sales). |
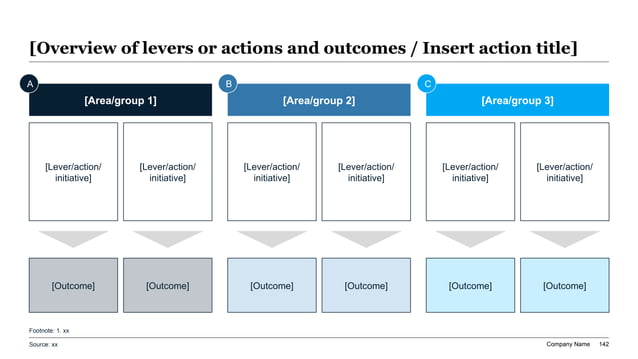
Exhibit 4: Operational Turnaround Levers to EBITDA Bridge
Restructuring Governance, Transformation Office (TO) PMO, and Weekly Cadence
The most brilliantly designed turnaround strategy is useless without an uncompromising execution engine. Lenders and corporate boards have witnessed dozens of corporate plans fail due to executive inertia, organizational resistance, and lack of accountability. An institutional restructuring presentation must dedicate a section to demonstrating how the Transformation Office (TO) and Restructuring PMO will enforce operational execution on a day-to-day basis.
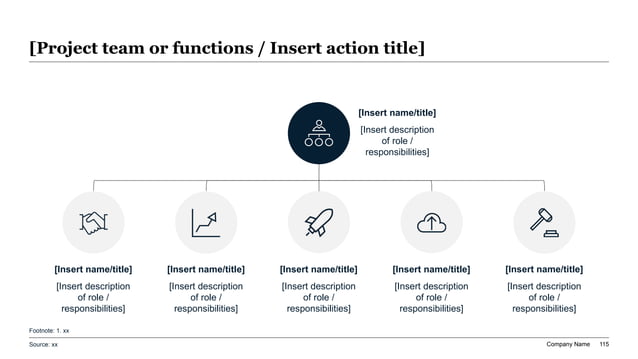
The Turnaround Leadership Structure: An effective turnaround governance slide details the operational reporting relationships between the Chief Restructuring Officer (CRO) reporting directly to the Special Board Committee with veto power over non-budgeted cash releases, the Cash Management Office (CMO) directing daily cash disbursements and rolling TWCF models, workstream executive sponsors accountable for each cost-out pillar, and the Program Management Office (PMO) tracking stage-gate initiative milestones.
The Weekly Rhythm of Accountability: The presentation must articulate the weekly cadence that governs the company during restructuring: Monday morning CMO cash reviews reconciles prior-week cash variance; Tuesday afternoon initiative stage-gate sessions evaluate business cases moving from Stage 1 to Stage 2 or Stage 3; Thursday morning operational standups eliminate supply and staffing bottlenecks; and Friday afternoon delivers a concise 3-slide executive flash dashboard to the Special Committee and syndicate administrative agents.
Exhibit 5: Restructuring Governance Architecture: CRO & Transformation Office Alignment
Checklist 2: Lender-Ready Turnaround Deck Quality Gate & Credibility Audit
Comprehensive Prompt Recipe: Multi-Step Corporate Turnaround Deck Generator
Act as an elite Senior Restructuring Partner and Chief Restructuring Officer (CRO) with 20+ years of experience leading corporate turnarounds, debt workouts, and operational transformations at firms like Alvarez & Marsal, AlixPartners, and FTI Consulting. Your task is to generate a comprehensive, 12-slide institutional Restructuring and Turnaround Presentation Deck based on the following distressed corporate situation data: ### INPUT VARIABLES REQUIRED: 1. Company Overview: [Insert Company Name, Industry, Annual Revenue, Historical Peak EBITDA, Distressed LTM EBITDA]. 2. Nature of Distress: [Describe Root Causes: e.g., Debt Overhang, Contract Loss, Inflationary Margin Squeeze, Working Capital Mismanagement, Supply Chain Disruption]. 3. Liquidity Situation: [Current Unrestricted Cash, Undrawn Revolver Capacity, Minimum Operating Liquidity Floor, Average Weekly Cash Burn, Estimated Zero-Cash Date]. 4. Existing Debt Structure: [List Tranches: Senior Revolver, Term Loan B, Unsecured Notes, Accounts Payable Overdue Aging, Next Debt Maturity Date, Current Leverage & Interest Coverage]. 5. Operational Turnaround Initiatives: [List Workstreams: Commercial/Pricing Fixes, Headcount De-layering, Procurement Renegotiation, Plant/Facility Consolidation with Dollar Run-Rate Impact and Timing]. ### PRESENTATION STRUCTURE & SLIDE-BY-SLIDE SPECIFICATIONS: Generate exactly 12 structured slides. For each slide, provide: - Slide Number & Category (e.g., Executive Summary, Cash Flow, Operational Bridge, Debt Restructuring, Governance) - Action Title (Must be a complete, McKinsey-style analytical sentence stating the core finding, quantitative metric, and implication—never use passive generic titles) - Executive Subtitle (1 sentence context) - Primary Analytical Exhibit / Layout (Specify exact visual format: e.g., 13-week cash waterfall, segmented grouped column chart, 5-column initiative table, 2x2 recovery matrix) - Structured Quantitative Table or Bulleted Data (Include exact numerical figures, variance percentages, and dates; never use placeholder brackets) - Key Governance Takeaway / Decision Required (The specific action demanded from the board or lender committee) ### DETAILED SLIDE OUTLINE: - Slide 1: Title Slide (Company Name, Turnaround Plan & Reorganization Proposal, Date, Confidentiality Notice) - Slide 2: Executive Situation Diagnosis & Root Causes of Underperformance (Historical financial erosion vs. external shocks) - Slide 3: 3-Phase Turnaround Roadmap (Phase 1: Emergency Stabilization Days 1-30; Phase 2: Operational Reset Days 31-90; Phase 3: Recapitalization Days 91-180) - Slide 4: Baseline 13-Week Rolling Cash Flow Forecast (TWCF) (Weekly receipts, operating disbursements, non-operating costs, net cash, and available liquidity headroom) - Slide 5: Liquidity Preservation & Cash Office Disbursement Controls (Centralized Cash Office, vendor tiering P1/P2/P3, and payment gating thresholds) - Slide 6: Operational EBITDA Bridge: Distressed Baseline to Restructured Run-Rate (Horizontal stepping bridge: Pricing, Headcount, Procurement, Facility consolidation, Implementation friction) - Slide 7: Transformation Office Master Initiative Scorecard (10 prioritized initiatives across Commercial, Cost-out, and Working Capital with owners, milestone gating, and run-rate impact) - Slide 8: Working Capital Acceleration: DSO, DIO, and DPO Cash Harvest (Quantifying immediate balance sheet liquidity release) - Slide 9: Existing Capital Structure & Debt Maturity Wall (Seniority ranking, collateral coverage, coupon, maturity dates, and covenant breach profile) - Slide 10: Proposed Consensual Restructuring / Recapitalization Term Sheet (Covenant reset, maturity extension, debt-for-equity swap terms, and credit enhancements) - Slide 11: Enterprise Valuation & Creditor Recovery Waterfall (Orderly Liquidation Value vs. Going-Concern Recovery by Debt Tranche) - Slide 12: Turnaround Governance & 100-Day Milestone Execution Plan (CRO role, Special Board Committee cadence, weekly reporting rhythm, and drop-dead dates) ### FORMATTING & TONE GUARDRAILS: - Write with extreme institutional gravitas, precision, and financial realism. Avoid consulting hype, tech startup jargon, and emotional optimism. - Reconcile all EBITDA improvements to cash flow reality; ensure every cost-out initiative accounts for one-time severance, legal, and advisory fees. - Format all financial tables with clean alignment, clear column headers, and explicit units ($M, %, bps). - Ensure output is ready for direct transcription into Microsoft PowerPoint / XLSlides native slide layouts.
AI Slide Automation in High-Stakes Corporate Restructuring: What to Automate and What Demands Human Judgment
In high-stakes corporate restructuring, time is the rarest and most expensive asset. When a company is operating within a tight 13-week cash runway, every hour spent manually formatting slide decks, re-keying ERP spreadsheet data, aligning table borders, and adjusting waterfall chart axes is an hour diverted from negotiating with nervous lenders or stabilizing critical suppliers. The emergence of specialized AI slide generation platforms has transformed turnaround workflows; however, navigating corporate distress requires a nuanced understanding of where AI accelerates progress and where human executive judgment is non-negotiable.
Where AI Automation Delivers Massive Productivity Gains: Modern turnaround teams leverage AI automation to ingest thousands of transaction lines from disparate ERP systems (SAP, Oracle, NetSuite) and Treasury Management Systems (TMS) to format clean 13-week cash forecast tables instantly. AI platforms automatically build mathematically verified multi-step EBITDA bridges and operational cost-out waterfalls in seconds, generate dynamic sensitivity scenarios (base vs. downside cases), and convert raw operational findings into incisive MECE action titles.
Where Human Judgment Remains Irreplaceable: While AI handles structural formatting and data visualization, four critical domains remain strictly the domain of experienced human turnaround leaders: (1) Creditor negotiation game theory and managing intercreditor dynamics across debt tiers; (2) Fiduciary legal boundaries, bankruptcy filing triggers, and fraudulent conveyance liability; (3) Talent assessment, executive retention agreements, and organizational psychology; and (4) Defending operational assumptions under forensic cross-examination by credit committee advisors in contentious workout negotiations.
Recommended XLSlides Restructuring, Corporate Finance & Executive Resources
Frequently Asked Questions About Restructuring & Turnaround Presentations
What is the primary difference between an operational turnaround presentation and a financial restructuring presentation?
An operational turnaround presentation focuses on internal 'self-help' measures to fix business model performance: pricing rationalization, direct COGS cost-out, SG&A compression, manufacturing efficiency, and working capital optimization. Its core exhibit is the Operational EBITDA Bridge. In contrast, a financial restructuring presentation focuses on the right side of the balance sheet: capital structure sustainability, debt service burden, covenant relief, debt maturity extensions, and debt-for-equity swaps. In severe distress, presentations combine both: the operational plan proves the business can generate sustainable cash, while the financial restructuring provides the balance sheet runway needed to execute that plan.
How detailed should the 13-week cash flow forecast (TWCF) be in a presentation to lenders?
In the main deck, the 13-week forecast should be consolidated into high-level weekly summaries (weekly collections, payroll, critical vendors, operating disbursements, restructuring fees, net cash flow, and total available liquidity headroom). However, the appendix must contain detailed supporting exhibits: accounts receivable aging schedules, vendor payment tiering (P1/P2/P3), borrowing base certificate reconciliations, and weekly variance tracking against the prior forecast. Lenders require high-level clarity in the presentation room, supported by granular forensic backup.
How do turnaround advisors handle sensitive or confidential headcount reduction data in presentations?
Headcount reductions must be handled with strict confidentiality to prevent premature leaks that damage employee morale, accelerate voluntary departures of top performers, or trigger WARN Act compliance violations. In early-stage lender and board decks, headcount savings are presented as aggregated run-rate dollar figures and FTE counts by functional department (e.g., 'SG&A De-layering: 85 FTEs / $12.4M Run-Rate Savings') rather than specific named personnel or job titles. Detailed named rosters remain restricted to clean-teams and the Special Restructuring Committee.
What is a 'liquidation waterfall' and why is it essential in distressed lender presentations?
A liquidation waterfall is a financial schedule that estimates the cash proceeds generated if a company's assets were liquidated under Chapter 7 bankruptcy, and distributes those proceeds strictly according to legal priority (administrative claims, first lien secured debt, second lien debt, unsecured trade claims, and equity). It is essential because it establishes the 'floor' value of creditor recovery. By demonstrating that creditors recover far more through management's consensual turnaround plan than through liquidation, the presentation provides the economic rationale lenders need to grant debt concessions.
How should a Chief Restructuring Officer (CRO) address historical budget misses in the presentation?
Never attempt to minimize or excuse historical budget misses with vague assertions. Address them head-on in the Situation Diagnosis section using a bridge that separates external market headwinds from internal operational failures (e.g., delayed cost-out, unmanaged procurement inflation, aggressive revenue forecasting). Demonstrating complete intellectual honesty about past failures establishes credibility, while presenting new governance mechanisms (Cash Management Office, Stage-Gate PMO, CRO approval thresholds) proves why the new plan will not suffer the same fate.
Can AI presentation tools handle complex financial tables and debt maturity schedules accurately?
Generalist AI tools often struggle with tabular financial alignment, arbitrary rounding, and math hallucinations. However, specialized platforms like XLSlides are specifically designed for corporate finance and consulting workflows. They ingest structured numerical data, enforce strict column alignment, generate native PowerPoint-compatible tables and waterfall charts, and allow finance leaders to verify every formula before presentation to lenders.
How frequently should a turnaround presentation deck be updated during an active restructuring?
During an active out-of-court restructuring or Chapter 11 process, turnaround presentations operate on a dynamic weekly rhythm. The 13-week cash forecast and weekly variance slides must be updated every 7 days (typically every Monday). The operational initiative tracker and milestone gating slides are refreshed bi-weekly or monthly as initiatives progress through stage gates. The core narrative and debt restructuring term sheet remain stable until negotiated milestones are achieved.
Build Defensible, Lender-Ready Turnaround Decks With XLSlides
When solvency and corporate survival are on the line, generic slide generators produce embarrassing bullet points and loose layout cards. XLSlides delivers institutional-grade, editable PowerPoint presentations engineered specifically for Chief Restructuring Officers, corporate treasurers, and turnaround advisors. Transform 13-week cash forecasts, EBITDA recovery bridges, operational cost-out scorecards, and creditor recovery waterfalls into executive-ready presentations in minutes.
Build Turnaround Decks with XLSlidesMethodology And Sources
- Turnaround Management Association (TMA): Corporate Turnaround Standards & Body of Knowledge
- American Bankruptcy Institute (ABI): Commission to Study the Reform of Chapter 11 Final Report & Recommendations
- Alvarez & Marsal (A&M): Global Restructuring Advisory & Turnaround Performance Benchmarks
- AlixPartners: Annual Global Restructuring & Turnaround Outlook
- Harvard Business Review: The Crucial Turnaround - Navigating Corporate Distress and Liquidity Preservation