Executive Direct Answer: The Anatomy of an Institutional Treasury Presentation
An institutional treasury and liquidity management presentation is a specialized corporate governance deliverable that bridges raw bank cash balances, treasury management system (TMS) transaction feeds, debt amortization schedules, and commercial contract covenants into an executive-ready decision document for Chief Financial Officers, Board Audit & Finance Committees, rating agencies, and syndicated lender consortia. Unlike standard FP&A operating reviews that focus primarily on accrual-based revenue growth, gross margins, and budgeted operating expenses, a treasury presentation focuses on enterprise solvency, unencumbered cash runway, contractual debt covenants, counterparty banking risks, and interest rate volatility.
In modern corporate finance, cash is not an accounting metric; it is an unforgiving operational reality. A company can survive several consecutive quarters of accounting losses, but it will face immediate technical default or insolvency the moment it breaches a contractual credit facility covenant, exhausts its revolving credit line, or fails to settle an institutional debt obligation upon maturity. Consequently, presentations prepared for treasury committees and bank syndicates must maintain an exacting level of analytical precision that standard slide generation tools simply cannot deliver.
Generic AI presentation software and traditional marketing templates fail catastrophically in treasury environments. They produce decorative layout cards, cartoonish vector icons, qualitative bullet points, and vague summaries that destroy executive credibility. A Board Finance Committee evaluating a $500M senior credit facility renewal does not want an abstract summary of macroeconomic uncertainty; they require an exact 13-week rolling cash flow bridge (TWCF) disaggregated by operating receipts, vendor disbursements, and mandatory debt service, accompanied by a multi-year debt maturity ladder, an analysis of fixed versus floating debt exposures, and multi-scenario covenant headroom stress tests.
An executive-grade treasury deck is structured around five core governance pillars: (1) Enterprise Net Available Liquidity and Global Cash Positioning, (2) The 13-Week Rolling Cash Flow Forecast and Variance Attribution, (3) Committed Credit Facility Headroom and Syndicate Allocation, (4) Multi-Year Debt Maturity Profiles and Refinancing Strategy, and (5) Financial Covenant Sensitivity under Downside Macroeconomic Stress. Every slide must feature an upfront action title stating the definitive takeaway, clear visual data hierarchies, and explicit source notes detailing data extraction timestamps and underlying banking facilities.
Four Non-Negotiable Tenets of Board-Level Liquidity Governance
- Anchor Every Liquidity Slide on Net Available Cash and Undrawn Facility Headroom: Gross cash balances create a false sense of security; executive decks must immediately subtract trapped foreign subsidiary cash, restricted escrow balances, and upcoming debt service to present the true, unencumbered liquidity buffer.
- Enforce Strict Variance Attribution Between Timing Shifts and Structural Cash Leaks: Board members and lenders scrutinize weekly forecast discrepancies; slides must cleanly disaggregate seasonal collections timing from permanent operating margin deterioration or unbudgeted CapEx overruns.
- Proactively Manage Refinancing Walls at Least 18 to 24 Months in Advance: Credit markets penalize companies that address debt maturities inside of 12 months; treasury decks must showcase multi-year debt ladders with clear refinancing triggers, tenor extensions, and syndicate diversification.
- Pre-Empt Covenant Breaches Through Multi-Scenario Downside Stress Modeling: A single baseline forecast is unacceptable to credit committees; presentations must model fixed charge coverage and net leverage ratios under conservative revenue downturns, interest rate shocks (+150 bps), and working capital elongations.
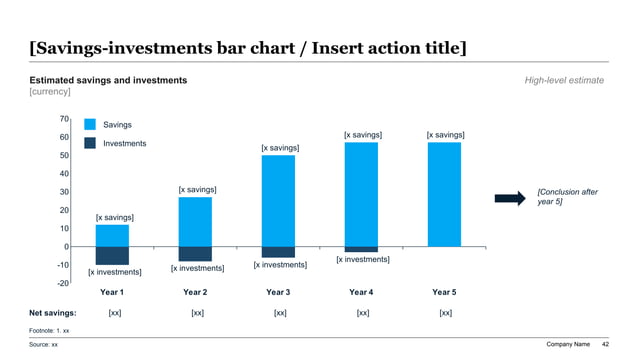
Exhibit 1: Net Liquidity Bridge & 13-Week Rolling Cash Flow Variance
The Five Core Pillars of Enterprise Treasury & Liquidity Architecture
An institutional treasury presentation organizes corporate solvency into five interconnected analytical layers. Each layer addresses a distinct time horizon and governance audience, ensuring seamless alignment between daily cash operations and long-term capital structure strategy.
| Governance Layer | Primary Operational Metric | Executive Slide Objective | Key Risk Disclosures | Target Audience / Committee |
|---|---|---|---|---|
| Daily Cash Positioning & Pooling | Global Net Available Cash & Swept Balances | Display physical vs. virtual cash concentration across legal entities, currencies, and pooling accounts. | Trapped foreign cash, FX convertibility limits, and banking counterparty risk. | Treasury Committee & Corporate Controller |
| 13-Week Rolling Cash Flow (TWCF) | Weekly Net Cash Flow & Variance to Prior Forecast | Provide operational cash visibility to ensure ongoing working capital solvency and payroll certainty. | Collections timing slippage, unexpected vendor prepayments, and seasonal inventory builds. | CFO, CEO & Board Audit Committee |
| Credit Facility Headroom & Revolvers | Available Borrowing Base & Undrawn Capacity | Prove facility adequacy under peak drawdown months after accounting for outstanding Letters of Credit (LCs). | Borrowing base eligibility haircuts, bank syndicate exposure limits, and commitment fees. | Lender Syndicate & Board Finance Committee |
| Capital Structure & Debt Maturity | Weighted Average Tenor, Cost of Debt & Refinancing Walls | Present multi-year debt maturity schedules and interest rate risk profiles (fixed vs. floating mix). | Refinancing cliff risks in high-rate environments, rating agency downgrade triggers, and call premiums. | Board of Directors, Rating Agencies & Bondholders |
| Covenant Sensitivity & Headroom | Net Debt / EBITDA & Fixed Charge Coverage Ratio (FCCR) | Demonstrate headroom cushions against contractual financial covenants across base and downside stress cases. | EBITDA adjustments disallowance, rising SOFR/Euribor benchmarks, and minimum liquidity covenants. | Syndicate Agent Banks & Credit Risk Committees |
Building the 13-Week Rolling Cash Flow Forecast (TWCF) Deck
The 13-week rolling cash flow model (TWCF) is universally recognized by corporate treasurers, restructuring advisors, and private equity sponsors as the gold standard for near-term liquidity governance. While traditional financial models rely on indirect cash flow statements derived from projected balance sheets and income statements, the 13-week model operates purely on a direct cash receipts and disbursements basis. It answers the most pressing operational question in business: exactly how many dollars will flow into and out of company bank accounts each week over the next quarter?
Presenting the 13-week model to executive leadership requires striking a delicate balance between granular transaction accuracy and executive-level synthesis. A common mistake among junior finance analysts is embedding massive 200-row Excel schedules directly onto a PowerPoint slide. This overwhelms board members with illegible rows of operational trivia while obscuring the macro liquidity trajectory. An effective presentation distills the 13-week model into a structured visual waterfall accompanied by an explicit variance attribution bridge.
The foundation of the 13-week deck is the Disaggregated Cash Flow Bridge shown in Exhibit 1. This exhibit separates total cash inflows into core customer accounts receivable collections, non-operating asset receipts, and intercompany transfers, while breaking down cash outflows into critical payroll and employee benefits, critical operational trade payables, discretionary vendor expenses, scheduled debt principal and interest payments, tax liabilities, and approved capital expenditures. By isolating non-discretionary payments from flexible operational expenses, the treasurer demonstrates exactly which cash levers can be paused or throttled if collections experience sudden exogenous delays.
A critical element of the 13-week presentation is the Weekly Variance Attribution Analysis. Every week, the treasury team rolls the forecast forward by one week, adds a new week at the end of the horizon, and rigorously reconciles actual cash performance against the prior week's projection. On the executive slide, variances must never be lumped together into a generic 'timing discrepancy' bucket. Instead, the deck must disaggregate variances into two distinct categories: (1) Temporary Timing Shifts (such as a large enterprise client whose $12M wire cleared on Monday morning of Week 3 instead of Friday afternoon of Week 2), and (2) Permanent Structural Variances (such as unbudgeted legal fees, structural raw material inflation, or an uncollectible bad debt write-off). Disclosing permanent cash burn immediately builds executive trust and enables leadership to take corrective pricing or cost-containment actions weeks before liquidity cushions are breached.
Finally, the 13-week deck must establish and visualize the enterprise Minimum Liquidity Threshold (the 'Liquidity Floor'). This buffer represents the minimum operational cash required to fund ongoing bank float, satisfy multi-currency subsidiary requirements, and absorb intraday settlement mismatches without initiating expensive emergency borrowings. When the rolling forecast dips toward this floor, the slide must trigger a pre-planned governance protocol, outlining immediate liquidity conservation measures such as delaying non-essential CapEx, drawing down on committed revolver lines, or accelerating invoice factoring.
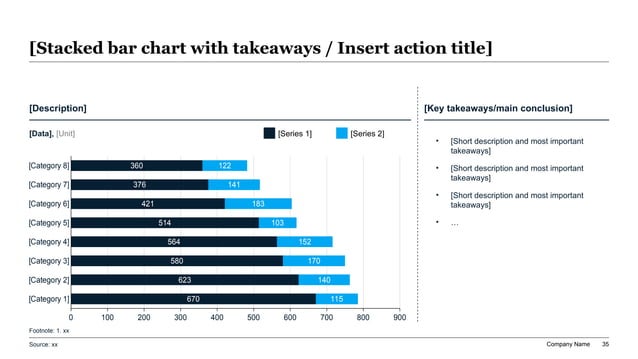
Exhibit 2: Multi-Year Debt Maturity Ladder & Capital Structure Profile
10-Point 13-Week Rolling Cash Flow Audit Checklist for Finance Leaders
Capital Structure Strategy: De-Risking the Debt Maturity Wall
While the 13-week cash flow model governs short-term operational solvency, the debt capital structure and maturity profile govern the long-term viability and financial independence of the enterprise. For Chief Financial Officers and Treasurers, presenting the capital structure to the Board of Directors, institutional bondholders, and credit rating agencies is an exercise in demonstrating proactive risk management, optimized capital costs, and absolute freedom from liquidity refinancing traps.
The central exhibit of any capital structure presentation is the Multi-Year Debt Maturity Ladder, illustrated in Exhibit 2. This exhibit maps all outstanding contractual obligations across a 5-to-10-year horizon, broken down by individual credit tranches: Asset-Based Revolvers, Term Loan A facilities, institutional Term Loan B tranches, Senior Unsecured Notes, Subordinated Mezzanine Notes, and Capital Leases. The objective of the slide is to demonstrate that debt maturities are smoothly staggered over time, preventing dangerous 'maturity walls'—periods where an overwhelming volume of debt matures simultaneously in a potentially hostile interest rate or credit market environment.
Best-in-class corporate treasury policy dictates that no major debt facility should ever be allowed to enter the 12-month window prior to maturity without an executed refinancing or an ironclad extension agreement. Once a debt maturity falls within 12 months, accounting standards typically reclassify that obligation from long-term liabilities to current liabilities on the balance sheet, severely depressing working capital metrics and triggering heightened scrutiny from credit rating agencies, bank syndicates, and trade credit insurers. In the boardroom, the treasurer must present a clear refinancing runway starting at least 18 to 24 months before maturity, outlining market issuance windows, potential bank syndicate appetite, and secondary market trading levels of existing company debt.
Equally vital is presenting the company's Interest Rate Risk and Hedging Portfolio. In an era of volatile benchmark interest rates (SOFR, Euribor, SONIA), an unhedged floating-rate debt portfolio exposes corporate operating earnings to severe margin compression. Treasury slides must clearly disclose the blended Weighted Average Cost of Debt (WACD), the proportion of fixed versus floating debt (typically targeted at 60-80% fixed for mature corporate borrowers), and the exact performance of interest rate swaps, caps, and collars. Presenting a sensitivity table showing the net pre-tax cash flow impact of a +100 bps, +200 bps, or -100 bps shift in benchmark rates reassures board members that the company's earnings and interest coverage ratios are comprehensively insulated against monetary policy tightening.
Corporate Debt Capital Structure Instruments: Seniority, Cost, and Covenants
A comprehensive debt structure presentation must clearly articulate the trade-offs between cost of capital, operational flexibility, security pledges, and restrictive covenant burdens across competing debt instruments.
| Debt Instrument | Typical Tenor | Pricing & Benchmark | Security & Seniority | Financial Covenants | Treasury Strategic Purpose |
|---|---|---|---|---|---|
| Asset-Based Lending (ABL) Revolver | 3 to 5 Years | SOFR + 125 to 225 bps | First lien on current assets (Accounts Receivable, Inventory) | Fixed Charge Coverage (tested on springing liquidity triggers) | Primary operational working capital engine and seasonal cash buffer. |
| Revolving Credit Facility (RCF) | 3 to 5 Years | SOFR + 150 to 250 bps | First lien on all corporate assets or senior unsecured | Max Net Leverage & Min Interest Coverage (quarterly maintenance) | Corporate liquidity backstop, letter of credit issuance, and acquisition bridge. |
| Term Loan A (TLA) - Bank Market | 5 Years | SOFR + 175 to 275 bps | First lien pari passu with revolving credit facility | Quarterly amortizing principal; maintenance financial covenants | Core institutional bank financing with predictable annual balance sheet de-leveraging. |
| Term Loan B (TLB) - Institutional | 7 Years | SOFR + 300 to 450 bps | First lien pari passu; 1% annual nominal amortization | Incurrence covenants only (covenant-lite structure) | Long-duration flexible capital for sponsor buyouts, major M&A, and recapitalizations. |
| Senior Unsecured Notes | 7 to 10 Years | Fixed coupon (5.5% to 8.5%) | Senior unsecured ranking pari passu with general commercial claims | Incurrence covenants (debt incurrence, liens, restricted payments) | Long-term fixed-rate liquidity with zero interim amortization until bullet maturity. |
| Subordinated Mezzanine Debt | 5 to 8 Years | Fixed cash + PIK (11% to 15% all-in) | Subordinated second lien or deeply subordinated unsecured | Subordinated incurrence covenants and equity co-investment warrants | High-cost non-dilutive bridge capital for growth expansion without immediate equity dilution. |
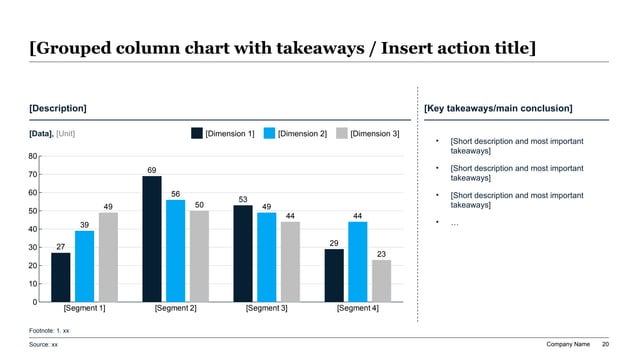
Exhibit 3: Committed Credit Facility Headroom & Available Liquidity Buffer
Bank Syndicate & Rating Agency Review Deck Preparation Checklist
Credit Facility Headroom, Borrowing Base & Bank Syndicate Management
For mid-market corporations, private equity-backed enterprises, and multinational organizations alike, the committed Revolving Credit Facility (RCF) or Asset-Based Lending (ABL) facility represents the primary liquidity backstop standing between business operations and unexpected cash disruptions. However, one of the most persistent and dangerous errors made in executive slide decks is treating the total headline commitment of a credit facility as immediately available cash.
In practical corporate finance, borrowing capacity is frequently constrained by two powerful contractual mechanisms: (1) The Borrowing Base Formula, and (2) Outstanding Letters of Credit (LCs) and Ancillary Carve-outs. In an ABL structure, the maximum amount the company can borrow is strictly limited by the value of eligible accounts receivable and qualifying finished goods inventory, less reserve haircuts for dilution, aging, and customer concentration caps. If a company has a $200M facility but its calculated borrowing base is only $140M, and it has $15M in outstanding performance letters of credit issued to international suppliers, its true maximum borrowing capacity is $125M—not $200M. Misrepresenting headline commitments as liquid cash in a board presentation is a catastrophic governance failure that can lead to unexpected liquidity crunches.
Exhibit 3 demonstrates the institutional presentation standard for credit facility headroom. The grouped column visual displays total committed facilities, current cash borrowings, letter of credit commitments, and net undrawn borrowing capacity across each banking partner in the syndicate. This slide provides executive leadership and board members with immediate visibility into facility utilization rates, ensuring that the company maintains an adequate liquidity cushion throughout peak seasonal working capital cycles.
Furthermore, the presentation must serve as an executive relationship dashboard for managing the Bank Syndicate. Large credit facilities are rarely held by a single commercial bank; they are syndicated across a consortium of 5 to 20 institutions led by Lead Arrangers and Administrative Agents. In annual syndicate presentations, the treasurer must present an objective overview of the company's financial trajectory while demonstrating equitable distribution of ancillary banking business (such as treasury management fees, foreign exchange hedging flow, debt capital markets underwriting, and merchant card processing). Syndicate banks allocate low-margin credit commitments largely to win lucrative ancillary fee business; showcasing a balanced distribution of corporate wallet share cements long-term banking loyalty and ensures enthusiastic support when the company requests credit facility up-sizings, covenant waivers, or tenor extensions.
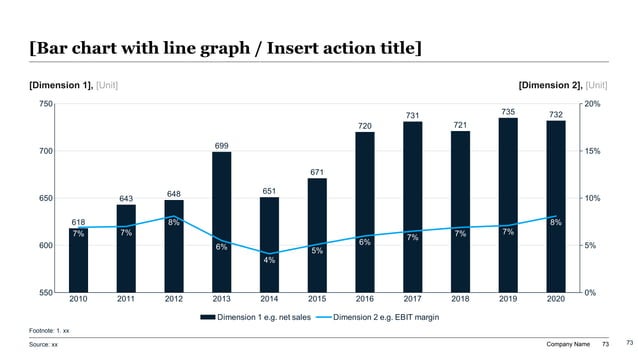
Exhibit 4: Financial Covenant Headroom & Downside Sensitivity Stress Test
Prompt Recipe: 10-Slide Institutional Treasury & Liquidity Review Deck
Act as an elite Corporate Treasurer and Senior Corporate Finance Director. Generate an institutional, 10-slide Treasury & Liquidity Management Presentation in PowerPoint format for the Chief Financial Officer and Board Audit & Finance Committee. Use a crisp, executive corporate palette (deep navy #0A192F, slate grey #4A5568, and bright accent blue #0066CC). Every slide must feature an upfront action title stating the core financial conclusion, concise body text with bullet points, structured financial tables, and explicit source notes detailing underlying bank facilities and ERP data timestamps. Slide Structure: Slide 1: Executive Title Slide - 'Enterprise Treasury & Liquidity Review: 13-Week Cash Runway, Debt Maturity Optimization, and Covenant Stress-Testing'. Include company name, date, and confidentiality notices. Slide 2: Executive Solvency Dashboard - Total Net Available Liquidity ($X million unencumbered cash + $Y million undrawn revolver), 13-week low point, weighted average debt cost, and key committee action items. Slide 3: Global Cash Positioning & Concentration - Consolidated cash balances across operating entities, multi-currency pooling efficiency, and explicit disclosures of restricted foreign cash. Slide 4: 13-Week Rolling Cash Flow Bridge (TWCF) - Weekly waterfall visual comparing projected operational customer receipts against payroll, vendor AP, debt service, CapEx, and net weekly cash balances against the minimum liquidity floor. Slide 5: Forecast Accuracy & Variance Attribution - Quantitative reconciliation of prior 4-week projections against actual bank cash flows, disaggregating timing variances from permanent margin leaks. Slide 6: Multi-Year Debt Maturity Ladder - Stacked bar visual mapping debt obligations (ABL, Term Loans, High-Yield Notes) across 2026-2032, highlighting refinancing timelines 18 months in advance. Slide 7: Interest Rate Risk & Hedging Portfolio - Fixed vs. floating debt mix (target 75% fixed), active interest rate swaps, mark-to-market valuations, and net P&L sensitivity to +/- 100 bps rate shifts. Slide 8: Credit Facility Headroom & Syndicate Allocation - Committed facility sizes, borrowing base eligibility, outstanding letters of credit, and wallet-share allocation across syndicate lenders. Slide 9: Financial Covenant Headroom & Downside Sensitivity - Dual-axis chart mapping Net Debt/EBITDA and Fixed Charge Coverage ratios against contractual credit agreement limits under Baseline, Mild Downturn, and Severe Shock scenarios. Slide 10: Working Capital Optimization & Cash Action Plan - 90-day operational priorities across DSO, DIO, and DPO to liberate trapped balance sheet cash, complete with functional owners and dollar milestones.
Macroeconomic Downside Stress-Testing Scenarios for Treasury Solvency
A single financial baseline is unacceptable to credit committees. Best-in-class treasury decks pressure-test enterprise cash runway, leverage covenants, and liquidity headroom across four progressively severe operating scenarios.
| Operating Scenario | Revenue & Margin Shock | Projected Adjusted EBITDA | Peak Net Debt / EBITDA | Min Interest Coverage | 13-Week Cash Low Point | Treasury & Operational Countermeasures |
|---|---|---|---|---|---|---|
| Baseline Budget (AOP) | Planned operating budget; +6.5% YoY revenue growth, stable margins. | $145.0M | 2.85x (Covenant: 4.25x) | 4.80x (Covenant: 3.00x) | $68.5M above floor | Standard capital allocation: fund growth CapEx, maintain regular dividends, normal debt paydown. |
| Moderate Stagflation Shock | -5.0% revenue volume contraction; +150 bps interest rates; +4% wage inflation. | $118.0M | 3.48x (Headroom: 0.77x) | 3.65x (Headroom: 0.65x) | $42.0M above floor | Pause uncommitted discretionary growth CapEx ($15M); freeze executive hiring; optimize working capital. |
| Severe Global Recession (-15%) | -15.0% revenue collapse; enterprise customer payment delays (+18 days DSO); inventory write-downs. | $82.0M | 4.15x (Headroom: 0.10x) | 3.10x (Headroom: 0.10x) | $18.5M above floor | Draw $50M precautionary revolver liquidity; initiate emergency supplier payment term negotiations; halt share repurchases. |
| Catastrophic Liquidity Shock | -25.0% top-line contraction; key customer default ($20M bad debt); credit rating downgrade (+250 bps margin). | $54.0M | 4.95x (Breach: -0.70x) | 2.45x (Breach: -0.55x) | $4.2M below floor | Engage syndicate steering committee for temporary covenant waiver; execute sale-leaseback of corporate real estate; implement restructuring. |
Covenant Compliance Headroom & Downside Liquidity Stress Testing
Financial covenants are the contractual tripwires embedded in corporate credit agreements, designed by lenders to enforce financial discipline and trigger early intervention before a borrower reaches insolvency. In a credit agreement, financial covenants typically fall into two categories: (1) Maintenance Covenants, which require the borrower to maintain compliance with specific financial ratios (such as Maximum Net Leverage or Minimum Fixed Charge Coverage) at the end of every fiscal quarter, and (2) Incurrence Covenants, which restrict the borrower from taking specific actions (such as issuing additional debt, paying shareholder dividends, or making major acquisitions) unless specific pro-forma ratio hurdles are met.
Presenting covenant compliance to executive leadership and the Board Audit Committee requires absolute transparency regarding contractual headroom. Headroom is defined as the mathematical cushion between current projected performance and the contractual covenant breach threshold. On a slide, treasurers must never simply state: 'The company is in compliance with all covenants.' Such binary statements conceal emerging risks. Instead, the deck must present the exact covenant calculation formula defined in the credit agreement, the current ratio, the contractual ceiling or floor, and the implied dollar cushion.
Critically, the presentation must illustrate the 'EBITDA Cushion'—the exact dollar amount by which Adjusted EBITDA could decline before triggering a covenant default. For example, if a company has $300M in Net Debt and a Maximum Net Leverage covenant of 3.50x, the company requires a minimum EBITDA of $85.7M ($300M / 3.50x). If current projected EBITDA is $100M, the company has an EBITDA cushion of $14.3M, or 14.3%. Displaying this sensitivity metric allows board members to instantly assess whether an impending operational downturn or customer contract loss poses an existential threat to credit agreement compliance.
Exhibit 4 highlights the institutional visualization standard for covenant sensitivity. By mapping Net Debt / EBITDA leverage bars alongside Interest Coverage trendlines across multiple macro scenarios, the treasurer provides visual proof that the enterprise can absorb substantial earnings shocks without triggering a default. When presenting downside scenarios (such as the Severe Global Recession scenario in our stress-testing table), the slide must outline specific, actionable management countermeasures. These countermeasures—including pausing uncommitted discretionary CapEx, implementing immediate SG&A hiring freezes, and initiating sale-leaseback transactions—demonstrate to lenders and board members that corporate management possesses a well-rehearsed liquidity defense playbook.
Exhibit 5: Working Capital Optimization: DSO, DIO, and DPO Cash Conversion Velocity
Working Capital Optimization: Unlocking Balance Sheet Liquidity
In high-interest-rate environments where the marginal cost of debt exceeds 6% to 9%, borrowing funds to support everyday operations is an expensive and inefficient corporate strategy. The most cost-effective, non-dilutive source of liquidity available to any enterprise is the cash already trapped within its own balance sheet: working capital. Working capital optimization is the systematic operational discipline of accelerating customer receivables collections, streamlining inventory turnover, and standardizing supplier payment terms to compress the Cash Conversion Cycle (CCC = DSO + DIO - DPO).
Presenting working capital performance in a treasury deck requires moving beyond aggregate balance sheet balances to isolate velocity metrics. In Exhibit 5, the treasury team deploys a 3-column comparative trend visual tracking the three core operational levers: Days Sales Outstanding (DSO), Days Inventory Outstanding (DIO), and Days Payables Outstanding (DPO). Each metric should be accompanied by an explicit dollar conversion calculation showing exactly how many millions of dollars are liberated or absorbed by a one-day shift in velocity.
For Accounts Receivable (DSO), the slide must examine collection efficiency, billing dispute resolution times, and credit term compliance. If the company's average DSO increases from 48 days to 54 days on an annualized revenue base of $600M, the company has effectively trapped $9.86M of liquid cash in customer receivables ($600M / 365 days * 6 days). Treasury slides must articulate cross-functional initiatives to recapture this liquidity, such as automated invoicing workflows, rigorous dispute-resolution escalation paths, and tiered dynamic discounting programs for early payment.
For Inventory (DIO), the presentation highlights collaboration between corporate treasury, supply chain, and manufacturing operations. By analyzing raw materials, work-in-progress (WIP), and finished goods safety stocks, the deck identifies excess inventory buffers accumulated during supply chain disruptions. Compressing DIO by 8 days through vendor-managed inventory (VMI) agreements and SKU rationalization directly liberates millions in trapped cash while reducing warehousing overhead and obsolescence write-downs.
Finally, for Accounts Payable (DPO), the deck articulates the company's procurement payment policy. Extending standard supplier payment terms from Net 30 to Net 60 or Net 90 days aligns cash disbursements with customer receipt timelines, preserving valuable operational float. However, the slide must address the delicate balance between liquidity preservation and supplier relationship health, ensuring that critical Tier-1 component suppliers are supported via supply chain financing programs rather than unilateral payment withholding.
Frequently Asked Questions About Treasury & Liquidity Management Presentations
What is the difference between a corporate treasury presentation and an FP&A operating review?
While an FP&A operating review focuses primarily on accrual accounting metrics (P&L revenue recognition, gross margin percentages, EBITDA variances, and divisional budget performance), a corporate treasury presentation focuses strictly on cash solvency, liquidity buffers, and contractual capital structure obligations. Treasury presentations examine actual bank account balances, 13-week direct cash receipts and disbursements, credit facility borrowing base availability, debt maturity schedules, interest rate hedging performance, and contractual debt covenant headroom.
Why do corporate boards, rating agencies, and banks insist on a 13-week cash forecast rather than monthly forecasts?
Monthly and quarterly forecasts rely on indirect accounting approximations that smooth over intra-month cash volatility. A company may appear comfortably solvent on an end-of-month balance sheet projection while experiencing severe cash deficits during the middle of the month when payroll, debt service, and vendor disbursement cycles peak before customer receivables clear. A 13-week rolling model operates on a direct, weekly cash receipts and disbursements basis, providing granular visibility into weekly cash troughs and ensuring solvency throughout the operating quarter.
How is 'Net Available Liquidity' calculated in an institutional treasury slide deck?
Net Available Liquidity is calculated by taking total consolidated cash and cash equivalents, subtracting restricted cash (such as debt service reserve escrows, collateralized bank deposits, and trapped cash in foreign subsidiaries facing repatriation taxes or currency controls), and adding total committed, unencumbered revolving credit facility capacity (limited by current borrowing base calculations and reduced by outstanding Letters of Credit). This provides the true, spendable liquidity buffer available to the enterprise.
How should corporate treasurers present interest rate risk and hedging portfolios to the board?
Treasury presentations should clearly disclose the portfolio's fixed versus floating debt mix (typically targeting 60% to 80% fixed debt for investment-grade and mature corporate borrowers), the blended Weighted Average Cost of Debt (WACD), and the notional value and maturity of all active derivative instruments (interest rate swaps, caps, and collars). The deck should include a sensitivity matrix illustrating the net annual pre-tax cash flow impact of a +/- 100 bps, 150 bps, and 200 bps shift in benchmark rates (such as SOFR or Euribor).
What are the most common mistakes finance teams make when presenting debt maturity ladders?
The three most critical mistakes are: (1) Waiting until debt is within 12 months of maturity before presenting refinancing options (debt entering the 12-month window is reclassified as current liabilities, depressing working capital and triggering credit rating downgrades), (2) Failing to segment tranches by seniority and security type (mixing first-lien bank facilities with subordinated notes creates confusion regarding creditor rights), and (3) Neglecting to display contractual call dates, make-whole provisions, and step-up coupon penalties.
How should a treasury team present covenant headroom when Adjusted EBITDA includes substantial pro-forma add-backs?
When Adjusted EBITDA includes substantial pro-forma adjustments (such as restructuring charges, unrealized M&A synergies, or non-recurring legal expenses), the presentation must clearly separate reported unadjusted EBITDA from contractual Credit Agreement EBITDA. Lenders and credit committees scrutinize add-backs rigorously; slides should include a detailed footnote bridge reconciling reported numbers to bank definitions, citing the exact clauses in the credit agreement permitting each specific add-back.
How does XLSlides automate the generation of executive treasury presentations from financial models?
XLSlides bridges complex Excel financial models, ERP databases (SAP, Oracle, NetSuite), and treasury management systems (Kyriba, GTreasury) directly into executive PowerPoint slides. Rather than spending hours manually copying numbers, adjusting column alignments, and re-formatting charts, finance leaders can upload financial tables and prompt XLSlides to generate MECE-structured, action-titled presentation slides complete with clean financial waterfalls, maturity ladders, and board-level styling.
Recommended XLSlides Financial & Executive Presentation Resources
Automating the Treasury Slide Workflow: From ERP Data to Board-Ready PowerPoint
For corporate treasurers and finance directors, the preparation of board and committee presentations has historically been one of the most grueling, error-prone tasks in the financial calendar. Treasury teams frequently spend entire weekends manually extracting cash balances from dozens of international bank portals, consolidating Excel spreadsheets, updating 13-week rolling forecast formulas, and re-drawing PowerPoint shapes, charts, and table borders.
This manual slide-building workflow introduces severe operational risks. A single manual transcription error—such as misplacing a decimal point in a foreign exchange rate, confusing gross cash with net available cash, or miscalculating covenant headroom—can permanently undermine executive credibility during a high-stakes board meeting or lender syndicate negotiation. Furthermore, when last-minute bank cash settlements occur on the morning of a presentation, updating manual slides under intense time pressure inevitably leads to broken table formatting, outdated chart callouts, and contradictory numbers across slides.
Modern corporate finance workflows demand a fully automated presentation layer. By pairing institutional financial modeling with AI-driven presentation platforms like XLSlides, treasury teams can transform structured ERP and TMS data exports directly into executive PowerPoint slides in minutes. XLSlides enforces strict visual discipline: action titles that communicate the core financial message upfront, structured comparison matrices, MECE categories, clear footnote citations, and zero decorative AI fluff.
Rather than wasting valuable analytical hours manipulating slide alignment and drawing maturity bar charts, treasury leaders can focus their intellectual energy where it matters most: interpreting financial risks, pressure-testing downside macro scenarios, negotiating favorable bank syndicate terms, and presenting strategic capital allocation recommendations that safeguard enterprise solvency.
Build Board-Ready Treasury & Liquidity Decks With XLSlides
Transform 13-week cash forecasts, debt maturity schedules, covenant sensitivity models, and syndicate credit headroom data into executive-ready, editable PowerPoint presentations in minutes. XLSlides automates MECE structuring, action titles, and financial tables so your treasury presentations withstand the toughest board and lender scrutiny.