Fast Answer: What A Board-Level Capital Allocation Deck Must Establish
A board-level capital allocation presentation is not a routine budgeting review or a re-skinned financial forecast. It is the definitive governance document where executive leadership demonstrates how every dollar of corporate cash flow and balance sheet capacity will be partitioned across competing operational priorities to maximize long-term intrinsic value per share. The core mandate of the presentation is to reconcile top-down balance sheet constraints with bottom-up investment proposals, establishing a transparent hurdle rate architecture that separates high-conviction growth initiatives from value-destroying empire building.
To hold up under intense board scrutiny, a capital allocation deck must resolve four fundamental questions in the first three minutes: First, what is the total size of the multi-year capital envelope, anchored in cumulative operating cash generation, debt capacity, and non-negotiable liquidity reserves? Second, what is the empirical return on invested capital (ROIC) versus weighted average cost of capital (WACC) spread across each operating business unit? Third, what is the explicit ranking mechanism used to prioritize organic capital expenditures (maintenance versus growth) against M&A opportunities, debt retirement, and shareholder distributions? Fourth, what downside stress-testing protocols protect corporate solvency if macroeconomic headwinds compress cash flows by 20% to 30%?
Presenters who treat capital allocation as a political compromise between division heads inevitably lose board confidence. High-performing CFOs frame the discussion around objective economic value creation (EVA), clear stage-gate milestone releases, and disciplined post-investment audits. In modern corporate boardrooms, capital is treated as a scarce asset that must earn its right to be reinvested, backed by verifiable unit economics and defensive balance sheet architecture.
The Five Strategic Levers Of Corporate Capital Deployment
Every corporate dollar flows into one of five competing buckets. A rigorous capital allocation deck explicitly compares the risk-adjusted return, capital reversibility, and governance burden of each.
| Capital Lever | Primary Strategic Objective | Benchmark Return Metric | Reversibility & Risk | Board Governance Standard |
|---|---|---|---|---|
| Organic CapEx (Maintenance vs. Growth) | Sustain base operations, expand production capacity, and build proprietary infrastructure. | ROIC spread over WACC (> 300-500 bps); Internal Rate of Return (IRR) | Irreversible sunk cost; execution & demand ramp risk | Mandatory baseline for maintenance; phased milestone gating for growth CapEx. |
| Research & Development (R&D) | Develop next-generation product architectures, proprietary intellectual property, and category dominance. | NPV of commercialized pipeline; Gross margin premium | High technical failure risk; slow payback cycles | Portfolio-based stage-gate funding; peer bench burn-rate audit. |
| Mergers & Acquisitions (M&A) | Accelerate market entry, acquire hard-to-build capabilities, or consolidate scale economies. | ROIC > Cost of Equity by Year 3 post-close; Cash EPS accretion | High risk of overpayment; culture & integration friction | Pre-clearance on pipeline, formal Investment Committee memo, integration synergy tracking. |
| Debt Retirement & Capital Structure | Deleverage balance sheet, optimize credit ratings, and lower weighted average cost of capital. | Net Debt / EBITDA ratio; Interest Coverage (EBITDA / Interest > 4.0x) | Fully irreversible; directly reduces financial distress risk | Strict covenant adherence; target leverage corridor approved by Finance Committee. |
| Shareholder Distributions (Dividends & Buybacks) | Return surplus cash to owners when internal reinvestment opportunities yield sub-WACC returns. | Total Shareholder Return (TSR); Implied IRR of buyback vs. intrinsic value | Dividends create rigid expectations; buybacks are flexible but risk buying at cyclical peaks | Clear distribution policy formula; intrinsic valuation hurdle for buyback execution. |
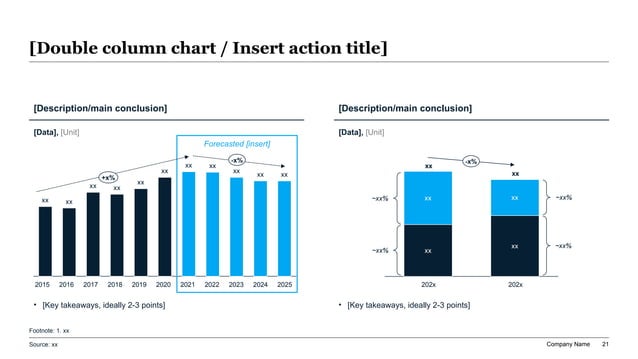
Exhibit 1: The Total Capital Envelope & Multi-Year Allocation Mix
Non-Negotiable Executive Principles For Defensible Capital Allocation
- Anchor every project in ROIC spread over WACC: Reinvestment creates shareholder value only when returns on invested capital clear the firm's true opportunity cost of capital with a defensible safety margin.
- Separate maintenance capital from growth capital: Failing to isolate maintenance CapEx artificially inflates reported free cash flow and masks underlying asset depletion.
- Establish an explicit capital envelope before debating individual projects: Without a top-down constraint on balance sheet capacity and liquidity cushions, business unit bids turn into an uncoordinated beauty contest.
- Treat share buybacks as an investment with an implied return, not an afterthought: Repurchasing shares creates value only when the company trades at a meaningful discount to intrinsic business value, not to prop up near-term EPS.
- Implement formal post-investment audit mechanisms: Business units must know that realized cash flows, timelines, and margins will be systematically compared against original approval projections.
Establishing The Capital Envelope: Sources, Debt Capacity, And Liquidity Cushions
Before a CFO can evaluate whether Division A deserves $50 million for a factory expansion or Division B deserves $30 million for cloud architecture modernization, executive leadership must establish the aggregate capital envelope. The capital envelope defines the total volume of discretionary capital available over a rolling 3-to-5 year strategic planning horizon. It is determined by three foundational inputs: projected cumulative operating cash flow, sustainable debt financing capacity within target credit rating parameters, and non-core asset disposition proceeds.
A frequent error in capital allocation presentations is treating balance sheet leverage as an afterthought. Leading finance teams establish explicit leverage corridors—such as targeting a Net Debt to EBITDA ratio between 1.5x and 2.2x through the cycle. If current leverage is 1.8x and projected EBITDA growth provides $150 million of incremental borrowing capacity while preserving investment-grade ratings, that debt capacity is folded into the gross capital envelope. Conversely, if upcoming debt maturities or covenant requirements demand rapid deleveraging, debt paydown must be carved out as a mandatory drain on sources before discretionary funding is allocated.
Liquidity cushions must be mathematically defended, not casually asserted. A credible presentation explicitly defines minimum required operating liquidity: payroll reserves, seasonal working capital swings, and emergency contingency buffers. Subtracting these non-discretionary reserves from gross capital sources yields the net investable capital pool. When CFOs present this calculation with clear visual clarity, they immediately neutralize contentious debates with division heads who believe corporate cash reserves represent unallocated money waiting to be claimed.
Furthermore, the capital envelope must incorporate cyclical conservatism. In cyclical industries, base-case cash flow projections should reflect mid-cycle rather than peak-cycle profitability. If management sizes a multi-year CapEx expansion based on peak operating margins, the company faces severe liquidity strain when the economic tide turns, often forcing dilutive emergency equity raises or debt covenant renegotiations.
Prerequisite Data & Financial Models Needed Before Building The Deck
Capital Allocation Deck Architecture: The Exact 10-Slide Board Sequence
A proven, decision-oriented slide sequence used by Fortune 500 CFOs and private equity sponsors to steer finance committee reviews efficiently.
| Slide # | Slide Title & Executive Objective | Primary Visual / Analytical Exhibit | Key Executive Question Answered |
|---|---|---|---|
| Slide 1 | Executive Summary & Capital Mandate | Answer-first decision box with total capital envelope & recommended deployment mix | What specific capital authorization is management seeking and why does it maximize long-term enterprise value? |
| Slide 2 | Macro Backdrop & Capital Structure Health | Multi-year liquidity scorecard, debt maturity profile, and leverage ratio trends | Does the balance sheet have sufficient resilience to support aggressive investment through a macroeconomic downturn? |
| Slide 3 | The 3-Year Capital Sources & Uses Envelope | Waterfall / dual-column chart comparing operating cash flow + debt room vs. capital demands | Where is the money coming from, and how is the total pool partitioned across competing operational priorities? |
| Slide 4 | Business Unit ROIC vs. WACC Performance | Return on Invested Capital spread chart mapped against revenue growth by segment | Which divisions are genuine value creators earning their right to reinvest capital versus value destroyers? |
| Slide 5 | Maintenance vs. Growth CapEx Breakdown | Segmented asset replacement schedule vs. high-conviction growth initiative budgets | Are we protecting core operating assets, and what portion of CapEx is discretionary expansion? |
| Slide 6 | Growth Project Ranking & Hurdle Rate Scorecard | Gating table with project IRRs, NPVs, payback periods, and strategic fit indices | How were competing growth projects scored, and what was left on the cutting room floor under capital rationing? |
| Slide 7 | Inorganic Pipeline & M&A Capacity Allocation | Bolt-on target valuation ranges, balance sheet headroom, and synergy payback horizons | Should capital be diverted to acquisitions, and how do acquisition returns compare to internal expansion? |
| Slide 8 | Shareholder Return Policy: Buybacks vs. Dividends | Intrinsic value vs. current trading multiple, dividend payout ratios, and cash yield bridge | Is management's proposed distribution pace disciplined, tax-efficient, and aligned with undervaluation signals? |
| Slide 9 | Downside Sensitivity & Capital Preservation Triggers | Scenario matrix modeling recessionary cash flow compression and project deferral hierarchy | What projects get paused immediately if EBITDA contracts by 15-25% over the next four quarters? |
| Slide 10 | Governance, Milestone Gating & Post-Audit Schedule | Phased capital release roadmap, stage-gate gates, and audit cadence table | What milestones must project teams hit before subsequent funding tranches are unlocked? |
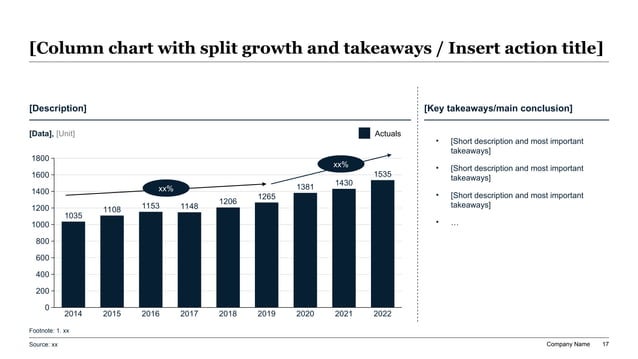
Exhibit 2: Organic Growth vs. Return Spreads Across Business Units
Organic CapEx & R&D Prioritization: The ROIC vs. WACC Economic Hurdle
At the heart of any capital allocation strategy lies a mathematical reality: growth destroys shareholder value if it is funded at returns below the cost of capital. A company expanding revenue at 20% per year while generating a 7% ROIC in an 9% WACC environment is systematically consuming economic wealth. Therefore, a credible presentation must segregate operating business units based on their spread over WACC before approving growth CapEx requests.
Crucially, finance leadership must enforce a strict separation between maintenance CapEx and growth CapEx. Maintenance CapEx reflects the ongoing reinvestment required to replace aging property, plant, equipment, and technological debt to maintain current revenue velocity and competitive parity. In capital-intensive industries, maintenance CapEx frequently exceeds annual accounting depreciation due to cumulative asset replacement inflation. When decks conflate maintenance with growth, board directors are unable to see whether the company is truly expanding or merely running faster to stay in place.
Growth CapEx, by contrast, must clear strict risk-adjusted hurdle rates. While corporate WACC serves as the baseline floor, different growth initiatives carry fundamentally distinct risk profiles. A brownfield capacity expansion in an existing, highly profitable core product line might require an incremental ROIC spread of 300 to 400 basis points over WACC. Conversely, entering a greenfield geographic market or deploying an unproven software architecture requires hurdle rates of 800 to 1,200 basis points above WACC to compensate for execution friction and adoption delays.
To visualize this effectively, the presentation should feature a project ranking waterfall or capital supply-demand curve. By plotting cumulative capital investment on the horizontal axis and projected project IRR on the vertical axis against the corporate hurdle line, the CFO makes capital rationing obvious to all participants. Projects that fall below the cut-off line are either discarded, re-engineered for capital efficiency, or postponed until economic fundamentals improve.
Hurdle Rates & Decision Thresholds By Investment Category
Hurdle rates cannot be a static company-wide WACC. Risk profiles, cash flow predictability, and asset liquidity vary dramatically across project archetypes.
| Investment Category | Typical Project Types | Hurdle Rate Formula | Target Spread Over WACC | Typical Payback Cap |
|---|---|---|---|---|
| Mandatory / Compliance CapEx | Safety upgrades, regulatory compliance, environmental mandates, critical IT patch updates | N/A (Cost-minimization NPV) | Negative (Focus on lowest lifecycle cost) | N/A (Mandatory) |
| Maintenance & Efficiency CapEx | Facility automation, equipment modernization, cost-reduction tooling | After-tax cost of debt + 2.0% | +100 to 200 bps | 2.0 - 3.5 years |
| Core Business Organic Growth | Capacity expansion in existing product lines, geographical replication, proven distribution rollout | Base Corporate WACC + Risk Premium | +300 to 500 bps | 3.0 - 4.5 years |
| New Market / Discretionary R&D | Unproven technology architectures, greenfield market entries, transformative digital platforms | Venture / Private Equity Hurdle (18-22%) | +800 to 1,200 bps | 5.0 - 7.0 years |
| Bolt-on M&A Acquisitions | Synergistic competitor tuck-ins with operational overlap | Target-adjusted WACC + Integration Buffer | +400 to 600 bps | 4.0 - 5.0 years |
| Transformative / Large-Scale M&A | Platform acquisitions, adjacent sector diversification, cross-border mega-deals | Unlevered Cost of Equity + 4.0% Execution Margin | +600 to 800 bps | 5.0 - 6.5 years |
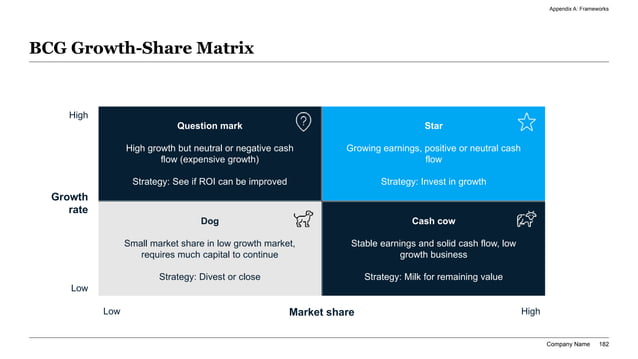
Exhibit 3: Business Portfolio Capital Role Matrix
M&A vs. Organic Investment: Sizing Acquisition Capacity And Synergy Realism
Mergers and acquisitions frequently represent the single largest discretionary use of corporate capital, yet academic literature and corporate track records demonstrate that over 60% of acquisitions destroy economic value. In board presentations, M&A proposals must not be treated as distinct corporate vanity projects; they must compete directly for capital against internal organic expansion, share repurchases, and debt retirement.
A rigorous capital allocation deck benchmarks M&A against the build-versus-buy trade-off. If corporate development proposes acquiring a software company at 6.0x revenue (implying a 15-year cash payback), management must explicitly compare that acquisition against investing $15 million internally to engineer comparable functionality within 18 months. When the financial comparison is laid out side-by-side with identical discount rates, the hidden premium paid for inorganic speed becomes transparent to board members.
Synergy realism is the second critical test. Decks that justify high purchase multiples with aggressive revenue synergy assumptions routinely trigger board skepticism. Best practice dictates modeling transaction economics on a standalone basis first, layering in verifiable cost synergies (e.g., procurement consolidation, redundant corporate overhead, and real estate consolidation) second, and completely excluding unproven cross-selling revenue synergies from the base hurdle calculation.
Finally, the presentation must set an explicit annual M&A capital reservation within the broader capital envelope. Rather than treating acquisitions as episodic, off-balance-sheet surprises that trigger emergency financings, management should allocate a defined programmatic M&A capacity (such as $50M to $100M annually for disciplined tuck-ins) while preserving sufficient debt headroom so that executing an acquisition does not starve core organic business units of essential growth capital.
Board-Level Red Flags That Trigger Finance Committee Rejection
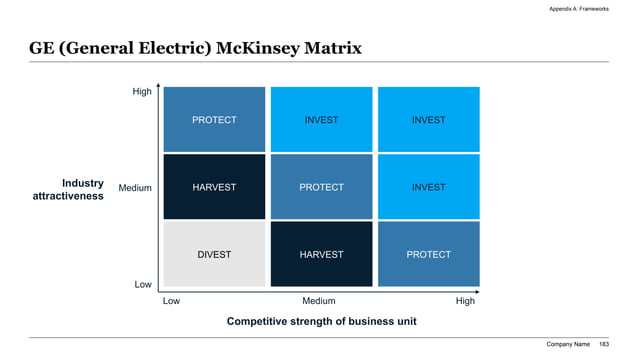
Exhibit 4: Nine-Box Strategic Investment Gating Grid
Executive Prompt Recipe: Drafting A Complete Capital Allocation Deck In XLSlides
Generate a 10-slide executive presentation for a CFO and Board of Directors Finance Committee on Annual Strategic Capital Allocation. Target audience: Board members, CFO, Head of Corporate Strategy, and institutional investor representatives. Tone: Rigorous, quantitative, answer-first, and executive-ready. Slide 1 (Title & Executive Summary): Recommended $350M capital allocation envelope, high-level deployment mix across organic growth, maintenance, bolt-on M&A, and share buybacks, and expected EPS/ROIC impact. Slide 2 (Balance Sheet & Liquidity Baseline): Current Net Debt/EBITDA of 1.8x, available liquidity ($120M cash + $250M undrawn revolver), covenant headroom, and target credit profile. Slide 3 (Sources & Uses Capital Envelope): 3-year cumulative operating cash flow ($450M) + debt capacity ($100M) balancing against maintenance CapEx ($120M), organic growth CapEx ($130M), M&A reserve ($80M), debt paydown ($40M), and dividends/buybacks ($80M). Slide 4 (Segment ROIC vs. WACC Performance): Division-by-division analysis of return on invested capital vs. 8.5% WACC hurdle, identifying value-creating growth engines vs. capital-rationalized units. Slide 5 (Organic Project Prioritization Scorecard): Ranked table of 6 major capital expenditure proposals scored by NPV, IRR, payback period, and strategic alignment, showing clear cut-off line at project #4. Slide 6 (Inorganic Growth & M&A Gating): Allocation of $80M bolt-on acquisition reserve with strict return gates (ROIC > 12% by Year 3 post-close) and integration risk filters. Slide 7 (Shareholder Return Framework): Disciplined distribution policy combining progressive base dividend ($30M/yr) and opportunistic share buybacks triggered only when trading multiple sits below 14.5x EBITDA intrinsic value. Slide 8 (Downside Sensitivity & Capital Rationing Protocol): 3-tier stress-test modeling 10%, 20%, and 30% cash flow contractions, with pre-approved project deferral triggers to defend balance sheet liquidity. Slide 9 (Governance & Tranche Milestone Gating): Stage-gate funding schedule linking CapEx releases to pilot milestones and commercialization hurdles. Slide 10 (Board Decision Asks & Next Steps): Explicit board resolution asks for capital authorizations and schedule for quarterly post-audit reviews.
Exhibit 5: Capital Expenditure Prioritization Scorecard
Executing Post-Approval Governance: Tracking Capital Deployed vs. Projected Returns
The most sophisticated capital allocation model is useless without rigorous post-approval governance. In many corporate environments, business units submit wildly optimistic projections to secure capital approvals, knowing that by the time cash flows materialize three years later, the original sponsors will have transferred to other roles or left the company. To defeat this moral hazard, high-performing boards institute systematic post-investment audits.
A post-investment audit schedule should be formally established in the final slide of the capital allocation deck. For every project exceeding a defined material threshold (e.g., $10 million or 5% of annual CapEx), the corporate finance team conducts formal reviews at the 12-month, 24-month, and 36-month marks. These audits contrast actual cash outflows against budget, milestone completion dates against schedules, and realized operating margins against initial model assumptions.
When post-audits reveal chronic underperformance, management must possess the governance courage to terminate failing initiatives rather than falling victim to the sunk-cost fallacy. Reallocating capital away from stagnant legacy programs and redirecting those resources toward high-performing growth sectors is the defining trait of outstanding corporate stewards. Documenting this discipline in board presentations signals to directors and institutional shareholders that executive management treats corporate capital with owner-level stewardship.
XLSlides Resources For Finance Leadership And Corporate Strategy
Executive FAQs: Capital Allocation Deck Design And Board Objections
What is the biggest mistake CFOs make in capital allocation presentations?
The single biggest mistake is presenting capital allocation as an unconstrained wish-list of bottom-up department proposals without establishing a clear top-down capital envelope first. When finance presentations fail to explicitly bound total capital by cash generation and balance sheet leverage targets, the board meeting degenerates into political debates between business unit leaders rather than a disciplined portfolio optimization exercise.
How should maintenance CapEx be separated from growth CapEx in board slides?
Maintenance CapEx represents the capital expenditures strictly required to maintain current operating capacity, replace depreciated equipment, and preserve competitive parity. Growth CapEx represents discretionary investments designed to expand capacity, enter new markets, or lower structural unit costs. On slide exhibits, maintenance CapEx should be presented as a non-negotiable baseline subtraction from operating cash flow to determine true discretionary free cash flow before any growth projects or shareholder distributions are discussed.
How do boards evaluate whether share buybacks or debt paydown are the better capital deployment choice?
Boards evaluate this trade-off using two primary tests: the balance sheet resilience test and the intrinsic value test. If Net Debt / EBITDA exceeds target leverage corridors (or credit rating boundaries are threatened), debt paydown takes absolute priority. Once leverage is optimized, share buybacks are evaluated like any other capital investment: management must calculate the implied IRR of retiring shares based on conservative intrinsic business value. If the implied return exceeds the firm's cost of equity and internal growth hurdle rates, share repurchases create significant per-share value; if the stock is overvalued, buybacks destroy economic value.
What hurdle rate should be used for risky R&D or new venture investments?
Risky R&D, greenfield ventures, and transformative technology investments should never be evaluated against the company's blended corporate WACC. Doing so systematically underprices technology and commercialization risk. Leading corporate strategists apply venture-style hurdle rates (typically 18% to 25%, representing a 1,000 to 1,500 bps spread over WACC) combined with phased stage-gate milestone releases rather than unlocking full multi-year budgets upfront.
How should capital allocation decks handle macroeconomic uncertainty and recession risks?
A decision-ready capital allocation deck must include an explicit downside stress-test slide. This exhibit models the impact of a 15% to 30% contraction in operating EBITDA on cash flow and covenant headroom, and outlines a pre-approved hierarchy of capital curtailments: pausing share repurchases first, deferring uncommitted growth CapEx second, freezing discretionary M&A third, and protecting core maintenance CapEx and base dividend commitments.
Build Board-Ready Capital Allocation Decks With XLSlides
Transform financial models, business unit CapEx bids, ROIC analyses, and balance sheet strategies into an executive-ready, editable PowerPoint deck in minutes. XLSlides automates MECE structuring, action-titled exhibits, and board-level formatting so your strategic recommendations withstand tough board scrutiny.
Generate Capital Allocation DeckMethodology And Sources
- McKinsey & Company: Capital allocation under uncertainty and strategic portfolio review
- Michael J. Mauboussin & Dan Callahan (Morgan Stanley Investment Management): Capital Allocation - Returns, Hurdle Rates, and Portfolio Strategy
- Warren Buffett / Berkshire Hathaway Shareholder Letters: Principles of Capital Allocation Discipline
- Harvard Business Review: The CEO and CFO Role in Capital Allocation
- Aswath Damodaran (NYU Stern): Cost of Capital and Hurdle Rate Benchmarks by Sector