AOP Deck Takeaways
- An annual operating plan presentation is an approval document, not a departmental status collage.
- The opening pages should show targets, resources, assumptions, risks, and the specific decisions leadership needs to make.
- A strong AOP deck links growth, margin, hiring, cash, and capital allocation in one story so executives can see the tradeoffs.
- AI should accelerate structure, drafting, and formatting, while finance and operating leaders keep ownership of assumptions and judgment.
Direct Answer: What An Annual Operating Plan Presentation Must Do
An annual operating plan presentation should help a senior reader answer five questions quickly: what the company is trying to achieve next year, what assumptions sit behind the targets, what resources are required, what risks could break the plan, and what decisions leadership needs to approve now. If the deck cannot make those answers visible in the first few pages, it is not ready for a serious review. AOP decks are not meant to be pretty archives of spreadsheets. They are decision documents that convert a planning model into an operating commitment.
For CFOs, FP&A teams, chiefs of staff, business unit leaders, and PE-backed operators, the deck has to work under pressure. Executives skim it before a long planning session, jump straight to revenue, margin, cash, and headcount assumptions, and test whether management understands the downside as clearly as the upside. That is why the best AOP presentations are answer-first. They do not start with every function explaining its wish list. They start with the economic shape of the year, the constraints, the few priorities that matter most, and the management choices required to make the plan executable.
A useful AI workflow should therefore produce an editable first draft of the AOP deck: an opening summary, action-titled pages, scenario structure, budget logic, ownership mapping, and a clear slide sequence that finance and operators can refine. That is a stronger promise than generic slide generation because it respects how annual planning actually works.
Annual Operating Plan Vs. Budget Pack Vs. Board Deck Vs. Operating Review
These artifacts overlap, but they solve different executive jobs. Confusing them is one reason planning decks feel bloated or incomplete.
| Artifact | Primary Decision | Time Horizon | What Usually Goes Wrong |
|---|---|---|---|
| Annual operating plan presentation | Approve next-year targets, resources, and priorities | 12 months with monthly or quarterly checkpoints | It becomes a stitched-together budget file with no storyline |
| Budget pack | Confirm account-level numbers and expense allocations | Annual with detailed line items | It is too detailed for executives and too shallow for operators |
| Board deck | Frame governance decisions and oversight asks | Quarterly or event-driven | It reports activity without making the management ask explicit |
| Operating review | Explain current performance and corrective actions | Monthly or quarterly | It shows variance without linking back to the forward plan |
| Business case deck | Approve a specific investment or initiative | Single decision period | It proves a project but not the full-year operating picture |
| Investor update | Communicate progress and financing narrative | Quarterly or milestone-based | It prioritizes optics over the mechanics of execution |
Planning Architecture Reference
Why Most Annual Plans Read Like Aggregated Department Notes
Many annual operating plan decks fail because each function submits slides independently and finance assembles them too late to shape the story. The result is familiar: sales shows optimistic bookings, operations presents hiring needs, product asks for investment, HR proposes enablement work, and finance adds a summary page that tries to reconcile everything. None of those inputs are wrong by themselves. The problem is that the combined document still does not answer the leadership question of whether the plan is coherent, affordable, and resilient under downside conditions.
A serious AOP deck needs one governing narrative before the detailed slides exist. Management should decide what the year is trying to achieve, what constraints matter most, and which metrics are truly decision-relevant. For one company that may be growth and cash preservation. For another it may be margin recovery, service quality, and selective hiring. Once that logic is explicit, each functional page can support the argument instead of competing for space in the packet.
This is also where planning quality separates itself from planning theater. An executive team does not gain confidence because there are many slides. It gains confidence when the deck makes tradeoffs visible. If headcount grows, what output improves and when? If pricing is expected to lift margin, what commercial assumptions support that move? If capex is deferred, what risk is being accepted? The AOP becomes credible when the deck makes those cause-and-effect relationships explicit.
Inputs To Gather Before Drafting The AOP Deck
What The Opening Summary Must Tell Leadership
The first slide should reduce ambiguity, not create suspense. Executives should see the plan shape before they read the appendix.
| Executive Question | What The Slide Should Show | Why It Matters |
|---|---|---|
| What outcome are we planning for? | Revenue, margin, cash, and major strategic objectives in one concise frame | Leadership needs the economic shape of the year before debating details |
| What has to be true for the plan to work? | The five to seven assumptions that move the numbers most | AOP reviews usually fail when assumptions stay buried in spreadsheets |
| What resources are required? | Headcount, capex, vendor spend, and transformation asks | Approval decisions depend on visible resource consequences |
| Where is the downside? | Base, downside, and stretch sensitivity with likely trigger conditions | A plan without downside framing reads as advocacy rather than management |
| What is the decision today? | The specific approvals, escalations, or reprioritizations needed now | If the ask is fuzzy, the meeting will drift into commentary |
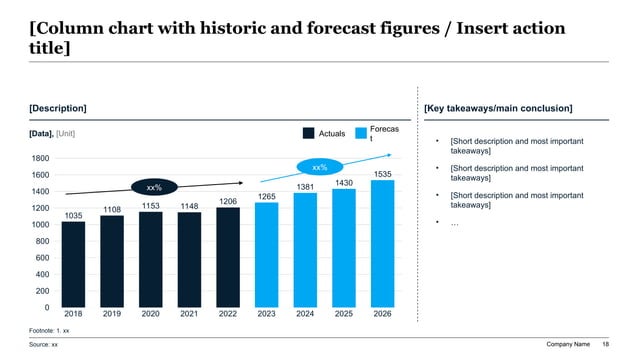
Actuals-To-Plan Baseline Reference
Build The AOP Around A Few Explicit Management Decisions
The easiest way to improve an annual planning deck is to define the management decisions before anyone opens PowerPoint. That means naming the choices the executive team is actually making: approve the hiring pace, narrow the set of growth bets, protect gross margin over top-line volume, hold discretionary spend until milestones are met, or front-load automation investment to reduce future operating cost. Once those decisions are visible, the slide sequence becomes much easier to build because every page either supports a decision or moves to the appendix.
This is where finance, strategy, and operating leaders should work together instead of handing the deck off function by function. Finance can frame the economic consequences. Strategy can keep the narrative coherent. Operators can confirm which assumptions are realistic in practice. That joint effort is what turns the AOP from a bookkeeping exercise into a management document.
A useful test is to read only the slide titles. If the titles do not tell the story of what the company expects to achieve, what it must invest, where the risk lies, and what leaders need to approve, the deck is not ready. Action titles are not a stylistic preference here. They are the fastest way to expose whether the logic is sound.
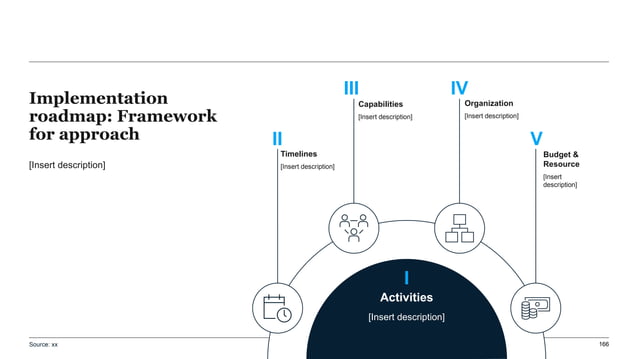
Recommended 13-Slide Annual Operating Plan Sequence
| Slide | Purpose | Leadership Question Answered |
|---|---|---|
| Executive summary | State the plan shape, assumptions, and asks | What are we approving? |
| Current-year exit rate | Anchor the baseline using actuals and forecast | What year are we really starting from? |
| Next-year target frame | Show revenue, margin, cash, and strategic goals | What is success? |
| Assumption bridge | Explain which levers move the plan | What has to be true? |
| Commercial plan | Show growth motion by segment, channel, or geography | Where does revenue come from? |
| Delivery or operating model | Translate demand into service, product, or capacity needs | Can we actually execute? |
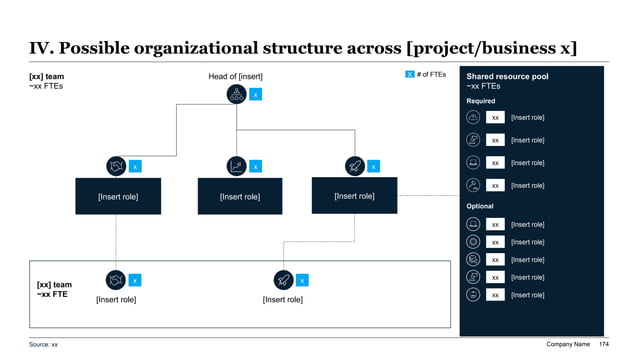
| Headcount and resource plan | Tie FTE, timing, and capability gaps to the target | What resources do we need? |
| Gross margin or unit economics | Show price, mix, productivity, or cost improvements | Why is the margin plan credible? |
| Cash and capital allocation | Connect EBITDA, working capital, and capex to liquidity | What is the cash consequence? |
| Scenario range | Compare base, downside, and stretch cases | How fragile is the plan? |
| Major risks and mitigations | Name what could break the year and the response | What should leadership monitor? |
| Review cadence and triggers | Define checkpoints, owners, and replan triggers | How will we govern the plan? |
| Decision asks | Summarize approvals, constraints, and next steps | What happens after this meeting? |
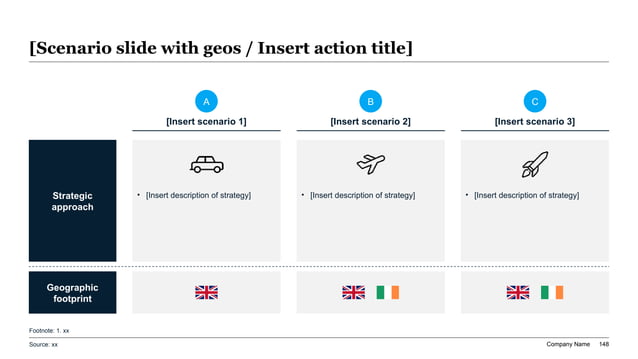
Scenario Range And Tradeoff Reference
Action Title Rewrite Matrix For AOP Slides
AOP titles should tell executives what to conclude from the page, not just what section they are reading.
| Weak Topic Title | Stronger AOP Title | Why The Rewrite Works |
|---|---|---|
| Revenue plan | Next-year growth depends on enterprise expansion and disciplined churn control, not broad pipeline optimism | It identifies the actual drivers behind the target |
| Hiring plan | Most net hiring should land in delivery and customer success because growth without service capacity will erode margin | It connects people cost to operating logic |
| Marketing budget | Demand generation spend should stay flat until conversion quality improves in two underperforming segments | It makes the budget conditional rather than automatic |
| Cash flow | The plan remains cash-positive only if collections improve and capex stays sequenced behind milestone delivery | It states the dependency instead of the topic |
| Scenario analysis | The downside case is manageable if hiring is phased and discretionary programs are gated by Q2 performance | It turns scenarios into management action |
| Next steps | Leadership needs to approve the hiring pace, capital envelope, and replan triggers this month | It makes the decision request visible |
Tie Growth, Cost, Hiring, And Cash Into One Operating Story
A weak annual plan lets each line item live on its own. Revenue is on one page, headcount on another, capex somewhere else, and cash becomes a final appendix exhibit. A strong plan makes the relationships unavoidable. If leadership wants faster growth, what staffing, service capacity, sales productivity, working-capital strain, and implementation risk follow from that choice? If the company wants to protect margin, what investment gets delayed and what revenue risk is being accepted? Those are the questions the AOP deck should make easy to discuss.
This is especially important for finance audiences because they care less about whether a number is large or small than about whether it is internally consistent. A hiring plan should not be presented without timing. A margin target should not be shown without the price, mix, productivity, or utilization logic behind it. A capex request should not stand alone from the operating milestones it is meant to unlock. Internal consistency is what makes the plan review faster because it reduces time wasted on preventable clarifications.
For AI-assisted drafting, the practical move is to feed the model structured planning inputs: prior-year actuals, current-year exit rate, next-year targets, the key assumptions, named risks, and the audience for the meeting. That is enough context for XLSlides to draft a coherent slide sequence and first-pass action titles. Management still needs to own the judgment about whether the assumptions are good enough to defend.
Headcount And Shared Resource Reference
Scenario Design Rules For A Practical AOP
Good scenarios are not decorative ranges. They should change the operating choices in visible ways.
| Scenario Component | What To Change | What The Deck Should Show |
|---|---|---|
| Revenue pace | Volume, conversion, pricing, or mix assumptions | Which commercial levers make the case higher or lower |
| Hiring timing | Role start dates, backfills, or contingent staffing | How capacity and cost move under each case |
| Discretionary spend | Programs that can be sequenced, paused, or accelerated | Which investments are fixed versus flexible |
| Margin path | Utilization, gross margin, or efficiency improvements | Whether the plan depends on real operating change or simple optimism |
| Cash exposure | Collections, inventory, capex, debt service, or runway | How much liquidity room leadership has if the year softens |
| Decision triggers | The metrics or dates that force a replan | What management will do instead of waiting too long |
Questions Leadership Will Challenge During The Plan Review
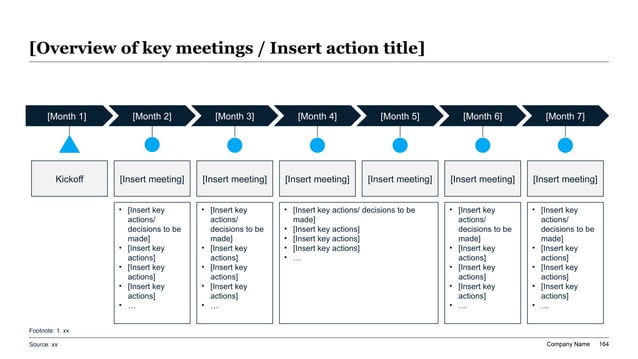
Decision Calendar And Review Cadence Reference
Prompt Recipe For An Annual Operating Plan Presentation
Create a 13-slide annual operating plan presentation for a CFO, CEO, chief of staff, and business unit leaders at a PE-backed B2B services company. Current-year exit: revenue slightly above plan, EBITDA below plan because utilization and overtime are unfavorable, cash collections improved in Q4 but remain fragile, and leadership wants selective growth without expanding fixed cost too quickly. Build an answer-first executive summary, current-year baseline, next-year targets, assumption bridge, commercial plan, delivery and capacity needs, hiring plan, margin and cash logic, base/downside/stretch scenarios, major risks, governance cadence, explicit approvals, and appendix source-note placeholders. Use consultant-style action titles, make tradeoffs visible, and keep the output editable in PowerPoint style rather than decorative.
What AI Should Automate In The Planning Workflow
AI is most useful in the annual planning cycle when it removes mechanical presentation work. It can convert planning notes into a proposed storyline, turn spreadsheet outputs into draft action titles, suggest where scenario slides should sit in the sequence, map every page to an appropriate layout, and produce the first version of the executive summary. Those are real time savers because planning teams often spend too much energy translating already-known logic into deck form.
What AI should not own is the economic truth of the plan. It should not pick the hiring pace, decide whether the stretch case is credible, approve capex, or quietly smooth over disagreements between finance and operators. Those are precisely the decisions that senior teams need to debate. If a tool hides those disagreements behind polished wording, it is making the plan less useful, not more useful.
The right role for XLSlides is therefore clear. It should generate the first serious draft of the AOP deck: a coherent outline, executive-ready pages, action titles, scenario framing, and editable output that can move through normal CFO and CEO review. That is what sophisticated users want from AI in this workflow. They want less formatting drag and more time for judgment.
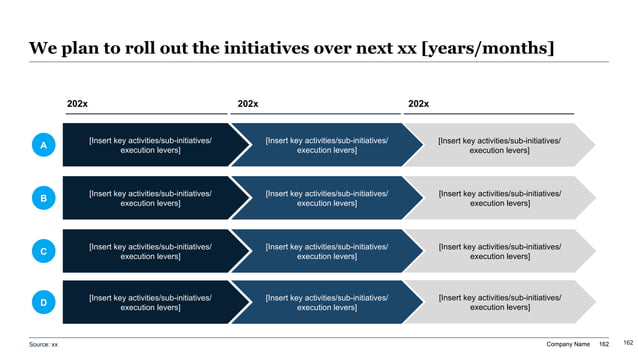
Multi-Workstream Rollout Reference
Short Answers To Common AOP Questions
What should be on the first slide of an annual operating plan presentation?
The first slide should show the economic shape of the year and the decisions management needs approved. In practice that means the next-year revenue, margin, cash, and strategic priorities, the few assumptions that matter most, the headline resource asks, and the downside or sensitivity frame. Senior readers should not have to wait until slide eight to learn whether the company is planning for controlled growth, margin recovery, cash preservation, or an investment year. If the first slide hides the plan shape, the deck usually reads as a collection of pages rather than a management document.
How is an AOP deck different from a monthly operating review?
A monthly operating review explains current performance and corrective action. An AOP deck asks leadership to commit to the coming year. That shifts the center of gravity from variance explanation to target-setting, resource allocation, scenario design, and governance. The same metrics may appear in both documents, but the annual plan needs a stronger forward view. It should make explicit what management is betting on, what capacity must be added, which costs are fixed or flexible, and what triggers would force a replan.
How many scenarios should a serious annual plan include?
Usually three are enough: base, downside, and stretch. More than that can turn the deck into a spreadsheet tour unless each scenario changes a real operating choice. The goal is not to display every possible outcome. The goal is to show which assumptions matter, what management would do if the year runs softer or stronger than expected, and where risk tolerance sits. A good scenario page changes the decisions; it does not merely widen the numeric range.
Can AI create a credible annual operating plan deck?
Yes, if the team treats AI as a drafting system rather than a planning authority. XLSlides can turn working-session notes, budget outputs, planning assumptions, and executive context into a first-pass deck with action titles, scenario framing, and an editable slide structure. That is valuable because it compresses the time from planning work to executive review. The final assumptions, prioritization, and risk decisions still need human ownership. Sophisticated finance and strategy teams do not want AI to replace judgment. They want it to remove formatting drag and help them review a better first draft.
Final Readout Checklist Before CFO And CEO Review
Create The First Draft In XLSlides
Use XLSlides to turn planning notes, forecast outputs, headcount requests, capex asks, and scenario assumptions into an editable annual operating plan presentation with action titles, scenario framing, resource logic, and PowerPoint-ready structure.
Generate AOP Deck