Key Takeaways
- A QBR should explain business impact and the next-quarter plan, not just replay metrics.
- The best quarterly business reviews lead with outcomes, then explain the drivers, risks, and actions behind them.
- Customer-facing QBRs and internal executive QBRs share the same discipline but differ in tone, confidentiality, and decision asks.
- Action titles, value realization proof, and a short list of next-quarter commitments matter more than decorative slide design.
- AI is most valuable when it turns spreadsheets, meeting notes, and adoption data into an editable first draft that a human owner can refine.
Direct Answer: What A QBR Deck Generator Should Actually Produce
A useful QBR deck generator should create the first structured draft of a quarterly business review that an executive, account sponsor, or revenue leader can act on immediately. The output should show what happened in the quarter, what business value was created, where the risks are emerging, and what the next quarter requires from both sides. If the tool only produces a neat recap of charts without a storyline, it is not solving the real job.
The job of a QBR is not to celebrate activity. It is to convert scattered data points into a business conversation. For a customer success team, that means showing product adoption, realized outcomes, blockers, and expansion opportunities in one coherent narrative. For an internal operating review, it means showing whether the team delivered against plan, what changed, and where leadership needs to intervene. In both cases, the reader should understand the implication of the quarter before they start decoding each metric tile.
For XLSlides, the product fit is strong because QBR inputs are usually messy: CRM exports, health scores, implementation notes, renewal timelines, open risks, usage trends, and stakeholder requests. A serious AI workflow can turn those raw materials into a boardroom-style first draft with action titles, concise commentary, executive summary blocks, roadmap pages, and editable PowerPoint-style output. Human judgment still decides whether the story is honest, commercially smart, and appropriate for the audience.
QBR Deck Vs. Board Deck Vs. Investor Update Vs. Renewal Review
These formats overlap, but they are not interchangeable. A generator that treats them as the same deck usually produces weak quarterly reviews.
| Deck Type | Primary Audience | Main Question | What Must Be Clear Early |
|---|---|---|---|
| QBR deck | Customer sponsors, account leaders, executives, or internal operators | What happened this quarter and what should happen next? | Outcome summary, KPI movement, risks, and next-quarter actions |
| Board deck | Directors, CEO, CFO, and functional executives | What does the board need to approve, challenge, or monitor? | Decision ask, variance implications, major risks, and management recommendation |
| Investor update | Current or prospective investors | How is the company progressing and where does support help? | Milestones, KPI trajectory, runway, priorities, and confidence level |
| Renewal review | Procurement, customer sponsor, account team | Why should the relationship continue or expand? | Business value delivered, adoption proof, risk treatment, and commercial path |
| Operating review | Internal executives and workstream owners | Where is execution on or off plan and who owns the fix? | Variance drivers, decisions required, and execution accountability |
Executive Summary Card Cluster Reference
Why Most Quarterly Business Reviews Underperform
Most QBR decks fail for a simple reason: they confuse reporting with decision support. Teams export dashboards, drop in screenshots, and speak slide by slide through everything that happened in the quarter. The audience sees plenty of data but still cannot answer the important questions. Did the team create business value? Are there real risks to retention or execution? What is management or the account team asking the audience to do next?
A second problem is audience ambiguity. Many teams build one generic deck and try to use it for the customer sponsor, the internal leadership team, and the renewal committee. That usually produces the wrong level of detail for all of them. A customer-facing QBR should emphasize outcomes, adoption, roadmap alignment, and commercial opportunities. An internal QBR should be more direct about execution misses, process issues, stakeholder friction, and owner accountability.
The best QBRs feel more like a concise business memo than a status slideshow. They start with the answer, make the movement in the quarter visible, show the drivers behind the movement, and end with a concrete next-quarter plan. That discipline is exactly where an AI deck workflow helps. It can generate the structure and draft commentary quickly, but the operator still needs to decide what is materially true and what the audience should actually conclude.
Inputs To Gather Before Drafting A QBR
What Executives And Sponsors Need From A QBR
Executives rarely want more screenshots. They want the business implication of the quarter in language they can use.
| Need | What The Deck Should Show | Common Mistake |
|---|---|---|
| Outcome clarity | A short answer on whether the quarter advanced, stalled, or reset the relationship or workstream | Opening with a topic label instead of a conclusion |
| Value proof | Specific KPI movement, milestone delivery, or cost/revenue implication tied to the account or initiative | Showing activity counts without connecting them to business impact |
| Risk visibility | The few issues that could hurt adoption, delivery, renewal, or next-quarter targets | Burying risk in the appendix or hiding it behind neutral language |
| Forward plan | Three to five explicit actions with owners, timing, and expected outcome | Ending with vague next steps or a generic thanks slide |
| Commercial or strategic implication | Expansion opportunity, scope change, budget request, or executive support required | Avoiding the real ask until after the meeting |
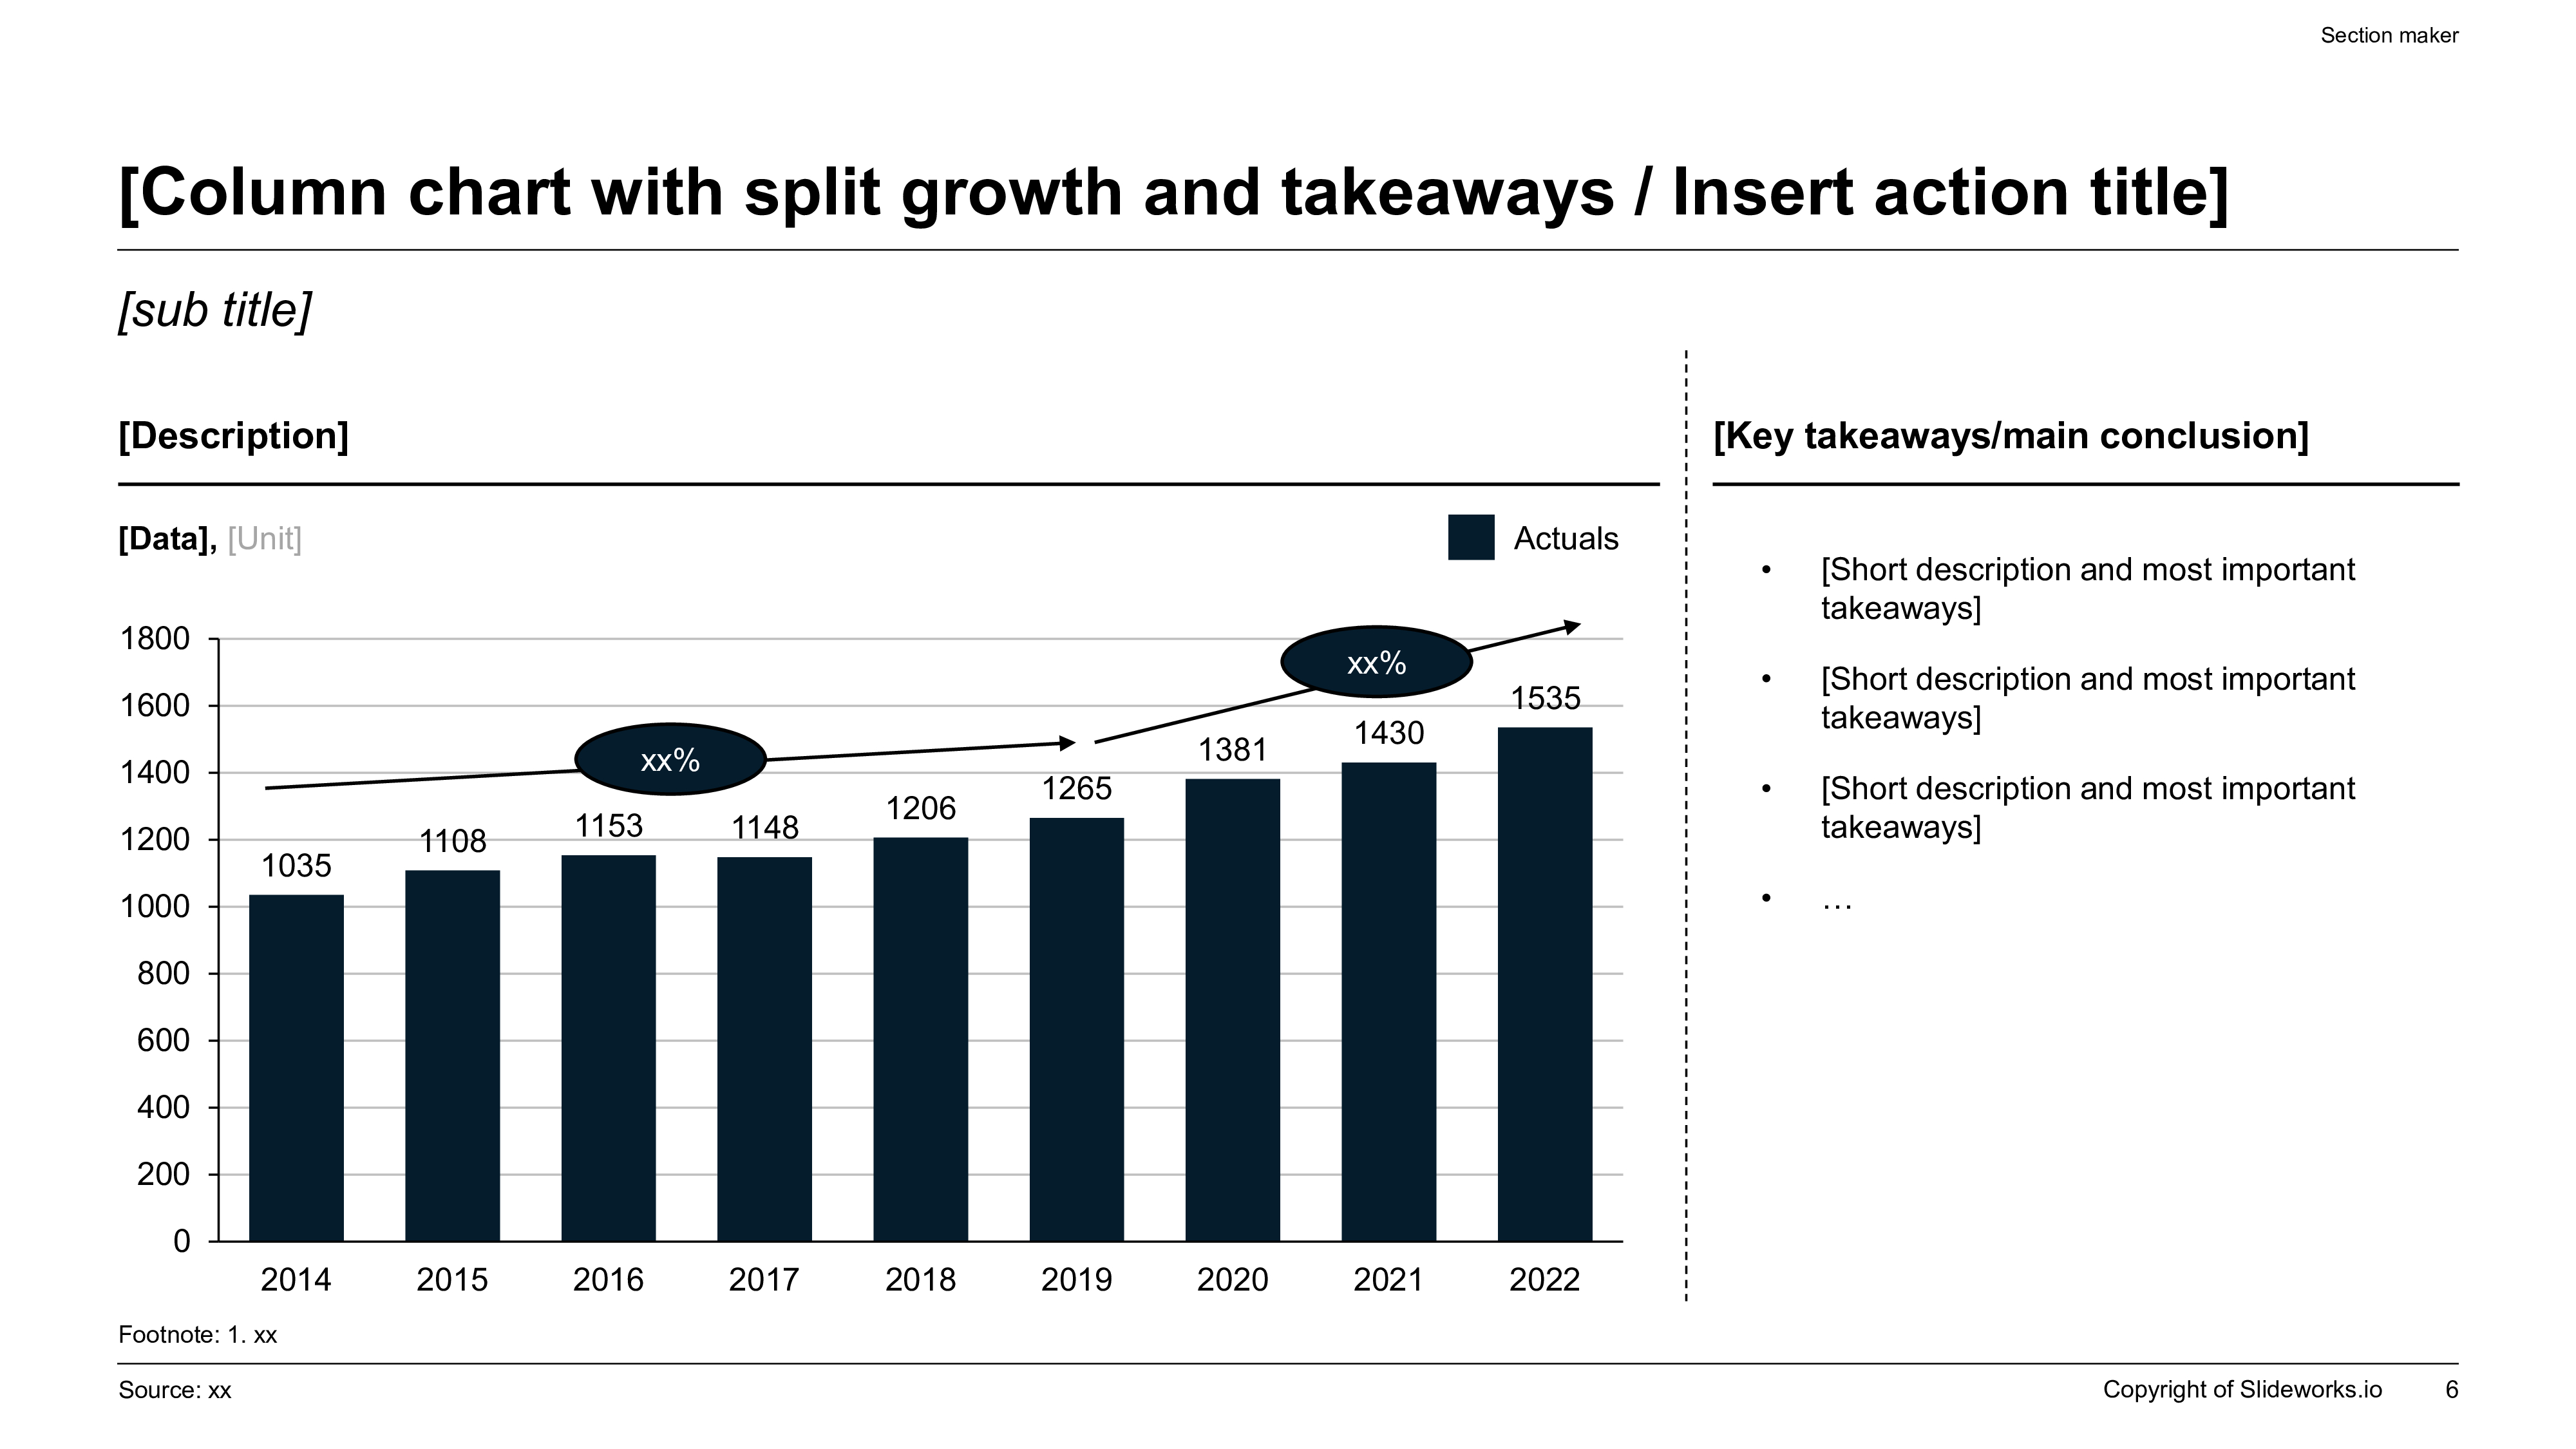
Trend And Takeaway KPI Reference
Structure The QBR Story Around Outcomes, Drivers, Risks, And The Next Quarter
A strong QBR usually follows a simple arc. First summarize the business outcome of the quarter. Then explain the drivers behind that outcome. Then surface the risks that could change the next quarter. Finally, show the plan and requests that turn the review into forward motion. This sounds obvious, but many teams reverse the order and spend most of the deck on context before they state what the quarter means.
For customer-facing teams, the word outcome matters. Sponsors do not primarily care that twelve enablement sessions happened or that the team logged eighty support interactions. They care whether adoption improved, whether business goals moved, whether the delivery plan stayed credible, and what support is required to unlock the next stage of value. A good QBR therefore converts operational activity into a business story: what the customer got, what is still blocking them, and what both sides should do now.
For internal teams, the same logic applies with a different emphasis. The deck should translate plan-versus-actual data into management judgment. Which metric changed enough to matter? Which workstream created the result? Which commercial, product, or service issue deserves executive attention? AI can draft this structure quickly when the prompt includes the audience, objective, quarter, KPI deltas, main risks, and next-quarter goals. Without that context, the output will tend to look like a generic performance recap.
Recommended 12-Slide QBR Sequence
| Slide | Purpose | Question Answered |
|---|---|---|
| Executive summary | State the quarter outcome, main risks, and next-quarter goal | What should we know first? |
| Objective and audience context | Clarify whether the review is customer-facing, internal, or renewal-oriented | What is this review trying to accomplish? |
| Scorecard snapshot | Show the few metrics that define the quarter | How did performance move? |
| Value realization or business impact | Translate activity into savings, growth, adoption, or execution outcomes | Why did this quarter matter? |
| Driver analysis | Explain what actually caused the result | What moved the metrics? |
| Wins and proof points | Show evidence of delivered milestones or customer outcomes | What went well and why is it credible? |
| Risks and blockers | Surface the issues that could hurt the next quarter | What might go wrong? |
| Opportunity or expansion case | Frame the growth path, scope change, or support needed | What upside is available? |
| Next-quarter roadmap | Map actions, timing, and owners | What happens next? |
| Stakeholder alignment | Clarify responsibilities across teams or customer counterparts | Who owns each move? |
| Decision requests | List approvals, support, or executive asks | What do we need from the audience? |
| Appendix | Preserve backup metrics and detail | Where is the proof if challenged? |
Action Title Rewrite Matrix For QBR Slides
A QBR headline should tell the reader what to conclude, not just what the slide contains.
| Weak Topic Title | Stronger QBR Action Title | Why The Rewrite Works |
|---|---|---|
| Q2 adoption metrics | Weekly active usage improved because training expanded beyond the core admin group | It connects the metric to the driver and the implication |
| Renewal status | Renewal confidence is high, but security review timing is now the main dependency | It surfaces the real risk instead of a vague status label |
| Customer goals | Three of five target outcomes are on track, while automation savings remain delayed | It balances progress and the unresolved issue |
| Support performance | Response time improved, but unresolved workflow gaps still depress executive satisfaction | It prevents the team from hiding behind one positive metric |
| Expansion opportunities | A service expansion in Region A is viable if adoption stabilizes in the current scope first | It frames upside with a condition rather than hype |
| Next steps | Both teams need to commit owners and deadlines this month to hit the Q3 adoption target | It makes the follow-through explicit |
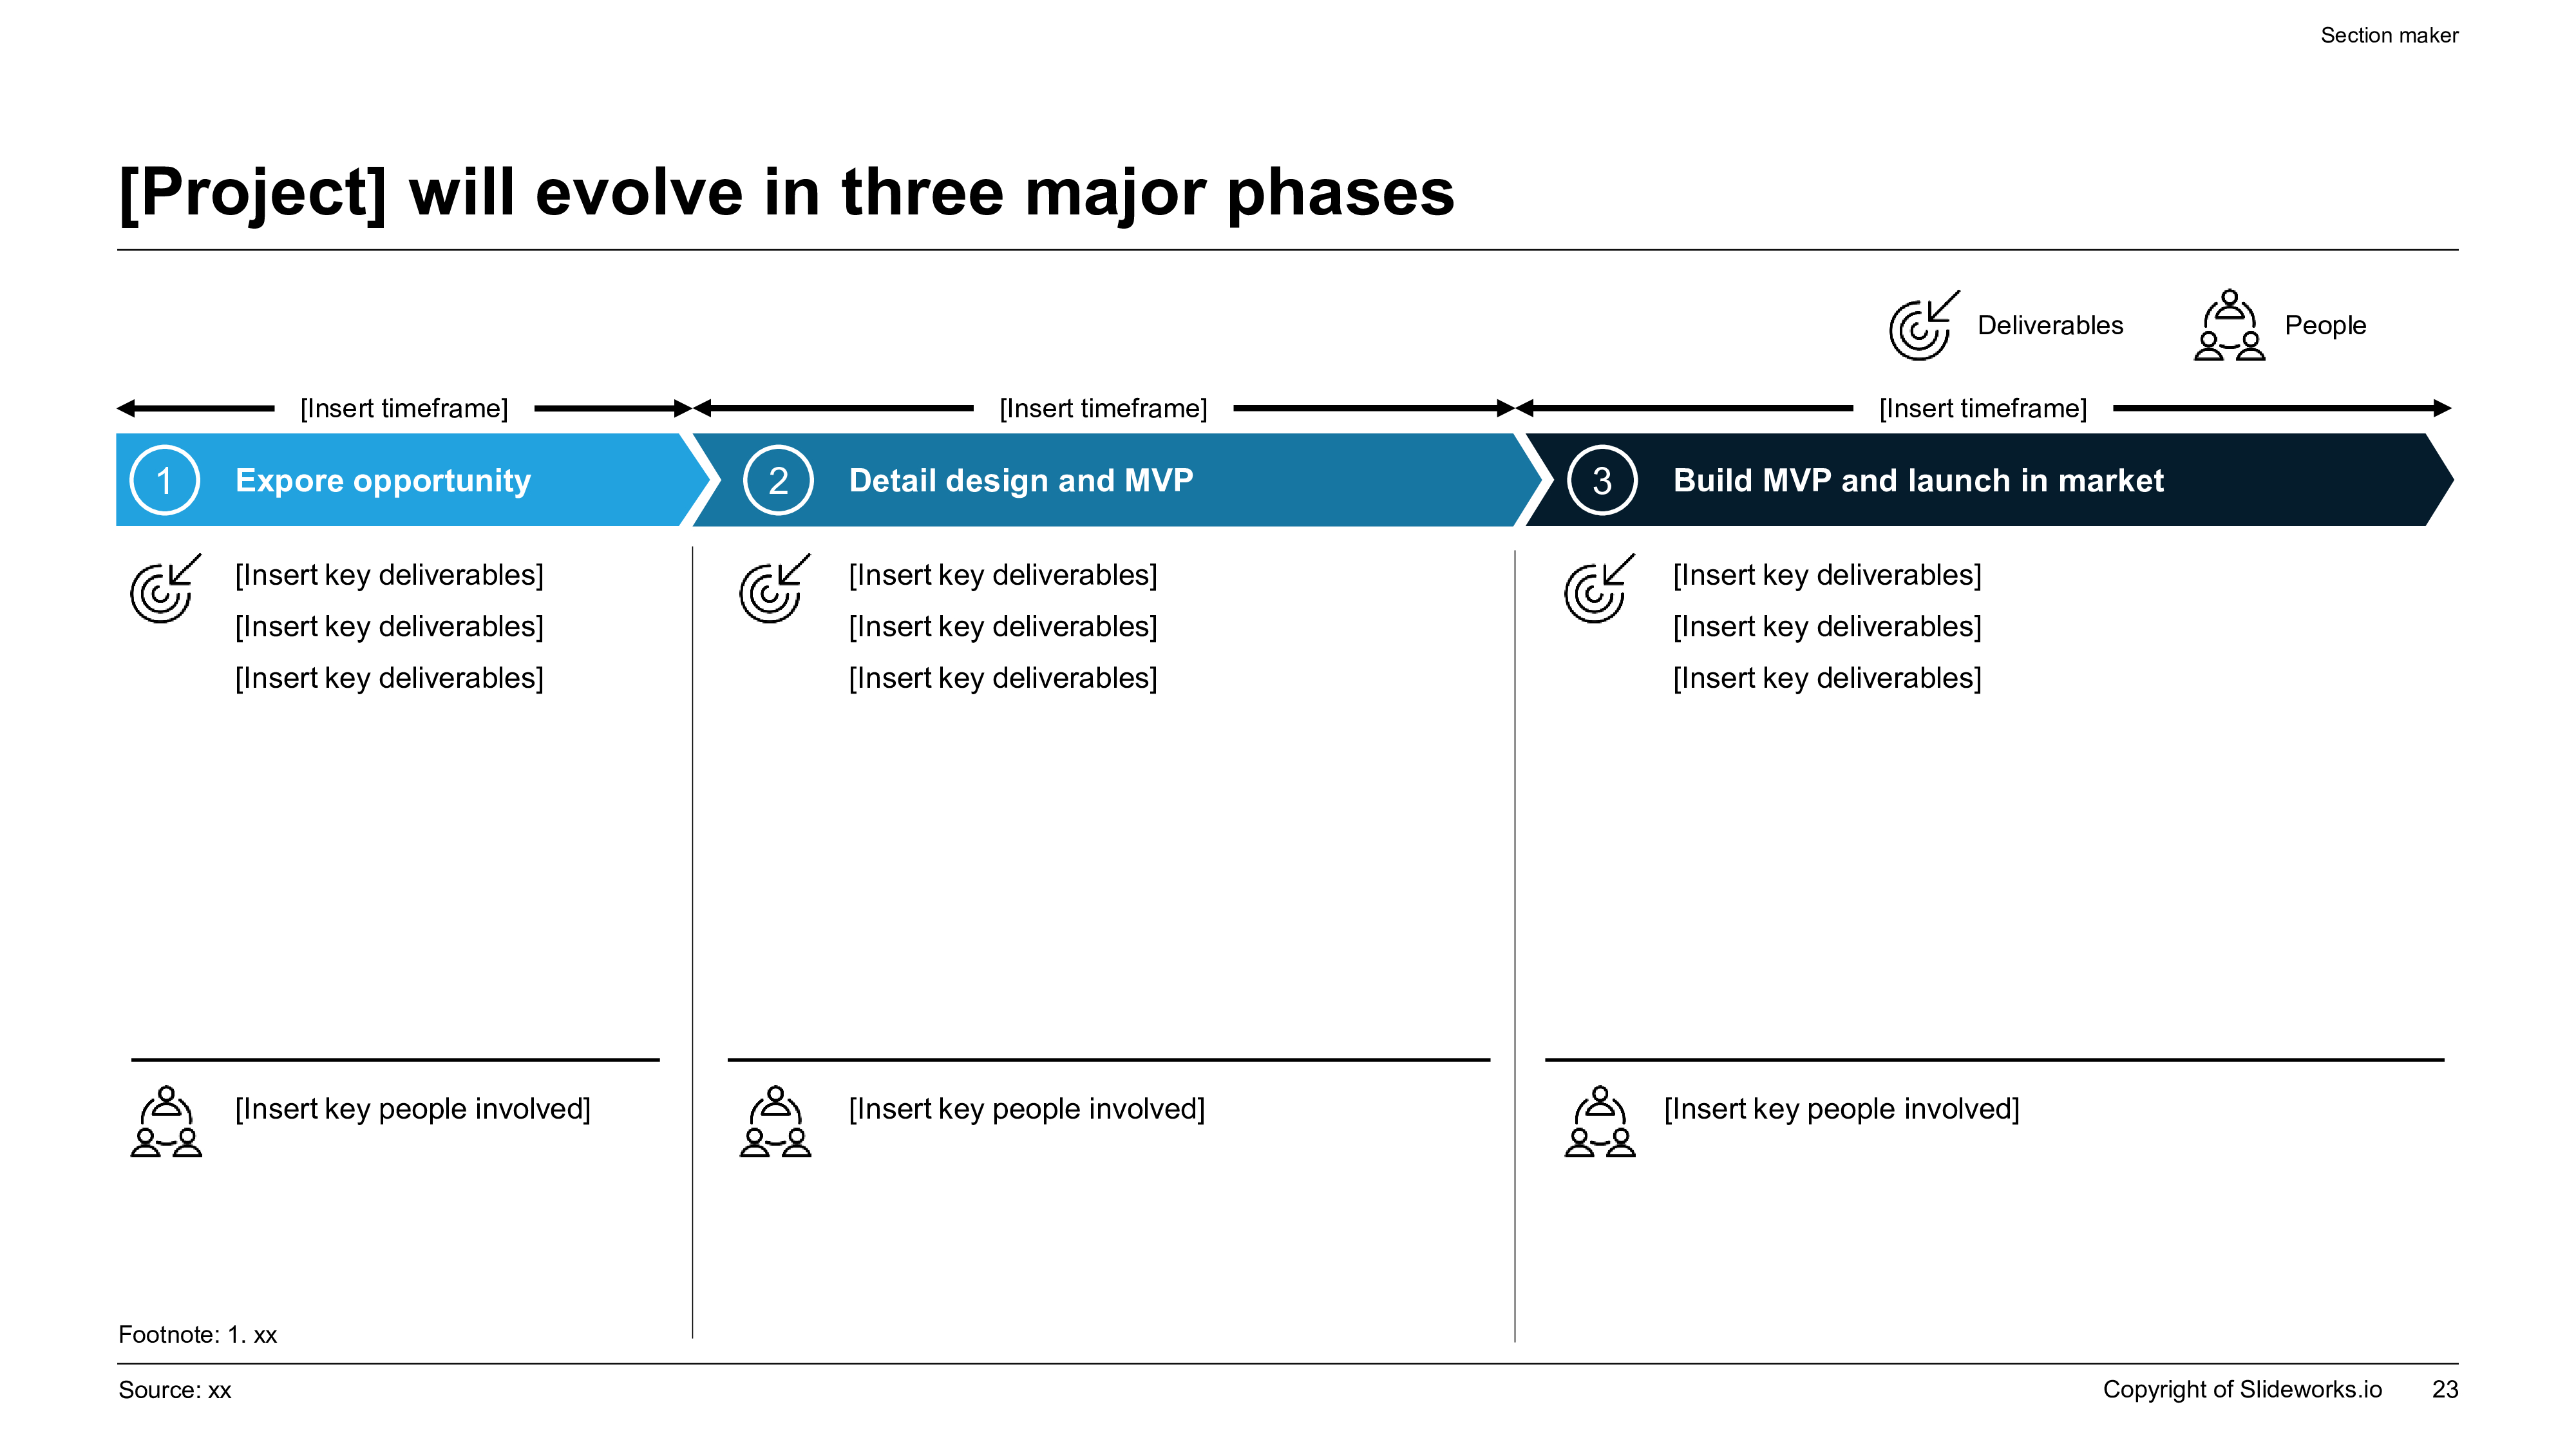
Next-Quarter Roadmap Reference
Value Realization Is The Center Of A Good QBR
If a QBR is customer-facing, value realization is the center of gravity. The audience is asking, explicitly or implicitly, whether the relationship is producing results worth defending. That means the deck should translate product usage, service activity, delivery milestones, and stakeholder effort into business outcomes the sponsor recognizes. Savings achieved, hours reduced, revenue enabled, onboarding accelerated, backlog cleared, or risk removed are all stronger than raw activity counts on their own.
This is also where weak decks become noisy. Teams often present every operational metric because they are afraid to choose. Executives interpret that as uncertainty. A stronger approach is to select the few measures that represent the actual thesis of the quarter. If the goal was adoption, show adoption and the business impact of adoption. If the goal was implementation stability, show stability and what it unlocked. If the goal was upsell readiness, show the proof that the customer can absorb more scope.
Internal QBRs need the same discipline, just with different labels. Instead of value realization for a customer, the team may need to prove execution quality, revenue conversion, margin improvement, or service health. The narrative principle does not change: the deck should show what the quarter delivered, why it happened, and how that result changes the next-quarter plan.
Customer-Facing QBR Vs. Internal Executive QBR
Use the same structural discipline, but adjust the content to the reader and the political reality of the meeting.
| Dimension | Customer-Facing QBR | Internal Executive QBR |
|---|---|---|
| Primary goal | Prove value, align on next-quarter priorities, and protect or expand the relationship | Review execution quality, fix issues, and secure leadership decisions |
| Tone | Direct but constructive, with careful language around unresolved issues | More candid about misses, operational friction, and accountability |
| Metrics emphasis | Adoption, ROI, milestone progress, stakeholder engagement, renewal indicators | Pipeline, margin, delivery quality, productivity, churn drivers, owner performance |
| Risk treatment | Frame risk honestly while preserving trust and showing mitigation | Surface risk in sharper detail and name the escalation path clearly |
| Closing ask | Executive sponsorship, alignment on plan, commercial discussion, or resource support | Decision, budget, staffing, process change, or leadership intervention |
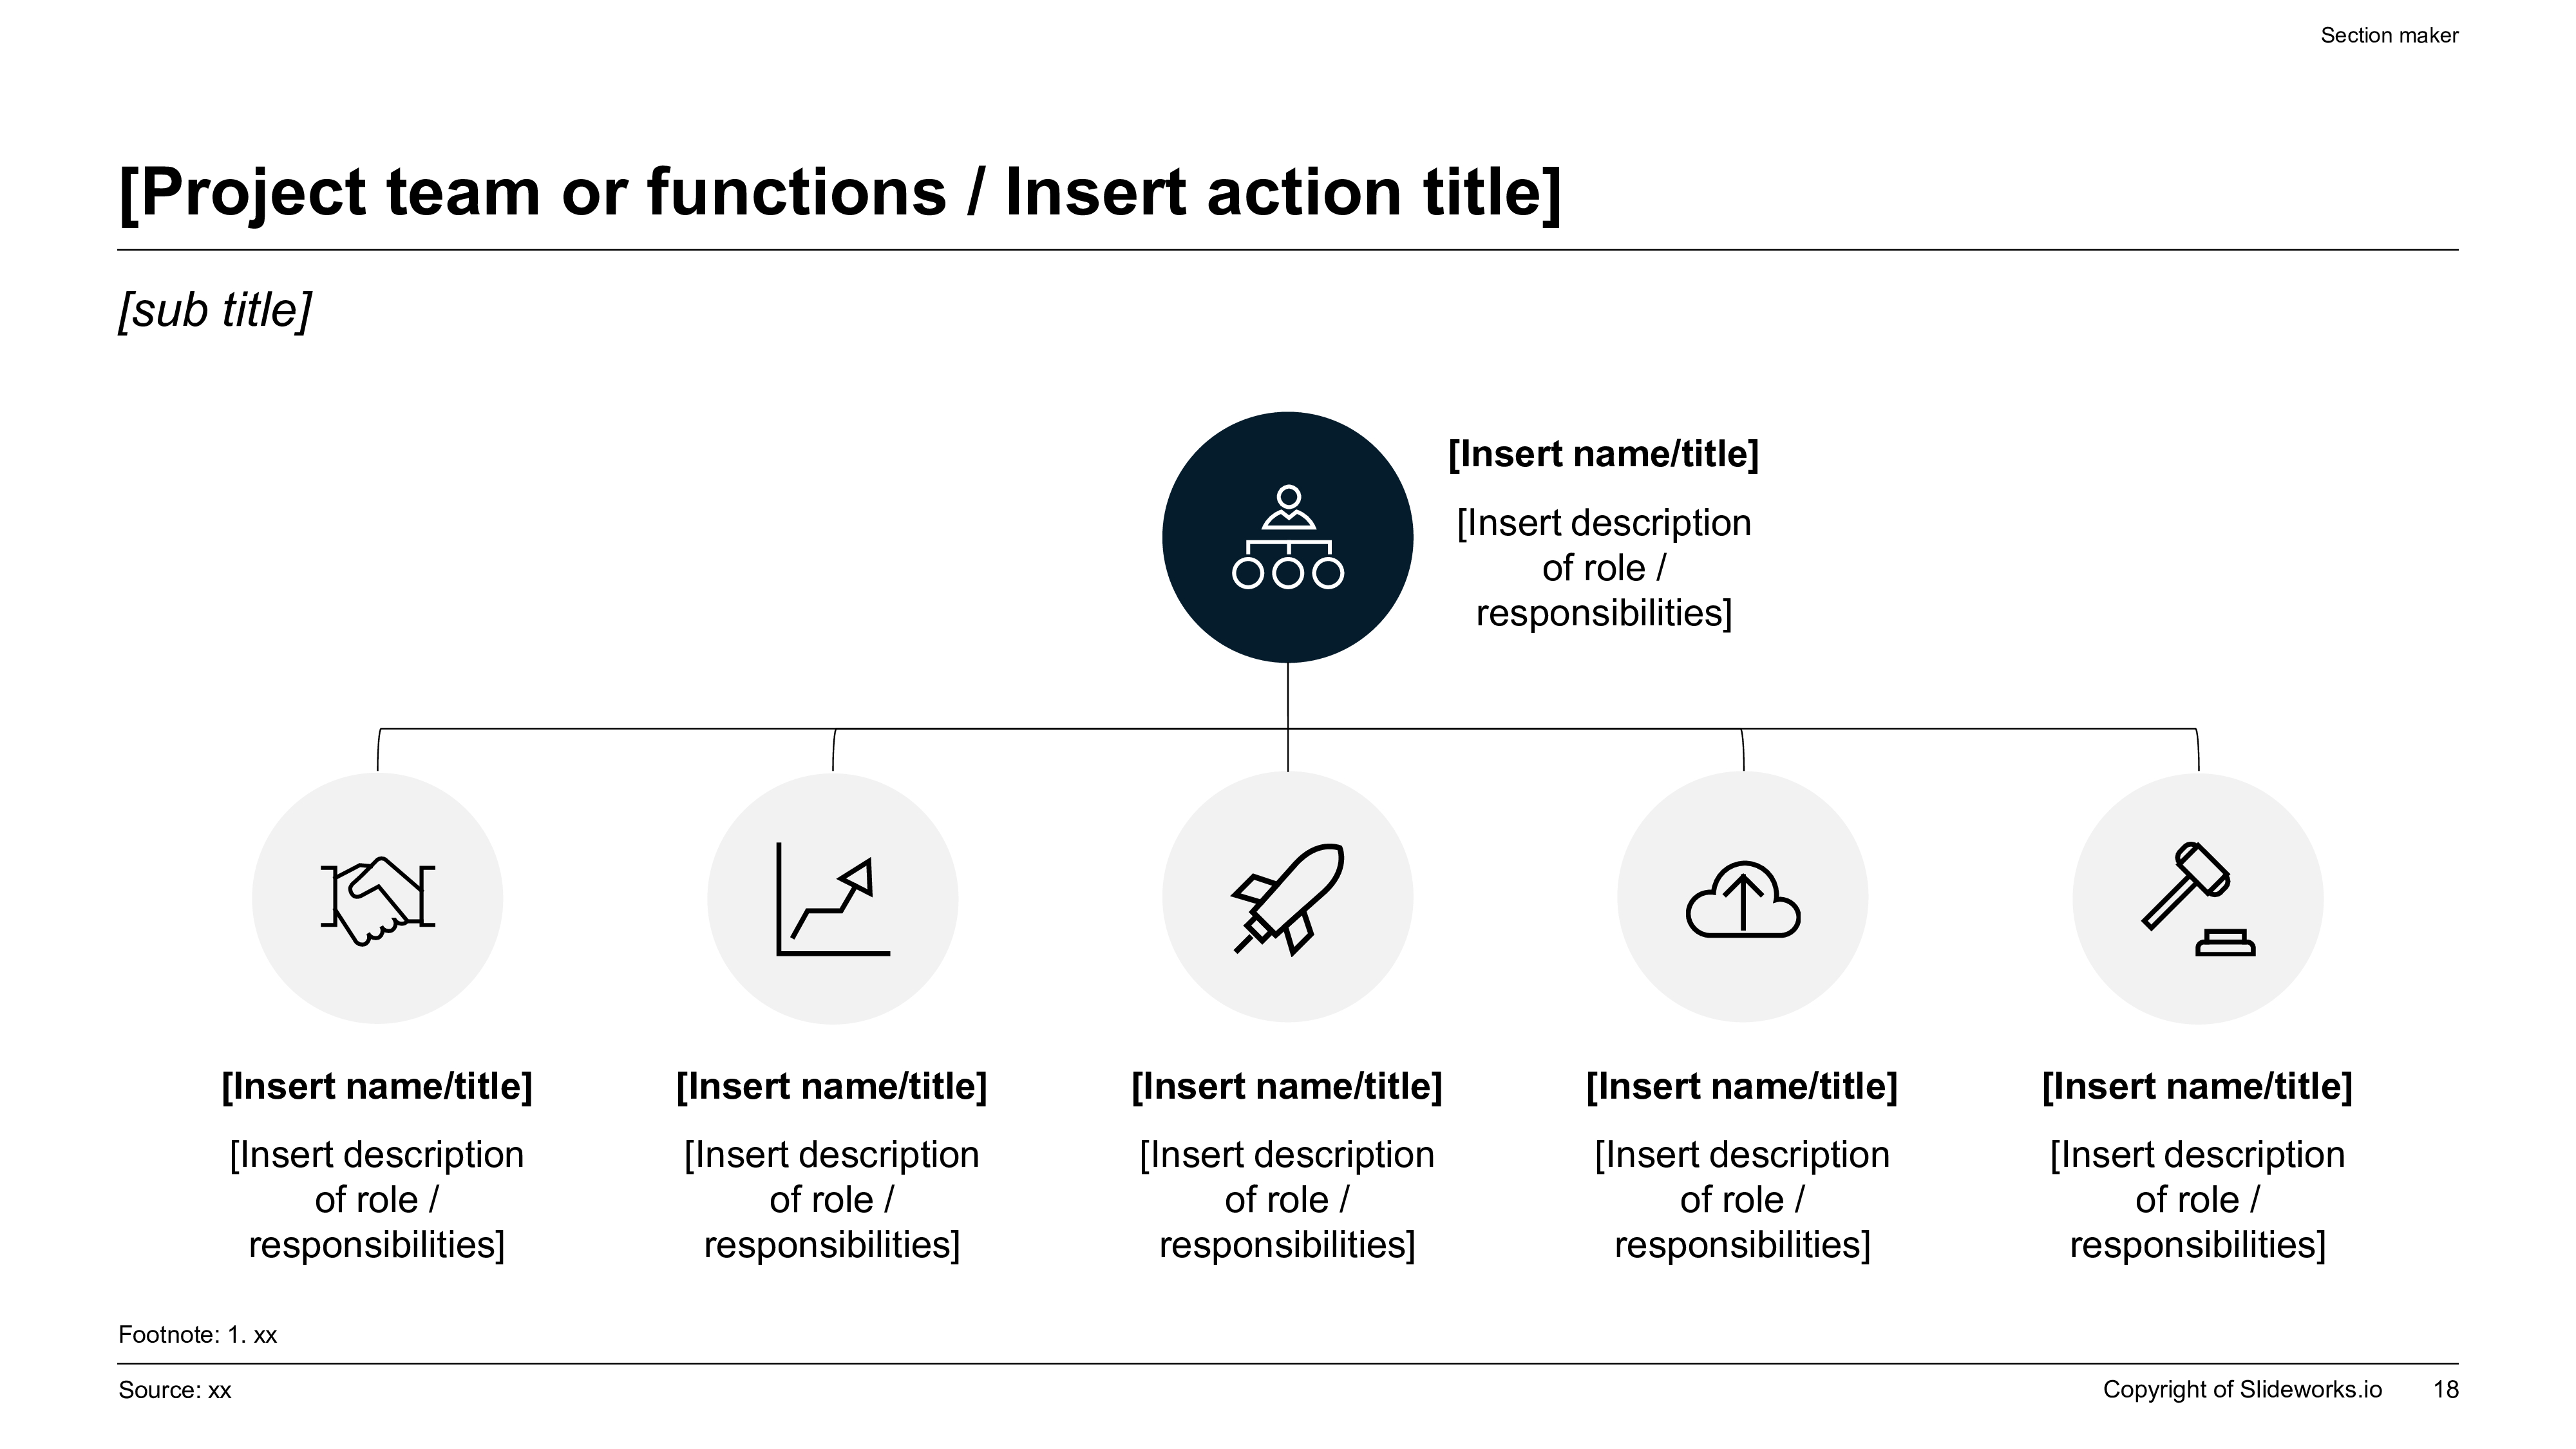
Stakeholder Ownership Map Reference
What AI Should Automate In A QBR Workflow
QBR preparation is full of repetitive presentation work that consumes senior time without improving the underlying business judgment. Teams copy metrics from dashboards, rewrite the same commentary every quarter, reformat action logs, and rebuild roadmap pages from scratch. Those are good automation targets because they follow recognizable patterns and still benefit from human review.
The right AI workflow starts with structured inputs, not a blank prompt. Feed the tool the quarter objective, audience, KPI movement, main wins, major blockers, renewal timing, expansion hypothesis, and next-quarter priorities. Then ask it to draft the storyline, action titles, executive summary, value proof, risk section, and action plan. That creates a serious first draft much faster than manually reassembling slides, while keeping the operator in control of claims and nuance.
What AI should not do is invent customer outcomes, soften uncomfortable risks, or imply commercial certainty that the team has not earned. A QBR often sits close to account politics, renewal sensitivity, and cross-functional accountability. Those parts still need human judgment. XLSlides is most useful when it removes formatting debt and gives the team a credible draft they can sharpen before the meeting.
What AI Can Draft Vs. What Humans Must Decide
Use automation for structure and speed, then keep senior judgment on the commercial and political questions.
| Workflow Step | Good AI Contribution | Human Judgment Still Required |
|---|---|---|
| Executive summary drafting | Turn raw notes and KPI changes into a first-pass quarter narrative | Decide whether the message is honest, commercially useful, and appropriate for the audience |
| Metric commentary | Convert dashboard deltas into draft action titles and short business explanations | Validate causality and remove commentary that overstates the evidence |
| Value realization framing | Propose ways to translate activity into business outcomes | Choose the claims that are truly defensible with customer or internal proof |
| Roadmap pages | Create phased next-quarter plans with owner placeholders and milestone structure | Commit to realistic dates, named owners, and escalation rules |
| Risk synthesis | Group open issues into clear categories with mitigation bullets | Judge which risks need to be surfaced directly and how bluntly they should be stated |
| Formatting and layout | Apply a clean executive visual system quickly across the full deck | Final-review readability, sensitivity, and audience-specific wording |
Prompt Recipe For A QBR Deck Generator
Create a 12-slide QBR deck for an enterprise software account review. Audience: VP sponsor, operations lead, customer success director, and account executive. Quarter: Q2. Goals this quarter: increase active user adoption, reduce implementation backlog, prove ROI from workflow automation, and prepare for renewal discussion in Q4. Include an answer-first executive summary, scorecard snapshot, value realization proof, driver analysis, wins, blockers, renewal risks, expansion opportunities, next-quarter roadmap, stakeholder ownership map, and explicit action requests. Use consulting-style action titles on every slide, make the tone executive and commercially realistic, and leave source-note placeholders anywhere a metric or claim appears. Design for editable PowerPoint-style handoff rather than decorative web slides.
Adoption And Status Matrix Reference
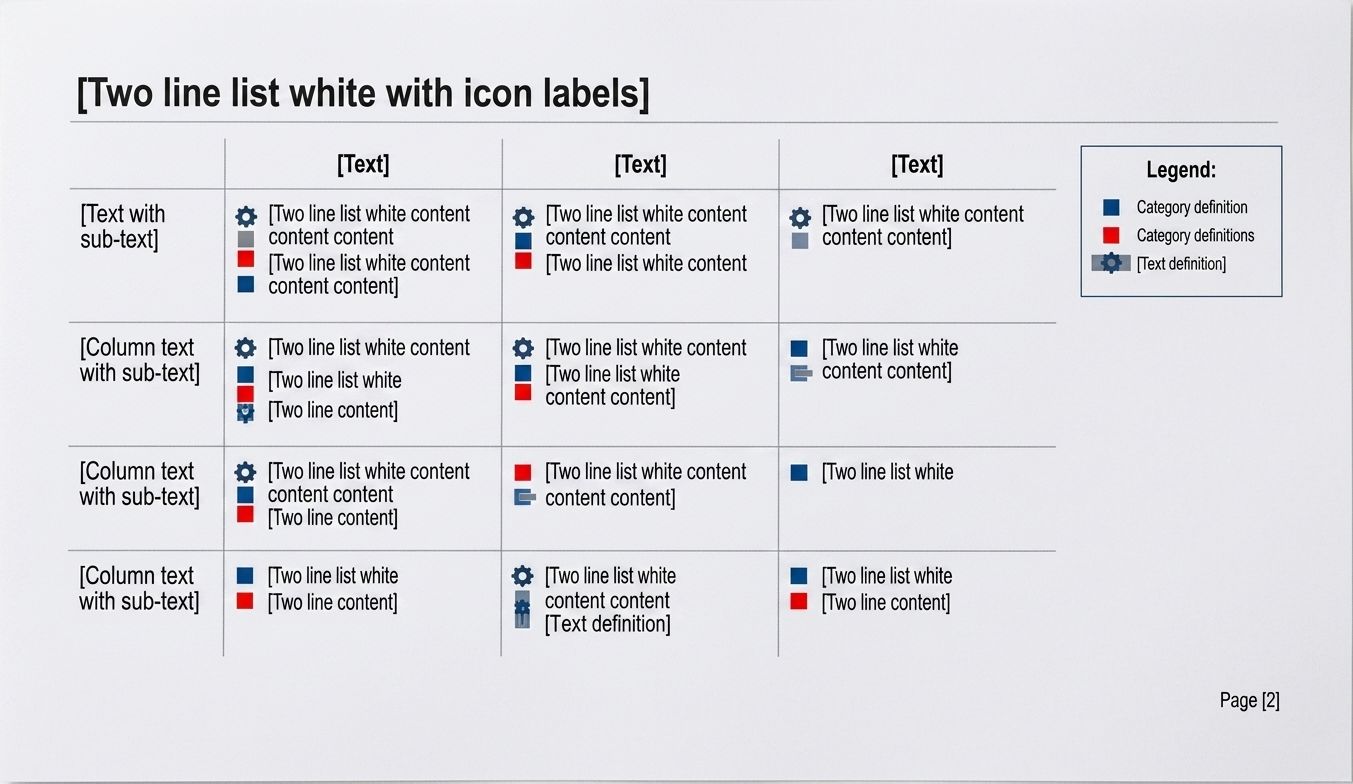
Common QBR Failure Modes
The first failure mode is the data dump. The deck contains many charts, but none of them are prioritized. The audience leaves with facts but no answer. This usually happens when the team is afraid to choose the main message of the quarter. If everything is important, the QBR will read as if nothing is important.
The second failure mode is overpromising. Teams feel pressure to keep the tone positive, so they present roadmap ambition and expansion opportunity without naming the dependencies that could break the plan. That may preserve the mood of the meeting in the moment, but it weakens trust later. Senior readers would rather see an honest plan with visible mitigation than a polished story that ignores reality.
The third failure mode is weak follow-through. A QBR ends with generic next steps, but no owner, date, or measurable outcome is attached. That turns the review into a presentation event rather than an operating mechanism. The strongest QBRs close with a short set of accountable actions that the next quarter can actually revisit.
Frequently Asked Questions
What should a QBR deck include?
At minimum, include an answer-first summary, the key scorecard, business impact or value realization, the drivers behind the quarter, the major risks, and a short next-quarter plan with named actions.
How is a QBR different from a board deck?
A QBR is usually focused on quarterly performance, value delivered, and the next operating plan. A board deck is more governance-oriented and needs a clearer decision ask, sharper variance framing, and board-level risk treatment.
Should a QBR be customer-facing or internal?
Both exist. Customer-facing QBRs prove value and align on the next quarter with sponsors. Internal QBRs are more candid operating reviews used to fix issues, allocate resources, and escalate decisions.
Can AI generate a good quarterly business review presentation?
AI can generate a strong first draft when the prompt includes the audience, quarter objective, KPI shifts, wins, blockers, and next-quarter goals. A human owner still needs to validate the claims, tone, and commercial realism before sending it.
Final Review Checklist Before Sending The QBR
Build The First Draft In XLSlides
Use XLSlides to turn CRM exports, customer notes, adoption reports, stakeholder requests, renewal timelines, and next-quarter goals into an editable QBR deck with executive summary pages, KPI commentary, roadmap structure, and clean PowerPoint-ready output.