Professional QBR Deck Templates

Stop wasting hours on manual formatting. Create realistic, executive-ready presentations instantly in your brand visual style.

Performance metrics dashboards
Strategic alignment blocks
Executive-ready summaries

1What is the Quarterly Business Review (QBR) Presentation?

The Quarterly Business Review (QBR) presentation is a highly structured, performance-driven deck designed to align cross-functional teams, departmental leaders, and external client stakeholders on strategic progress. Conducted once every fiscal quarter, a professional QBR moves beyond simple operational updates to establish a rigorous, narrative-driven evaluation of key performance indicators (KPIs), business milestones, and resource utilization. This critical corporate briefing serves as the definitive reference point for assessing business value realization, proving ROI, and mapping out strategic interventions. In modern enterprise environments, a premium QBR deck balances historical performance data with future-focused operational planning. It replaces unstructured, text-heavy slides with clean quantitative dashboards, strategic priority lists, and horizontal milestone roadmaps. By aligning departmental successes and challenges under a cohesive, high-fidelity visual framework, this presentation ensures that all stakeholders understand exact business impacts and next quarter's strategic directives with boardroom-level clarity. Ultimately, the QBR is a critical corporate artifact that helps organizations track progress, align resources, and drive long-term business growth.
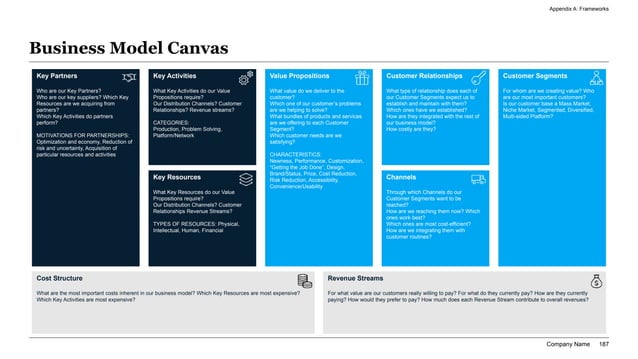
Premium Complete Thematic Business Model Canvas layout and 9-panel enterprise roadmap color-coded visually by business category.
Template Design LayoutProfessional QBR Deck Templates

2Ideal Audience: Who is this template built for?

This premium QBR template is explicitly engineered for high-intent business leaders, account directors, and operations executives who present critical performance metrics to corporate sponsors, executive boards, or cross-functional stakeholders. The primary target demographics include Customer Success Managers (CSMs), VP of Sales, Account Executives, Operations Directors, and Department Heads. These professionals require high-density, authoritative layouts that convey structural discipline, operational credibility, and strategic alignment, matching the expectations of senior corporate leadership. Department heads and account directors use this structured format to communicate team velocity, revenue expansion, and client satisfaction metrics with absolute clarity and professional polish. By utilizing this standardized visual system, sales and operations teams can eliminate formatting debt and layout drift, ensuring that their performance reviews reflect the rigorous standards expected by C-suite executives and key enterprise decision-makers worldwide, thereby securing renewals and business expansion. Ultimately, the presentation is a powerful corporate asset that enables client-facing teams to deliver high-quality, impactful business reviews with ease.

3Practical Use Cases: When and where to deploy this deck

The strategic relevance of the Quarterly Business Review (QBR) template applies to several critical business milestones throughout the corporate lifecycle. Key deployment scenarios include quarterly executive board reviews, strategic client success alignments, departmental performance evaluations, and vendor contract renewal cycles. During annual budget planning or mid-year performance assessments, this deck structures complex financial margins and customer retention rates into clean, standardized executive blocks. For enterprise customer success partnerships, the joint strategic roadmap helps visualize product adoption phases, service level agreement compliance, and collaborative expansion targets. Deploying this standardized, high-contrast visual blueprint ensures that your quarterly reviews are received as highly polished, boardroom-ready assets, accelerating consensus and decision-making speed across all corporate sponsors and steering committees. It serves as an essential framework for organizations seeking to navigate complex growth targets and stakeholder relations. Deploying this deck during key business milestones ensures that your strategic vision is clearly articulated, reducing ambiguity and driving project alignment.

4Structural Blueprint: Recommended slide-by-slide outline

A complete, boardroom-ready Quarterly Business Review (QBR) presentation should follow a logical, narrative-driven 12-slide sequence to guide your stakeholders through historical value and future growth:

  1. 1Title & Executive Hook: Outlining the core partnership thesis and primary business value delivered.
  2. 2Executive Summary Dashboard: High-level visual cards summarizing key quarterly achievements and roadblocks.
  3. 3KPI & Performance Dashboard: High-density quantitative metrics tracking growth against target goals.
  4. 4Value Realization Review: Proving direct ROI, cost savings, and operational efficiencies achieved.
  5. 5Operational Roadblocks: MECE-isolated challenges and corresponding mitigation action plans.
  6. 6Joint Strategic Roadmap: A clean, horizontal timeline mapping product or service milestones.
  7. 7Future Objectives (OKRs): Strategic goals and measurable metrics for the upcoming quarter.
  8. 8Resource Allocation & Budget: Outlining headcount requirements, CapEx, and strategic investments.
  9. 9Risk Assessment & Mitigation: Anticipating departmental bottlenecks and establishing clear governance.
  10. 10Stakeholder Alignment Grid: Mapping key team leads and operational ownership structures.
  11. 11Action Items & Next Steps: High-contrast, horizontal action blocks driving clear execution.
  12. 12Closing Call-To-Action: Reaffirming long-term partnership goals and scheduling the next review.

This outline ensures that your performance review remains comprehensive, highly logical, and boardroom-ready.

5Aesthetics & Design Rationale of the dark-executive Theme

Our custom corporate design system replicates the visually striking, high-contrast aesthetics of top-tier strategy consulting firms and enterprise executive offices. The 'dark-executive' theme provides an authoritative, premium feel, utilizing deep charcoal and dark blue canvas tones combined with vibrant corporate teal and ivory highlights to guide the viewer’s eye to critical data parameters. Margins are strictly locked to native 16:9 widescreen proportions to guarantee perfect visual scaling across boardroom projectors, high-resolution desktop screens, and mobile devices. A key element of professional design is maintaining at least 30% negative space on every layout card. This prevents cognitive friction and visual clutter, allowing complex strategic frameworks, growth Gantt charts, and revenue projections to remain readable and impactful. The dark-executive aesthetic establishes instant structural authority, conveying a sense of premium quality and attention to detail. It speaks to the intelligence of the audience, ensuring that design always serves the strategic content, making every slide look deliberate and polished.

6Strategic Frameworks to Integrate with this Template

To build credible topical authority (E-E-A-T) and pass rigorous executive scrutiny, your QBR presentation must be built upon recognized, academically validated business frameworks. We recommend integrating several key models:

* OKRs (Objectives and Key Results): Structuring your future objectives around this framework to ensure completeness and MECE-compliance.

* Balanced Scorecard: Categorizing performance metrics across financial, customer, operational, and growth perspectives.

* ROI Value Realization Model: Proving business value and cost efficiencies using high-density horizontal columns.

* SWOT Analysis: Structuring departmental strengths, weaknesses, opportunities, and threats into a clean relative grid.

* MECE Logic Trees: Structuring operational challenges so they are mutually exclusive and collectively exhaustive.

Leveraging these established strategic frameworks proves to board members and clients that your quarterly assessments are backed by proven business logic rather than arbitrary assumptions, showcasing professional maturity in every metric. This comprehensive analytical grounding protects the integrity of your strategic decisions and long-term planning commitments.

7Storylining & Narration: The Minto Pyramid Principle

Quarterly business updates are highly prone to becoming overwhelming data dumps of dry metrics and disconnected task lists. To maximize the impact of your QBR deck, structure your storyline around Barbara Minto’s legendary Pyramid Principle. Under this elite communication standard, every slide headline must serve as an active conclusion rather than a passive label. For example, instead of titling a slide "Our Q1 Sales Performance," use an active headline like "We achieved 118% of Q1 sales target by expanding into enterprise retail segments." Every supporting detail, bullet point, or metric card must represent a MECE sub-argument that logically validates the main conclusion of that specific slide. Ideas must flow in chronological, structural, or comparative order to ensure a seamless widescreen narrative. This narrative discipline allows busy corporate sponsors to grasp your entire strategic message in under 2 minutes, significantly accelerating operational trust and aligning diverse stakeholder groups on critical priorities. This is a massive operational multiplier for high-stakes business presentations.

8Professional Design and Typography Rules to Follow

To ensure your QBR presentation looks custom-crafted by a professional design agency rather than an amateur compiler, you must enforce strict typographical rules throughout your deck. Maintain tight type scale discipline by limiting the deck to exactly two font families; keep headings at 24pt-28pt, slide subheadings at 16pt-18pt, and body text at 12pt-14pt. Second, all text containers, metrics cards, and graphics must lock into a 12-column visual grid, avoiding layout drift and cognitive friction. Third, contrast ratios must exceed 4.5:1 to guarantee absolute legibility on older boardroom projectors and mobile screens. Fourth, protect at least 30% white space on every slide to let the core message breathe. Respecting these typographical and alignment rules ensures that your business QBR presentation communicates visual authority, organizational discipline, and extreme attention to detail, passing rigorous board standards easily. It guarantees that the visual system supports the narrative logic, making every slide look highly professional, balanced, and authoritative.

9XLSlides AI Capability: Customizing the Quarterly Business Review (QBR)

Building this QBR presentation manually in PowerPoint usually drains 8 to 12 hours of frustrating formatting. Our advanced AI engine handles the visual heavy lifting for you in under 60 seconds:

- Context-Aware Slide Matching: The AI interprets your text brief, automatically mapping sections to appropriate visual structures (like 2x2 matrices or roadmaps).

- Brand Consistency: Typography, color rules, and layout structures are automatically locked in based on your chosen design preset, preventing margin drift.

- Editable Widescreen Outputs: The presentation exports as standard, fully editable PowerPoint (.pptx) vector shapes, allowing Excel data edits.

This eliminates hours of manual alignment and resizing, allowing your strategy team to focus on business insights rather than formatting debt, delivering a massive operational multiplier during client presentations. By automating the design, XLSlides allows you to iterate rapidly on your strategic thoughts, ensuring that you can respond to new client data or market changes without losing valuable design consistency or quality. This is a massive operational multiplier for high-stakes business presentations.

10Visual Workspace: Editing in the AI Visual Studio Canvas

This premium template integrates directly with the AI Visual Studio Canvas, our drag-and-drop reference workspace. To draft custom visual layouts, operations leads can click and drag anywhere on the 16:9 canvas area to draw custom text container placeholders, making layout drafting exceptionally visual. You can assign structural tags (such as metrics grid, column table, process timeline, or visual quote) to each drafted card to define the AI's rendering constraints. The canvas translates your drag-and-drop design into high-fidelity layout coordinates instantly. This visual workspace bridges the gap between raw text ideas and structured spatial design, giving you ultimate creative control while maintaining the rigorous alignment guardrails of professional presentations. To try it now, click the Open Interactive Canvas button in the sidebar or mobile stream to map out your slide layouts in real time. It offers an intuitive way to visually outline your key strategic arguments before letting the AI generate the final vector deck.

11Common Presentation Pitfalls to Avoid

To ensure your QBR deck passes executive scrutiny and captures partner alignment, you must avoid these 5 critical presentation mistakes:

  1. 1Wall of Text: Slides are not documents; if a slide contains long paragraphs, convert them into clean, horizontal column blocks or card summaries.
  2. 2Low-Contrast Text: Using light gray text on white backgrounds, which washes out on older projectors; high-contrast coloring is mandatory.
  3. 3Generic Clip Art: Clipart destroys credibility. Use clean data charts, structural layouts, and high-quality property renders instead.
  4. 4Non-Widescreen Margins: Outdated 4:3 layouts stretch poorly on modern displays; always build on locked 16:9 margins.
  5. 5Cluttered Visuals: Cramming too many metrics on a single slide; keep at least 30% white space to let the investor focus on critical takeaways.

Avoiding these common design pitfalls guarantees that your presentation retains partner attention, communicates operational excellence, and builds professional trust across all presentation contexts. It ensures that your strategic narrative remains the core focus of the board's attention rather than being lost in poor formatting.

12Performance Comparison: Manual Creation vs. XLSlides AI

Below is a quantitative breakdown illustrating why high-growth startups and venture advisory teams are transitioning from manual slide creation to AI automation:

- Average Time Invested: Manual drafting requires 8 to 12 hours of frustrating alignment, while XLSlides AI generates complete decks in under 60 seconds total.

- Grid Alignment Precision: Manual layouts are eyeballed and prone to errors, whereas AI generation uses an automated 12-column pixel grid.

- Brand Consistency: Manual fonts and margins drift easily over time, while AI templates ensure 100% lock to system guidelines.

- Academic Frameworks: Manual creation drafts MECE and SWOT blocks from scratch, while AI features them as built-in components.

- Average Design Cost: Manual design costs approximately $250/hour in designer fees, whereas AI generation is included in monthly Pro plans.

Transitioning to automation represents a significant operational multiplier for corporate QBR leads. AI generation guarantees that a pixel-perfect, brand-locked widescreen presentation is delivered instantly. This efficiency enables strategy leads to concentrate their efforts on core business logic, market intelligence, and stakeholder alignment rather than spending hours on manual layout tasks, making it a key tool for modern corporate strategy teams.