Desalination Plant Operational Plan Presentation Template

Stop wasting hours on manual formatting. Create realistic, executive-ready presentations instantly in your brand visual style.

Intake, pretreatment, membrane, and process optimization slides
Energy-per-cubic-meter, recovery, uptime, and quality KPI dashboards
Brine management, maintenance, risk, and operating roadmap visuals

1What a Desalination Operational Plan Needs to Prove

A desalination plant operational plan should prove that the facility can produce reliable water at the required quality, cost, and environmental standard. Leaders need to understand intake conditions, pretreatment design, membrane performance, recovery rate, energy consumption, brine management, chemical use, maintenance requirements, staffing, water quality monitoring, and operating risk. The deck should connect engineering choices to operational outcomes such as cubic meters per day, cost per cubic meter, plant availability, membrane life, and compliance. It should also show how assumptions change under seasonal source-water variability or demand peaks. This gives utility executives, plant managers, developers, EPC teams, infrastructure investors, municipal leaders, industrial customers, environmental stakeholders, maintenance teams, PMOs, and consultants enough evidence to assess water-output reliability, energy efficiency, treatment performance, environmental risk, operating cost, maintenance readiness, and rollout sequencing. The narrative should also define plant owners, process controls, quality gates, environmental obligations, and operating checkpoints for each rollout wave and commissioning gate.
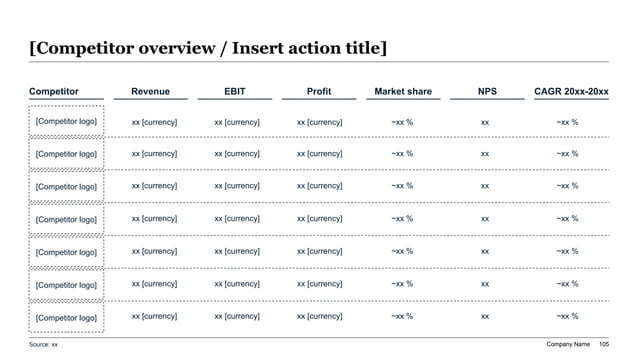
Desalination plant operational plan slide with data-heavy metrics matrix comparing water output, energy use, uptime, cost, and operating performance.
Template Design LayoutDesalination Plant Operational Plan Presentation Template

2Who This Template Is Built For

This template is built for teams that need to present desalination operations in a management-ready format. Typical users include water utility executives, desalination plant managers, operations teams, EPC contractors, infrastructure investors, municipal water planners, industrial water users, energy managers, environmental stakeholders, regulators, and consultants. It is useful when stakeholders must approve commissioning, optimize an existing plant, evaluate expansion, compare operating scenarios, or present a reliability improvement plan. The audience usually needs to see how process design, maintenance, energy, water quality, environmental controls, and cost fit together. This gives utility executives, plant managers, developers, EPC teams, infrastructure investors, municipal leaders, industrial customers, environmental stakeholders, maintenance teams, PMOs, and consultants enough evidence to assess water-output reliability, energy efficiency, treatment performance, environmental risk, operating cost, maintenance readiness, and rollout sequencing. The narrative should also define plant owners, process controls, quality gates, environmental obligations, and operating checkpoints for each rollout wave and commissioning phase.

3Source Water, Intake, and Pretreatment Strategy

The source-water section should define the operating conditions that shape plant performance. It should cover seawater or brackish water quality, temperature, salinity, turbidity, algae risk, seasonal variability, industrial discharge exposure, intake location, screening, pumping, and pretreatment requirements. Pretreatment pages can describe filtration, coagulation, dissolved air flotation, cartridge filters, chemical dosing, or other steps needed to protect membranes and stabilize throughput. The deck should show how intake and pretreatment choices reduce fouling, improve uptime, and control chemical consumption. This is important because desalination problems often begin before water reaches the membrane train. This gives utility executives, plant managers, developers, EPC teams, infrastructure investors, municipal leaders, industrial customers, environmental stakeholders, maintenance teams, PMOs, and consultants enough evidence to assess water-output reliability, energy efficiency, treatment performance, environmental risk, operating cost, maintenance readiness, and rollout sequencing. The narrative should also define plant owners, process controls, quality gates, environmental obligations, and operating checkpoints for each rollout wave.

4Membrane, Recovery, and Process Performance

The process performance section should explain how the desalination system converts source water into product water. It should cover membrane configuration, pressure, recovery rate, permeate flow, salt rejection, scaling risk, cleaning frequency, chemical dosing, post-treatment, and remineralization. The deck should show baseline and target performance for water output, conductivity, boron or other relevant constituents, pressure drop, normalized permeate flow, and membrane aging. It should also identify the operational tradeoffs between higher recovery, membrane stress, energy use, and brine concentration. Strong process pages give leaders confidence that production targets are connected to measurable operating controls. This gives utility executives, plant managers, developers, EPC teams, infrastructure investors, municipal leaders, industrial customers, environmental stakeholders, maintenance teams, PMOs, and consultants enough evidence to assess water-output reliability, energy efficiency, treatment performance, environmental risk, operating cost, maintenance readiness, and rollout sequencing. The narrative should also define plant owners, process controls, quality gates, environmental obligations, and operating checkpoints for each rollout wave.

5Energy Use, Cost, and Optimization Levers

Energy intensity is one of the largest desalination operating drivers, so the deck should show power use clearly. Useful metrics include kilowatt-hours per cubic meter, pump efficiency, energy recovery device performance, peak demand exposure, renewable energy share, tariff assumptions, and energy cost per unit of water. Optimization pages can address pressure management, energy recovery, membrane cleaning, process automation, load shifting, storage, renewable integration, and demand forecasting. A metrics matrix can compare operating scenarios across energy use, output, cost, reliability, and environmental impact. Finance and operations stakeholders need to understand which levers are controllable and which depend on external energy markets. This gives utility executives, plant managers, developers, EPC teams, infrastructure investors, municipal leaders, industrial customers, environmental stakeholders, maintenance teams, PMOs, and consultants enough evidence to assess water-output reliability, energy efficiency, treatment performance, environmental risk, operating cost, maintenance readiness, and rollout sequencing. The narrative should also define plant owners, process controls, quality gates, environmental obligations, and operating checkpoints for each rollout wave.

6Water Quality, Compliance, and Monitoring

The water quality section should show how product water will meet required standards over time. It should cover salinity, conductivity, pH, turbidity, microbial risk, residual chemicals, remineralization targets, taste considerations, industrial specifications, and testing cadence. Monitoring pages should define sensors, lab tests, sampling points, alert thresholds, corrective actions, reporting obligations, and accountability for quality excursions. If the plant serves drinking water, public trust and compliance evidence are especially important. If the plant serves industrial users, specifications may focus on process compatibility and continuity. The deck should make quality assurance visible from intake through final distribution. This gives utility executives, plant managers, developers, EPC teams, infrastructure investors, municipal leaders, industrial customers, environmental stakeholders, maintenance teams, PMOs, and consultants enough evidence to assess water-output reliability, energy efficiency, treatment performance, environmental risk, operating cost, maintenance readiness, and rollout sequencing. The narrative should also define plant owners, process controls, quality gates, environmental obligations, and operating checkpoints for each rollout wave.

7Brine, Environmental Controls, and Permitting

Environmental sections should explain how the plant manages concentrate, chemical residuals, intake impacts, and discharge obligations. The deck should cover brine volume, salinity, discharge location, dilution, marine impact, chemical handling, sludge disposal, monitoring, reporting, and permit requirements. It should also address intake screens, entrainment, impingement, noise, land use, carbon intensity, and community concerns where relevant. Environmental controls should be presented as part of the operating model rather than a separate compliance appendix. A credible plan shows how production targets will be achieved without creating unmanaged ecological or permitting risk. This gives utility executives, plant managers, developers, EPC teams, infrastructure investors, municipal leaders, industrial customers, environmental stakeholders, maintenance teams, PMOs, and consultants enough evidence to assess water-output reliability, energy efficiency, treatment performance, environmental risk, operating cost, maintenance readiness, and rollout sequencing. The narrative should also define plant owners, process controls, quality gates, environmental obligations, and operating checkpoints for each rollout wave.

8Maintenance, Staffing, and Reliability Model

The maintenance section should describe how the plant will sustain availability after commissioning. It should cover preventive maintenance, membrane cleaning, pump inspection, valve and instrumentation checks, spare-parts strategy, chemical supply, operator training, control-room coverage, vendor support, and outage planning. Reliability pages should track plant availability, forced outages, membrane replacement, equipment failures, maintenance backlog, and mean time to repair. The deck should also define escalation paths for production shortfalls or quality excursions. Desalination assets are capital intensive, so leaders need to see that operating discipline protects throughput and asset life. This gives utility executives, plant managers, developers, EPC teams, infrastructure investors, municipal leaders, industrial customers, environmental stakeholders, maintenance teams, PMOs, and consultants enough evidence to assess water-output reliability, energy efficiency, treatment performance, environmental risk, operating cost, maintenance readiness, and rollout sequencing. The narrative should also define plant owners, process controls, quality gates, environmental obligations, and operating checkpoints for each rollout wave.

9KPI Dashboard and Operating Scorecard

The KPI section should translate plant operations into a scorecard leadership can review regularly. Useful metrics include production volume, recovery rate, energy per cubic meter, product water quality, membrane pressure drop, normalized flow, chemical consumption, plant availability, unplanned downtime, brine compliance, maintenance backlog, cost per cubic meter, safety incidents, and customer supply reliability. The dashboard should show baseline, target, trend, owner, and decision trigger for each metric. It should also distinguish between daily operating controls and executive indicators. A clear scorecard helps teams identify whether performance issues come from source water, process control, equipment condition, staffing, energy cost, or environmental constraints. This gives utility executives, plant managers, developers, EPC teams, infrastructure investors, municipal leaders, industrial customers, environmental stakeholders, maintenance teams, PMOs, and consultants enough evidence to assess water-output reliability, energy efficiency, treatment performance, environmental risk, operating cost, maintenance readiness, and rollout sequencing. The narrative should also define plant owners, process controls, quality gates, environmental obligations, and operating checkpoints for each rollout wave.

10Operational Roadmap and XLSlides Workflow

The operational roadmap should sequence desalination work through source-water characterization, intake readiness, pretreatment validation, membrane commissioning, energy optimization, quality monitoring, maintenance setup, environmental compliance, operating stabilization, and continuous improvement. Early waves should focus on proving throughput, quality, and reliability under controlled conditions. Later waves can optimize energy use, extend membrane life, improve automation, expand capacity, and strengthen environmental reporting. XLSlides helps teams convert plant data, process diagrams, equipment assumptions, KPI targets, environmental requirements, maintenance plans, and operating risks into a structured operational deck. The generated output gives teams a strong working draft that can be refined with engineering signoff, site data, permit conditions, and named operating owners. This gives utility executives, plant managers, developers, EPC teams, infrastructure investors, municipal leaders, industrial customers, environmental stakeholders, maintenance teams, PMOs, and consultants enough evidence to assess water-output reliability, energy efficiency, treatment performance, environmental risk, operating cost, maintenance readiness, and rollout sequencing. The narrative should also define plant owners, process controls, quality gates, environmental obligations, and operating checkpoints for each rollout wave.