Demand Generation Funnel Review Presentation Template

Stop wasting hours on manual formatting. Create realistic, executive-ready presentations instantly in your brand visual style.

Funnel conversion and leakage diagnostic layouts
Channel ROI, CAC payback, and pipeline quality dashboards
Growth experiment prioritization and 90-day roadmap slides

1What a Demand Generation Funnel Review Needs to Prove

A demand generation funnel review is not a campaign performance recap. It is an executive operating document that explains whether marketing investment is creating enough qualified pipeline at an acceptable cost and speed. The deck should answer five questions: which channels are producing valuable demand, where the funnel leaks, whether leads convert into sales-accepted pipeline, whether customer acquisition cost is economically sound, and which growth actions should be funded next. A strong opening slide states the overall funnel diagnosis, the pipeline gap, the largest conversion bottleneck, and the decisions required from leadership. This keeps the meeting focused on tradeoffs instead of isolated metrics. The presentation should connect marketing activity to revenue impact, sales capacity, budget allocation, and operating priorities so executives can act on the numbers. It should also distinguish controllable funnel issues from market timing, seasonality, or sales capacity constraints. That distinction matters because the recommended action changes depending on whether the issue is message, channel, capacity, or market demand.
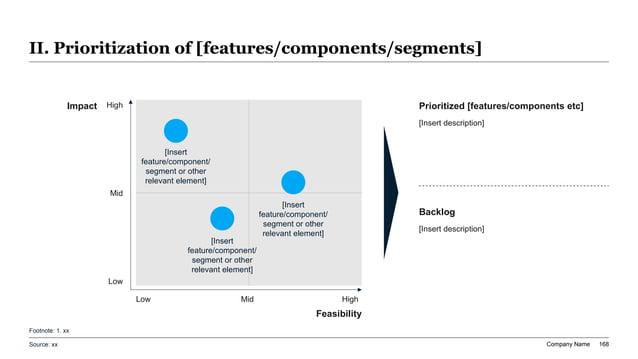
Consulting-style impact versus feasibility matrix with bubble priorities and a dark-blue wedge for demand generation experiment scoring.
Template Design LayoutDemand Generation Funnel Review Presentation Template

2Who This Demand Review Template Is Built For

This template is designed for revenue leaders who need demand generation performance to stand up in operating reviews, board updates, and quarterly planning meetings. Typical users include CMOs, VP Demand Generation, growth leaders, revenue operations teams, marketing analytics owners, sales leaders, founders, and management consultants supporting commercial productivity work. It is especially useful when teams have many data sources but no single storyline: paid media dashboards, CRM stages, campaign reports, website analytics, sales acceptance data, and finance budget files. The audience usually wants to know whether spend should increase, shift, pause, or be tied to new experiments. The deck therefore translates marketing metrics into business decisions, which is more useful than reporting clicks, leads, or impressions in isolation. It also helps sales and marketing agree on definitions before debating performance. That shared language is essential when leadership is comparing demand investment against product, sales, or customer success capacity. It keeps accountability clear.

3Recommended Slide Flow for a Funnel Review

A decision-ready demand generation review usually follows a ten-slide flow:

- Slide 1: Executive diagnosis with pipeline gap, funnel health, and decisions required.

- Slide 2: Demand targets versus actuals by month, segment, and source.

- Slide 3: Full-funnel conversion from visitor to lead, MQL, SQL, opportunity, closed-won revenue.

- Slide 4: Channel performance matrix comparing volume, quality, cost, and conversion.

- Slide 5: Pipeline quality analysis by segment, persona, deal size, and sales acceptance.

- Slide 6: CAC, payback, and budget efficiency view for finance and leadership.

- Slide 7: Sales handoff and SLA analysis showing follow-up speed, rejection reasons, and recycle rules.

- Slide 8: Root-cause assessment for the top two or three funnel bottlenecks.

- Slide 9: Experiment prioritization matrix with expected impact, effort, risk, and owner.

- Slide 10: 90-day roadmap with budget asks, operating changes, and success metrics.

This sequence moves from diagnosis to economics to action.

4Funnel Conversion and Leakage Analysis

The core page in a demand review is the funnel conversion diagnostic. Leadership should see how prospects move through each stage and where quality or volume deteriorates. Useful stages include website visitor, content conversion, raw lead, MQL, sales accepted lead, SQL, opportunity, proposal, closed-won revenue, and expansion where relevant. The slide should show both count and conversion rate, because volume alone can hide quality problems. For example, paid search may create many leads but weak SQL conversion, while partner webinars may create fewer leads with stronger pipeline. A credible deck also compares current conversion rates with prior period, target, and benchmark where available. The goal is to identify the specific stage that deserves action, such as landing page conversion, lead scoring, SDR follow-up, qualification criteria, or opportunity progression. Each leakage point should have an owner, hypothesis, and next test. Showing the next test keeps the review forward-looking instead of only explaining last month's miss.

5Channel ROI and Budget Allocation Logic

Executives will not fund demand generation unless the channel economics are visible. A strong channel ROI slide compares spend, leads, MQLs, SQLs, opportunities, pipeline, revenue, CAC, payback period, and sales cycle by source. Channels should be grouped into paid search, paid social, organic search, content, events, webinars, partners, outbound, review sites, and lifecycle programs where relevant. The analysis should avoid over-crediting top-of-funnel channels without showing downstream quality. If attribution is imperfect, state the attribution model and its limitations. The point is to help leadership decide where budget should move next. A clean page might show which channels to scale, fix, test, or reduce. This makes the funnel review a capital allocation discussion rather than a defensive report on marketing activity. Include confidence levels where sample sizes are small or sales cycles are long. This prevents overreaction to noisy data while still forcing clear budget choices. It also protects high-potential tests.

6Pipeline Quality and Sales Acceptance

Demand generation performance depends on whether sales accepts and progresses the pipeline. The deck should show not only how many leads marketing creates, but whether those leads match the ICP, reach the right buying committee, and convert into serious opportunities. Useful quality measures include sales acceptance rate, lead rejection reasons, meeting show rate, opportunity creation rate, average contract value, persona fit, account fit, disqualification reason, and stage-two conversion. Sales feedback should be summarized in structured categories rather than anecdotal comments. For example, rejection reasons might include wrong company size, no budget, student or vendor inquiries, weak urgency, poor region fit, or duplicate contacts. This section is where marketing and sales align on whether the issue is demand quality, scoring, routing, messaging, or follow-up discipline. A good slide names the fixes required on both sides of the handoff. It should also document which rejection categories will be monitored in the next review.

7CAC Payback and Growth Economics

A board-ready demand generation review should connect pipeline activity to economic discipline. Finance and executive teams usually want to understand customer acquisition cost, payback period, contribution margin, average contract value, conversion assumptions, and the revenue timing implied by current pipeline. The slide should separate leading indicators from actual economics so the team does not mistake pipeline creation for revenue. For subscription businesses, show how CAC payback changes by segment, channel, and contract size. For enterprise sales, include sales cycle assumptions and probability-weighted pipeline. This economic view helps leadership decide whether to scale spend, shift budget toward higher-quality segments, or pause channels that look efficient at lead level but weak at opportunity level. The best demand reviews make growth ambition and financial control visible on the same page. They also state where assumptions are directional and where finance has validated the model. That clarity makes budget recommendations easier to defend. It reduces circular debate.

8Experiment Prioritization and Roadmap Design

Demand teams usually have more ideas than budget or execution capacity. The review deck should convert analysis into a prioritized experiment roadmap. A simple impact-versus-feasibility matrix works well: score each initiative by expected pipeline impact, cost, speed, confidence, operational complexity, and dependency risk. Examples might include landing page testing, new comparison content, pricing page retargeting, webinar sequences, partner campaigns, outbound account plays, lifecycle nurture, or lead scoring changes. The roadmap should separate quick wins from strategic builds. Quick wins can improve conversion or sales handoff within weeks, while larger initiatives may require content production, data cleanup, integrations, or sales enablement. Showing owners, milestones, and success metrics ensures the funnel review ends with action rather than more diagnosis. The roadmap should also state which tests will be stopped if early evidence is weak. This keeps the growth agenda disciplined instead of turning every idea into a standing project. It makes capacity tradeoffs explicit.

9Common Pitfalls in Demand Generation Reviews

The first mistake is reporting top-of-funnel volume without showing downstream conversion or pipeline quality. The second is presenting channel performance without spend and payback, which prevents real budget decisions. Third, teams often blame lead quality without showing sales follow-up speed, rejection reasons, or SLA adherence. Fourth, many decks combine segments with very different buying behavior, which hides where the real funnel problem sits. Fifth, experiment roadmaps are often too broad, listing every possible growth idea instead of a funded sequence with owners and metrics. A strong demand review avoids these traps by using one source of truth, separating volume from quality, connecting marketing to revenue economics, and making explicit decisions about budget, operating changes, and next experiments. It should also avoid vanity metrics unless they clearly predict pipeline. The final page should make leaders confident that the team knows what to change next. Every recommendation needs an owner and deadline.

10Prompt Recipe for Better Demand Review Outputs

High-quality XLSlides outputs depend on prompts that specify the funnel stages, business model, revenue audience, and decision need. A strong recipe is: `Build an executive demand generation funnel review deck for a B2B SaaS company. Audience: CEO, CRO, CMO, CFO, and VP Sales. Include monthly demand targets versus actuals, visitor-to-lead-to-MQL-to-SQL-to-opportunity conversion, channel ROI by source, pipeline quality by ICP segment, sales acceptance and rejection reasons, CAC payback assumptions, top funnel bottlenecks, experiment prioritization matrix, and a 90-day growth roadmap.` Add your segment definitions, stage names, target accounts, campaign channels, and budget constraints so the first draft matches the actual GTM system. Ask for action-title headlines and compact KPI dashboards to keep the output executive-ready. If your CRM stages differ, name them directly so the deck mirrors your reporting language. Include the decision audience so the tone matches an operating review rather than a tactical campaign update. Specificity improves layout selection.

11How XLSlides Helps Build Funnel Reviews Faster

Demand generation reviews are slow to build because the data lives across analytics tools, ad platforms, CRM reports, spreadsheets, campaign calendars, and sales feedback notes. The analysis still requires human judgment, but the slide production work is repetitive: funnel waterfalls, KPI scorecards, channel matrices, conversion tables, and experiment roadmaps. XLSlides helps teams generate a structured first draft from the review brief, then refine the metrics and assumptions in PowerPoint. This is useful for weekly revenue meetings, monthly operating reviews, board updates, and quarterly planning. Instead of spending hours formatting charts, marketing and revenue operations teams can focus on interpreting the funnel, aligning with sales, choosing experiments, and defending budget decisions. The result is a cleaner leadership conversation and a reusable review format. Teams can refresh the same structure as pipeline targets, channel mix, and conversion assumptions change. Over time, that consistency makes trend interpretation faster and more reliable. It also reduces preparation churn.