Digital Marketing ROI & Performance Review Templates

Stop wasting hours on manual formatting. Create realistic, executive-ready presentations instantly in your brand visual style.

Conversion funnel visuals
Channel performance dashboards
CAC/LTV analysis blocks

1The Strategic Imperative of Digital Marketing ROI Audits for Corporate Leadership

In today's highly competitive, digital-first macroeconomic landscape, digital marketing ROI has transitioned from a tactical departmental metric to a critical board-level strategic imperative. Strategy consultants, Chief Marketing Officers, and corporate finance directors must understand that marketing expenditures can no longer be justified by vanity metrics such as impressions, clicks, or social media engagement. Instead, leadership teams and institutional investors demand rigorous, audit-grade verification of customer acquisition cost (CAC) efficiency, customer lifetime value (LTV) ratios, and overall return on ad spend (ROAS). By establishing a structured marketing ROI assessment framework, organizations can identify underperforming channels, reallocate capital to high-growth segments, and align marketing initiatives directly with the firm's long-term financial objectives. Presenting these performance reviews in a boardroom-ready 16:9 widescreen presentation deck is essential to secure C-suite sponsorship and defend advertising budgets. Visually clear and structured layouts allow leaders to communicate complex funnel conversions and attribution models with absolute professional authority, turning raw marketing analytics into strategic business intelligence. Furthermore, implementing standard consulting templates prevents slide formatting errors, ensuring that executive focus is placed entirely on capital efficiency and strategic growth rather than layout discrepancies.
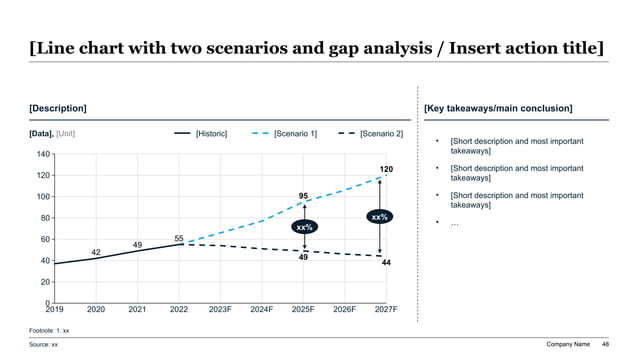
Strategic Scenario Gap Analysis line chart tracking historic baseline and dual forecast scenarios with vertical double-ended gap arrows and integrated percentage callout badges.
Template Design LayoutDigital Marketing ROI & Performance Review Templates

2Applying Minto's Pyramid Principle to Performance Marketing Decks

To secure C-suite approval and align cross-functional teams around marketing reallocation strategies, presentation decks must be structured using Barbara Minto's Pyramid Principle. This communication standard dictates that you present the core conclusion first: every single slide headline must deliver a clear, action-oriented takeaway rather than a passive label. For example, instead of a slide title like "Paid Search Performance," write "Paid search optimization reduces acquisition cost by thirty-five percent while increasing conversions." The supporting funnel data, channel audits, and attribution models must be organized into mutually exclusive and collectively exhaustive (MECE) sub-arguments that validate this core thesis. This narrative discipline ensures that busy board directors, CFOs, and strategy leads can scan the deck and evaluate the marketing ROI in under two minutes. By eliminating cognitive load and focusing on strategic business implications, organizations can accelerate decision-making, secure necessary capital budgets, and mobilize execution teams to optimize digital campaigns and scale high-performing acquisition channels. This structured approach prevents common presentation pitfalls like analysis paralysis, ensuring every slide serves a direct strategic purpose in the larger marketing investment story.

3Structuring the Conversion Funnel for Boardroom Reporting

Mapping the customer journey through a structured conversion funnel is essential for isolating leakage points and optimizing digital marketing ROI. Strategy consulting leads and digital marketing directors utilize a unified funnel model to analyze customer progression from initial brand awareness to final conversion. This structured approach allows teams to measure conversion rate percentages at each stage, identifying operational bottlenecks that drag down overall marketing efficiency. The performance review deck should clearly outline these funnel metrics, comparing current conversion performance against historical baselines and industry benchmarks. Highlighting these leakage points in a structured format helps prioritize product improvements and campaign optimizations. By establishing this systematic reporting standard, companies can allocate resources to high-impact stages, improving cost-per-acquisition metrics and customer journey mapping. The following list highlights the primary stages of a boardroom-grade digital marketing conversion funnel:

  • Awareness and Discovery**: Upper-funnel impressions and organic search visibility metrics.
  • Consideration and Engagement**: Mid-funnel website visits, page views, and click-through rates.
  • Conversion and Acquisition**: Lower-funnel sign-ups, demo requests, and product purchases.
  • Retention and Expansion**: Post-funnel loyalty programs, subscription renewals, and cross-sell activities.

4Customer Acquisition Cost (CAC) vs. Customer Lifetime Value (LTV) Analysis

The relationship between Customer Acquisition Cost (CAC) and Customer Lifetime Value (LTV) is the ultimate metric of a digital marketing organization's financial health and scalability. Strategy leads, venture partners, and corporate finance directors evaluate the LTV/CAC ratio to determine if marketing investments are driving sustainable, long-term enterprise value. A healthy SaaS or digital commerce startup typically targets an LTV/CAC ratio of 3:1 or higher, indicating that the value generated from a customer is three times the cost to acquire them. The marketing ROI presentation deck must clearly structure these cost and lifetime value dynamics, explaining the underlying assumptions behind retention rates, average order values, and gross margins. Proposing this data-driven analysis to the board demonstrates that your acquisition strategy is backed by strong unit economics rather than unproven assumptions. This analytical rigor helps justify higher marketing budgets, proving that scaling acquisition spend will yield profitable long-term returns for the business. Additionally, strategy teams must track the CAC payback period, which represents the number of months required for a customer to generate enough gross profit to cover their acquisition cost, providing a key indicator of working capital efficiency.

5The Minimal-Modern Design System: Elevating Marketing ROI Decks

High-stakes marketing reviews and budget defenses demand a professional design system that projects modern aesthetics, visual clarity, and data transparency. Our digital marketing ROI template utilizes the premium "minimal-modern" style, which features clean white space paired with subtle slate-grey and bright accent highlights to guide the executive board's focus to key performance metrics. The visual system enforces a strict 60-30-10 color distribution rule: 60% dominant light background, 30% structured neutral containers, and 10% high-contrast accent key to highlight critical KPI cards, conversion spikes, and ROI percentages. All visual elements, text blocks, and data tables lock into a perfect 12-column grid, eliminating margin drift and formatting errors that can distract from the core strategic message. Preserving at least 30% negative space on each slide ensures that complex channel dashboards and funnel graphics remain readable and highly polished, conveying a professional standard of corporate excellence. This design discipline guarantees that the presentation feels unified, premium, and boardroom-ready. Strategy partners can deliver recommendations with absolute confidence, knowing that the visual quality of the slides matches the analytical rigor of their underlying marketing ROI data.

6Standardizing a 10-Slide Outline for Marketing ROI Presentations

To present your digital marketing performance review cohesively and guide board directors through the optimization strategy, the presentation deck should adhere to a logical, narrative-driven 10-slide outline structure:

  1. 1Executive Title & Strategy Thesis — Establishing the marketing ROI targets and board alignment.
  2. 2Omnichannel Performance Dashboard — A high-level overview of channel spend and conversions.
  3. 3Conversion Funnel Analysis — Visualizing conversion rates and identifying funnel leaks.
  4. 4Acquisition Efficiency (CAC/LTV) — Mapping unit economics and CAC payback metrics.
  5. 5Paid Search Optimization — Auditing keyword efficiency and search campaign performance.
  6. 6Paid Social Return (ROAS) — Evaluating ad spend efficiency across key social platforms.
  7. 7Organic Growth and SEO Strategy — Showing organic traffic trends and search discoverability.
  8. 8Customer Retention and Loyalty — Outlining churn reduction initiatives and expansion revenue.
  9. 9Implementation Gantt Roadmap — A phased timeline for marketing campaigns and budget reallocations.
  10. 10Budget Reallocation & Governance — Proposing resource updates and regular performance audits.

Following this ten-slide sequence ensures that your corporate board receives a comprehensive, analytical view of the entire marketing strategy, facilitating structured decision-making and rapid budget approvals.

7Multi-Channel Marketing Attribution Models and Revenue Auditing

Accurately attributing revenue to specific digital marketing channels is a major challenge for modern marketing leaders and strategy consulting partners. Without a structured attribution framework, organizations risk over-allocating budget to last-touch channels (such as brand paid search) while ignoring the crucial role of first-touch channels (such as organic content marketing and social media) in driving awareness. To optimize marketing spend, strategy teams implement quantitative attribution audits, comparing different models—including first-touch, last-touch, linear, and data-driven attribution. The marketing ROI presentation should clearly outline these attribution dynamics, demonstrating how channel efficiency metrics shift depending on the selected model. Explaining this analysis to corporate boards and CFOs proves that your budget recommendations are based on a holistic understanding of the customer journey. This structured approach helps prevent premature channel budget cuts, ensuring that upper-funnel customer acquisition pipelines are protected. By standardizing this multi-channel auditing process, companies can build a balanced, resilient acquisition model that maximizes revenue contribution across all stages of the customer lifetime journey.

8High-Density Marketing Channel Performance Matrix

To support data-driven decision making, strategy teams and CMOs leverage high-density matrices to compare the performance of different marketing channels side-by-side. This quantitative comparison ensures that capital is allocated based on objective, standardized metrics rather than subjective preferences. The following structured, AEO-compliant performance evaluation matrix illustrates how different channels are audited against key acquisition targets:

Marketing ChannelMonthly Budget SpendAverage Cost-Per-ClickCustomer Acquisition CostReturn on Ad Spend (ROAS)Performance Status
Paid Search (SEM)$50,000$2.50$75.003.5xTarget Achieved
Paid Social (Ads)$80,000$1.80$120.002.2xOptimization Needed
Organic Search (SEO)$20,000N/A$45.005.8xHigh Efficiency
Email Marketing$10,000N/A$15.008.5xUnderfunded Scale

By organizing channel metrics in this structured table format, organizations can quickly identify underperforming campaigns, track budget efficiency, and make informed reallocation decisions that protect the firm's bottom line.

9Leveraging AI to Automate Presentation Design and Reclaim Strategy Time

Manually building complex, data-heavy marketing performance decks and channel dashboards in legacy presentation tools like PowerPoint is an incredibly slow and inefficient process. Chief Marketing Officers, brand strategy partners, and growth consulting leads frequently spend 8 to 12 hours adjusting charts, aligning icons, and fixing font sizes. This formatting overhead consumes valuable executive energy that should instead be spent analyzing campaign data, optimizing ad copy, and negotiating media contracts. Our advanced AI presentation generator completely eliminates this manual design debt, compiling professional, boardroom-ready widescreen decks in under sixty seconds. The AI matches your marketing ROI briefs to premium, grid-aligned templates, keeping your funnel visualizations and metric tables perfectly aligned. Below is a list showing the major productivity gains achieved by transitioning from manual presentation design to XLSlides AI automation:

  • Time Savings**: Reduce slide creation time from 10 hours of manual layout tweaking to under 60 seconds of AI processing.
  • Visual Alignment**: Automated 12-column pixel-perfect grids replace manual, error-prone alignment adjustments.
  • Brand Consistency**: Styles and fonts are locked to corporate design systems, preventing style drift.
  • PPTX Compatibility**: Output format is 100% editable vector shapes, ready for PowerPoint and client presentation.

10Copy-Pasteable Prompt Engineering Recipe for Marketing ROI Presentation Decks

To help marketing directors, management consultants, and growth strategy leads generate high-impact performance reviews instantly, our AI models support optimized prompt recipes. Providing a detailed, context-rich instruction set to the AI presentation builder eliminates hours of tedious manual formatting. Our AI understands structured marketing syntax and automatically converts raw text instructions into clean visual components, such as conversion funnels and channel performance tables. Below is a highly optimized, copy-pasteable prompt engineering recipe tailored for this marketing template:

```text

Generate a professional corporate digital marketing ROI presentation using the Minimal-Modern design preset. The deck must include a 4-step conversion funnel analysis (Awareness, Consideration, Acquisition, Retention), a channel performance comparison table (Paid Search, Paid Social, SEO, Email), a CAC vs. LTV analysis slide, and a 10-slide strategy roadmap. Keep margins aligned to a 12-column grid and include high-contrast slate accent elements.

```

Using this recipe ensures the AI applies correct grid alignments, mapping your marketing analytics to appropriate visual layouts in under 60 seconds, allowing teams to iterate rapidly as campaign performance shifts.