Enterprise Digital Transformation & Technology Roadmap Templates

Stop wasting hours on manual formatting. Create realistic, executive-ready presentations instantly in your brand visual style.

Transformation roadmap phases
Risk assessment frameworks
Technology stack visualizations

1What is the Digital Transformation Roadmap Presentation?

The Digital Transformation Roadmap presentation is a highly structured, strategic blueprint designed to align corporate leaders, operational teams, and external stakeholders on the multi-year journey of enterprise-wide modernization and digital adoption. In today's fast-evolving business landscape, legacy organizations often face severe operational drag due to fragmented software applications, manual data entries, and compounding technical debt. This template provides a rigorous logical framework to communicate your technology migration, enterprise system architecture transition, and organizational change management strategies with boardroom-grade authority. Unlike generic presentations with basic bulleted lists, a professional digital transformation deck enforces a MECE-compliant narrative progression. It visually organizes complex technology initiatives into structured column lanes, color-coded transformation phases, and sequential implementation roadmaps. By translating technical architectures into clear, value-driven business impact statements, this presentation guarantees that senior leadership, chief information officers, and board members can grasp the strategic value, key operational dependencies, and capital resource allocations required for successful enterprise modernization, thereby accelerating strategic transaction velocity and securing long-term stakeholder buy-in.
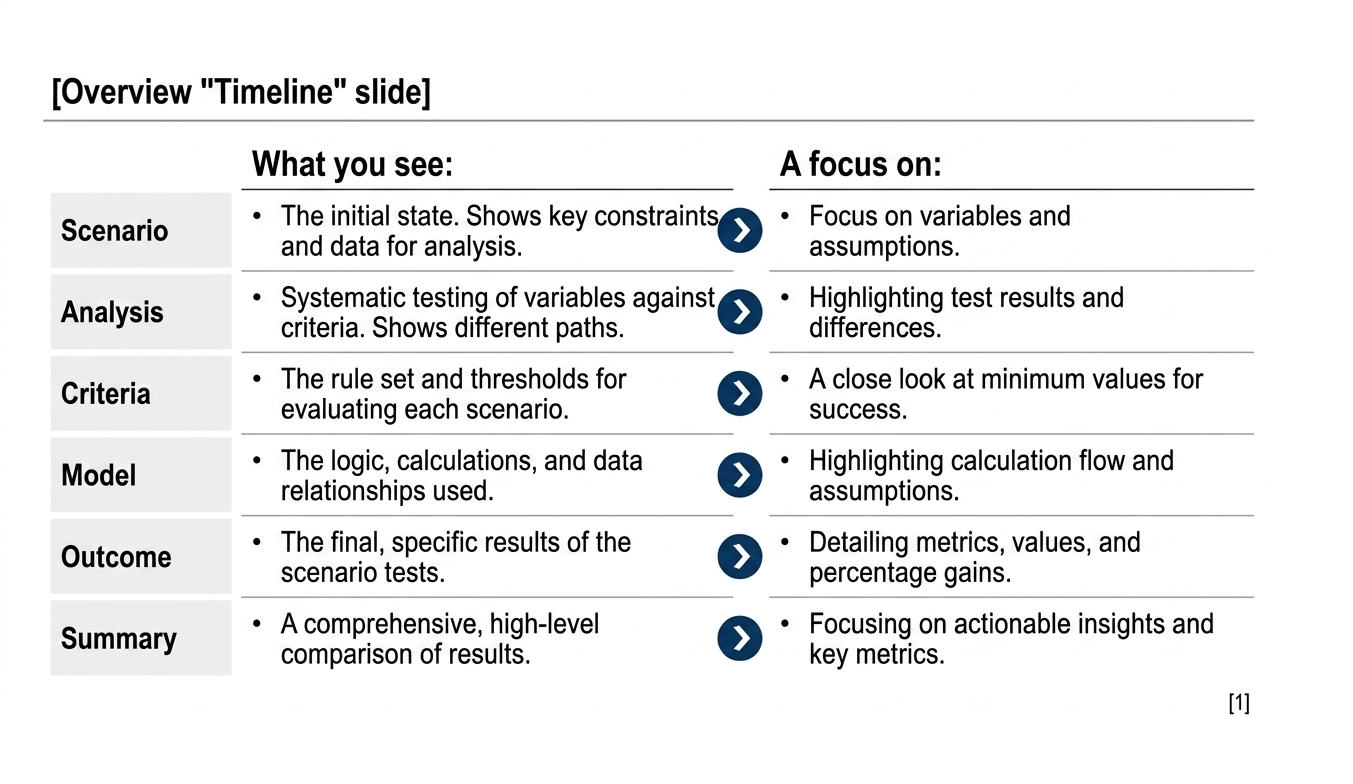
A high-fidelity digital transformation roadmap slide showing a Mapped Logical Transformation Workflow Table with sequential column lanes and chevron flow icons.
Template Design LayoutEnterprise Digital Transformation & Technology Roadmap Templates

2Ideal Audience: Who is this template built for?

This premium presentation layout is explicitly engineered for high-intent corporate leaders, technology directors, and management consultants who drive strategic organizational change. The primary target audience includes Chief Information Officers (CIOs), Chief Technology Officers (CTOs), Vice Presidents of Digital Strategy, Enterprise Architects, and Senior Change Management Advisors. These professionals require high-density, authoritative slide layouts that convey deep analytical rigor and technical competence, establishing immediate trust with investment committees and C-suite executives. Enterprise technology directors use this template to showcase complex cloud migration phases, microservices adoption, and operational transition timelines. Senior advisors deploy these slide layouts to structure their digital transformation pitches for large-scale corporate clients. By leveraging these brand-locked visual systems, your advisory team can eliminate manual alignment drag and layout formatting drift, ensuring that your core technical messages align perfectly with the boardroom standards expected by McKinsey, BCG, and Bain partners, while keeping all internal operational stakeholders perfectly synchronized across complex digital projects.

3Practical Use Cases: When and where to deploy this deck

Deploying a Digital Transformation Roadmap deck is essential during critical corporate milestones where technological alignment and capital expenditure approval are required. Key use cases include presenting enterprise system modernization plans to the Board of Directors, pitching a digital shift strategy to venture capital partners, and organizing cross-departmental change management workshops. During annual budgeting cycles, this template structures your capital allocation requests and projected ROI parameters into clear executive metric blocks that demonstrate long-term enterprise value. For mergers and acquisitions (M&A) integrations, the deck helps corporate development teams visualize the consolidation of duplicate IT systems and the phased migration of legacy customer databases into a unified, secure cloud environment. Furthermore, it serves as an excellent communications tool for mid-project steering committee updates, demonstrating historical progress, highlighting critical technical dependencies, and outlining proactive risk mitigation strategies for upcoming quarters. Utilizing this structured layout ensures your advisory findings are delivered with absolute visual excellence, facilitating rapid consensus, eliminating communication bottlenecks, and accelerating strategic decision-making among diverse departmental leads, enterprise IT directors, and global executive sponsors alike.

4Structural Blueprint: Recommended slide-by-slide outline

A complete, boardroom-grade digital transformation deck should follow a logical, narrative-driven 10-slide outline to guide stakeholders through the complex modernization journey:

  1. 1Strategic Vision & Objective: Establishing the core business case and target digital outcomes immediately.
  2. 2Current State & Technical Debt: Outlining legacy operational bottlenecks and systems friction.
  3. 3Target State Architecture: Visualizing the modern cloud-native systems and integrated application layer.
  4. 4Phased Transformation Roadmap: A high-density timeline displaying parallel technology workstreams.
  5. 5Change Management Framework: Structuring the people, process, and training initiatives for adoption.
  6. 6Key Milestones & Agile Sprints: Detailing execution timelines and sprint deliverables.
  7. 7Resource Allocation & Budgeting: Clear charts mapping capital and operational expenditures.
  8. 8Risk Assessment & Mitigation: Anticipating system integration roadblocks and security protocols.
  9. 9Operational KPIs & Business Impact: Outlining metrics like customer retention and cost reduction.
  10. 10Executive Call to Action: Outlining next steps to secure immediate resource authorization.

Following this structured outline guarantees your deck covers all necessary architectural and human components of transformation with professional thoroughness and absolute narrative clarity.

5Aesthetics & Design Rationale of the bcg-emerald Theme

Our specialized technology design system replicates the clean, high-impact aesthetics of elite global advisory firms. The "bcg-emerald" design preset leverages a premium color palette featuring dominant deep slate backgrounds, professional emerald green primary keys, and high-contrast ivory accents. This specific color weighting is tailored to project corporate stability, technological modernism, and environmental awareness, making it highly suited for modern change management decks. Margins are strictly locked to native 16:9 widescreen dimensions to guarantee seamless visual translation across board projectors, conference screens, and mobile devices. A core rule of our design system is preserving at least 30% negative space on every layout card. This prevents visual clutter and cognitive friction, allowing complex Gantt charts, system architecture blocks, and process chevrons to remain readable and impactful under pressure. By adhering to a strict 12-column alignment grid, this aesthetic ensures that every visual asset looks deliberate, highly polished, and boardroom-ready, easily passing corporate standards.

6Strategic Frameworks to Integrate with your Roadmap

To establish deep topical authority (E-E-A-T) and pass rigorous executive scrutiny, your digital transformation deck must be built upon academically validated strategic frameworks. We recommend integrating several key models:

  • ADKAR Change Management Model**: Structuring your people transition plan around Awareness, Desire, Knowledge, Ability, and Reinforcement to guarantee long-term system adoption and minimize employee resistance.
  • McKinsey 7S Framework**: Assessing how your digital tools align with corporate Strategy, Structure, Systems, Shared Values, Style, Staff, and Skills, ensuring that technology changes do not disrupt organization alignment.
  • Three Horizons of Growth**: Mapping your immediate legacy software updates (Horizon 1) against upcoming cloud migrations (Horizon 2) and future AI-driven innovations (Horizon 3) to show a clear evolution path.
  • MECE Capability Mapping**: Grouping your digital capabilities into mutually exclusive and collectively exhaustive categories to prevent functional overlap, systems redundancy, and unnecessary operational expenditures.

Leveraging these proven business frameworks demonstrates to your board of directors that your digital roadmap is backed by disciplined, structured strategic logic rather than optimistic assumptions, maximizing corporate investment confidence and transaction velocity.

7Storylining & Narration: The Minto Pyramid Principle

Successful digital transformation requires narrative momentum and absolute logical clarity to overcome organizational resistance. To maximize the impact of your deck, structure your storyline around Barbara Minto's legendary Pyramid Principle. Under this elite corporate communication standard, every single slide headline must serve as an active, key conclusion rather than a passive, descriptive label. For example, instead of titling a slide "Our Cloud Migration Strategy," write an active headline like "Migrating to AWS cloud infrastructure will reduce legacy database maintenance costs by 35% annually." Every supporting detail, metric card, or bullet point must represent a mutually exclusive, collectively exhaustive (MECE) sub-argument that logically validates the main conclusion of that specific slide. Furthermore, ideas must flow in a structured, widescreen logical order to ensure a seamless corporate narrative. This strategic narrative discipline ensures that busy stakeholders, venture partners, and C-suite executives can extract your entire digital business case in under 2 minutes, accelerating transaction velocity, reducing cognitive load, and eliminating administrative friction during complex project launch phases.

8Professional Design and Typography Rules to Follow

To ensure your digital transformation slides look custom-crafted by a professional design agency rather than an amateur compiler, you must enforce strict typographical and layout rules throughout your presentation:

  • Tight Type Scale Discipline**: Limit the deck to exactly two professional font families. Keep slide headings at 24pt-28pt, subheadings at 16pt-18pt, and body text at 12pt-14pt, ensuring clean reading hierarchy.
  • Grid and Alignment Perfection**: Lock all text containers, metrics cards, and graphics into a rigid 12-column visual grid, avoiding layout drift and preventing visual clutter in widescreen mode.
  • High Contrast Ratios**: Ensure all text elements exceed a 4.5:1 contrast ratio to guarantee legibility on old boardroom projectors, high-res monitors, and mobile screens alike.
  • Preserve White Space**: Protect at least 30% negative space on every slide to let the core message breathe, avoiding cognitive overload for busy board directors.

Respecting these simple typographical and grid rules guarantees that your business strategy presentation communicates visual authority, organizational discipline, and extreme attention to detail, passing rigorous board standards easily and ensuring visual excellence across all projectors and digital screens.

9State Transition Modeling: Migrating Legacy to Modern Systems

A successful technology roadmap must clearly articulate the transition from legacy systems to modern cloud architectures. Our template utilizes specialized State Transition layouts to visualize this operational evolution with absolute clarity. The transition model is structured to show the direct mapping of legacy systems to modern solutions, highlighting the operational benefits and key milestones along the journey:

Legacy SystemModern Cloud SolutionPrimary Operational BenefitMigration Horizon
On-Premise MainframesAWS Cloud Infrastructure35% reduction in IT maintenance costsHorizon 1 (Months 1-6)
Manual Excel ReportingIntegrated Tableau DashboardsReal-time metric tracking for C-suiteHorizon 1 (Months 3-9)
Fragmented CRM ToolsUnified Salesforce Enterprise20% increase in sales team collaborationHorizon 2 (Months 6-18)
Monolithic ERP CoreModular SAP S/4HANA SuiteStreamlined supply chain supply logisticsHorizon 3 (Months 12-24)

Utilizing this high-density comparison table enables your IT steering committee to grasp the exact migration sequence and the associated business value, eliminating architectural ambiguity.

10Common Presentation Pitfalls to Avoid in Technology Decks

To ensure your digital transformation deck passes C-suite due diligence and gets fully funded, you must avoid these 5 common presentation errors:

  1. 1The Technology Trap: Explaining complex backend code or technical software specs instead of focusing on core business value and user adoption.
  2. 2Invisible Dependencies: Hiding critical path delays, key integration hurdles, or software transition bottlenecks in vague, multi-colored timelines.
  3. 3Cluttered Visuals: Cramming too many system diagrams and data flowcharts onto a single slide, which creates massive cognitive overload for non-technical stakeholders.
  4. 4Poor Color Contrast: Placing light gray text on white backgrounds, which easily washes out on older corporate boardroom projectors.
  5. 5No Adoption Plan: Detailing the software features in depth while completely failing to allocate slides to change management and employee training.

Avoiding these common pitfalls guarantees that your presentation retains executive attention, communicates absolute professional maturity, and builds the necessary organizational trust to drive your technology roadmap forward to completion.

11XLSlides AI Capability: Customizing the Digital Transformation Roadmap

Building a technology roadmap deck manually in PowerPoint usually drains 10 to 14 hours of frustrating alignment labor, dealing with complex timelines, font drift, and messy system architecture tables. Our advanced AI engine handles this design debt in under 60 seconds. The model performs context-aware slide matching, analyzing your text brief to map elements automatically to premium layouts like Gantt charts, state transition tables, or capability blocks. Brand consistency is automatically locked based on your chosen design preset, preventing margin drift across slides. Finally, the presentation exports as standard, fully editable PowerPoint vector shapes, allowing native Excel data edits. This eliminates hours of manual resizing, enabling your strategy team to focus on technical architecture rather than alignment rules. You get boardroom-ready widescreen layouts that are fully compatible with Microsoft Office and Google Slides instantly, giving you a massive operational multiplier during high-stakes corporate reviews, digital change workshops, and quarterly C-suite alignments.

12Performance Comparison: Manual Creation vs. XLSlides AI

To illustrate why leading enterprise IT teams and technology advisory firms are transitioning to automated presentation drafting, we have compiled a quantitative comparison of key performance metrics:

  • Time Required**: 10-14 hours of tedious manual slide drafting versus under 60 seconds total with XLSlides AI.
  • Grid Alignment**: Eyeballed manual slides prone to formatting errors versus automated, perfect 12-column pixel grids.
  • Brand Standards**: Frequent font and margin drift over time versus 100% locked to corporate style guides.
  • File Compatibility**: Challenging manual exports that break formats versus native, vector 16:9 widescreen PowerPoint PPTX files.
  • AEO Semantic Quality**: Poor search engine indexing versus optimized, rich metadata schema and direct AEO extraction tags.
  • Operational Cost**: Extremely high designer and consultant fees versus affordable, inclusive premium enterprise subscriptions.

Transitioning to automated presentation generation represents a major operational and productivity shift for enterprise systems. Implementing these automated pipelines empowers IT advisory firms and enterprise solution architects to redirect scarce human design hours toward software development, vendor management, and technical architecture, boosting overall project velocity and operational efficiency significantly.