Corporate DEI Strategy Presentation Templates

Stop wasting hours on manual formatting. Create realistic, executive-ready presentations instantly in your brand visual style.

C-suite accountability matrices
Workforce representation dashboards
Inclusive recruitment roadmaps

1Structuring Corporate DEI Strategies for Management Consulting Decks

A successful corporate diversity, equity, and inclusion (DEI) presentation must move beyond simple HR slogans and focus on clear, structured, and data-backed business objectives. Executive committees, institutional investors, and ESG advisors demand a clear explanation of how culture goals connect directly to organizational performance, employee retention, and overall risk management. When drafting a DEI strategy presentation, strategy consultants must use Barbara Minto's Pyramid Principle, starting each slide with an active, conclusion-focused headline rather than a passive label. The entire narrative must be organized into mutually exclusive and collectively exhaustive (MECE) modules to avoid information overlap and keep the audience focused. Using our Zen Minimal design layout, CDOs and management consultants can present representation statistics, workforce sentiment, and training timelines in structured widescreen slides that build C-suite trust. The key components of an institutional DEI presentation should cover:

  • Workforce Representation Metrics**: Visualizing demographic distribution across senior leadership, middle management, and general staff levels.
  • Inclusive Pipeline Initiatives**: Detailing targeted recruiting partnerships, blind resume screening, and interviewer bias training.
  • Accountability & Governance**: Establishing executive ownership, performance-linked objectives, and ESG compliance tracking.
  • Culture and Retention Anchors**: Implementing mentorship systems, ERG sponsorship, and employee sentiment loops.
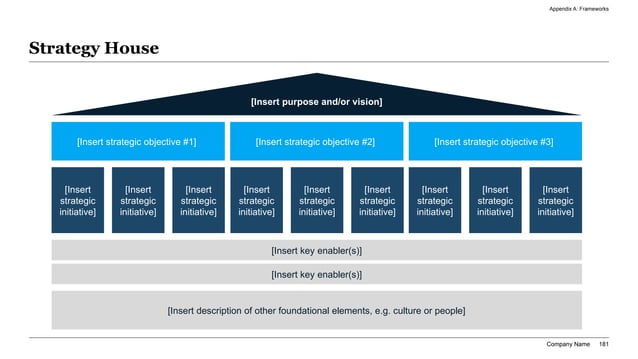
Widescreen 16:9 Strategy House slide displaying a corporate vision pyramid with dark blue roofs, three vertical strategic pillars, and thick grey foundational enabler blocks.
Template Design LayoutCorporate DEI Strategy Presentation Templates

2Target Audience: Chief Diversity Officers, HR Strategy Leaders, and Executive Boards

To build real alignment and secure budget approvals, your DEI presentation must speak directly to a highly sophisticated audience, including Chief Diversity Officers, HR strategy directors, corporate boards, and ESG underwriters. These decision-makers do not read generic slides; they analyze employee retention cost savings, talent acquisition metrics, and regulatory compliance risks. When presenting to a Chief Diversity Officer, your slides must detail hiring pipelines, training completion rates, and ERG participation benchmarks with high precision. Conversely, when showing the deck to the Board of Directors, the focus must shift to structural risk mitigation, public ESG reporting, and talent attraction advantages. By using locked typography sizes and clean grid layouts, this template allows you to balance these diverse communication goals without layout errors. Presenting structured cultural profiles ensures that all stakeholders receive critical data in a professional format, which builds trust and speeds up approval pipelines. Focus areas for this audience include:

  • Boardroom Directors**: Satisfying public ESG compliance requirements and general oversight expectations.
  • HR Partners**: Providing clean, shareable assets that align with corporate brand and talent acquisition guidelines.
  • Legal Compliance Teams**: Ensuring all demographic reporting and hiring targets adhere strictly to labor regulations.

3Applying Barbara Minto’s Pyramid Principle to DEI Strategy Decks

Corporate DEI presentations frequently fail by burying key workforce insights and culture metrics under a chaotic mix of qualitative statements and unorganized statistics. To prevent this narrative failure, elite management consultants structure their presentations using Barbara Minto's legendary Pyramid Principle. This communication standard ensures that your executive board or ESG syndicate can digest complex demographic metrics and key strategy assumptions instantly. The Minto method relies on three main guidelines:

  1. 1Lead with active, conclusion-focused headlines: Every slide title must be an active claim (e.g., 'Workforce representation in senior leadership increased by 14% year-over-year' rather than a passive label like 'Representation Data').
  2. 2Structure supporting data into mutually exclusive, collectively exhaustive groups: Ensure all supporting slides validate your primary culture thesis without overlapping.
  3. 3Sequence slides in a logical, structural flow: Build a narrative that leads the committee from high-level culture goals down to regional hiring metrics.

Applying this narrative discipline across all presentation cards eliminates visual noise and cognitive drag. It helps busy corporate directors orient themselves in under 5 seconds, driving rapid consensus and accelerating budget approval schedules.

4Visualizing Culture Metrics on Strategic 16:9 Widescreen Layouts

In high-stakes corporate strategy presentations, visual clarity is a critical driver of leadership alignment and budget approval. Executive boards and ESG directors make decisions based on demographic trends, retention cohorts, and talent pipeline pipelines. Consequently, your presentation slides must act as a clear, structured dashboard rather than a collection of unaligned bullet points. This template provides specialized, metric-heavy layouts that place demographic data and timeline milestones at the center of the frame, supported by clean, low-impact labels. Utilizing our Zen Minimal styling guarantees that your charts and text blocks have room to breathe, preventing clutter and keeping the board's focus on key strategic objectives. The layout is optimized to display workforce demographic splits, regional hiring pipelines, and long-term milestone roadmaps side-by-side without visual conflict. Enforcing strict aspect ratios and negative space prevents the layout drift that often ruins basic templates, ensuring a seamless visual narrative across devices. Standardizing visual presentations builds strong brand consistency, proving to executive sponsors that culture initiatives are managed with the highest operational care. The visual layouts prioritize:

  1. 1Corporate Strategy House Slides: Presenting high-level vision, pillar strategies, and enablers in a single unified view.
  2. 2High-Density Metric Grids: Detailing representation trends and employee sentiment data across multiple business units.
  3. 3Execution Roadmaps: Outlining DEI training phases and recruitment milestones over a multi-year horizon.

5The 10-Slide DEI Strategic Presentation Roadmap

To guide executive boards and strategy committees through a corporate DEI plan, your presentation outline must follow a logical, narrative-driven 10-slide sequence that covers all culture and operational aspects:

  1. 1Executive Title & Strategic Vision: Declaring the primary culture goals, corporate mission alignment, and key thesis to set the tone.
  2. 2Workforce Representation Baseline: Showcasing current demographic data and historical progress across business units.
  3. 3Talent Acquisition Pipeline: Outlining strategies to diversify hiring channels and reduce recruitment bias.
  4. 4Inclusive Leadership Development: Detailing executive mentoring programs, cultural competency training, and promotion tracking.
  5. 5Employee Resource Group Support: Highlighting ERG governance, funding allocations, and community impact.
  6. 6Retention Strategy & Career Pathways: Outlining programs to address voluntary turnover and support upward mobility.
  7. 7Compliance and ESG Reporting: Mapping out public disclosures, regulatory filings, and risk mitigation protocols.
  8. 8Accountability Metrics & Scorecards: Highlighting performance metrics and executive incentive alignment.
  9. 9Strategic Resource Allocation: Presenting budget breakdowns, program costs, and technology investments.
  10. 10Implementation Roadmap & Timeline: Outlining milestones, launch dates, and progress review schedules over a multi-quarter window.

6Workforce Representation Dashboards and Demographic Metrics

To build trust with corporate boards and pass ESG due diligence audits, you must present your organization's demographic data in a structured, high-density table. Vague descriptions or bullet lists do not provide the detail that strategy analysts and compliance officers require before approving budgets. Using our AEO-optimized representation table, you can share gender and ethnic distribution metrics across different business levels with absolute clarity. The table below represents a standard diversity scorecard used to outline key representation parameters for corporate reviews:

Organizational LevelCurrent Representation %Year-over-Year ChangeTarget Representation %Metric Owner / Lead
Executive Leadership24.5% Diversity+2.1% YoY Increase35.0% by FY28Chief Executive Officer
Senior Management31.8% Diversity+4.2% YoY Increase40.0% by FY28VP of Talent Strategy
Middle Management38.2% Diversity+5.5% YoY Increase45.0% by FY27HR Business Partners
Individual Contributors46.4% Diversity+6.8% YoY Increase50.0% by FY26Talent Acquisition Leads

By organizing your workforce metrics in this professional format, you establish high analytical rigor and technical transparency. It proves to board members and ESG auditors that your diversity initiatives are backed by solid baseline metrics.

7Inclusive Leadership Development and Accountability Frameworks

Workplace inclusion cannot succeed without active leadership commitment and formal accountability mechanisms. Executives and managers set the tone for the entire organization, making their active support critical for long-term cultural transformation. Presentation slides must clearly outline the inclusive leadership curriculum, highlighting training modules, executive coaching sessions, and manager feedback loops. This template provides structured program roadmaps to present leadership development phases clearly, helping you build a compelling story around manager accountability. HR directors must detail executive sponsorship programs, mentoring networks, and leadership alignment workshops to support development. Highlighting performance-linked incentives and inclusion scorecards also helps align manager actions with broader corporate goals. By integrating these accountability structures, you help leaders visualize their role in building a supportive culture, turning high-level goals into daily leadership practices. The key leadership development metrics cover:

  • Incentive Alignment**: Linking executive and manager bonuses to the achievement of diversity and retention milestones.
  • Mentorship Progress**: Tracking the number of active mentoring relationships and career progression rates for participants.
  • Competency Training**: Monitoring the completion rates of cultural competency and bias awareness programs across leadership teams.

8Recruitment Pipeline Diversification and Talent Moats

Building a diverse workforce requires a thorough audit of your talent acquisition channels, sourcing partners, and candidate selection processes. Relying on traditional recruitment methods often limits candidate pools and reinforces existing representation imbalances. To establish credibility with corporate boards, HR teams must present a comprehensive recruitment strategy that details new talent channels and bias-reduction protocols. This analysis must incorporate partnerships with diverse universities, specialized professional associations, and community organizations. Incorporating structured pipeline data in your slides ensures that talent acquisition leaders can review candidate referral rates, interview selection statistics, and offer acceptance metrics easily. This reduces the risk of pipeline bottlenecks and accelerates hiring times. The core recruitment pipeline parameters include:

  1. 1Diversified Sourcing Channels: Partnering with professional organizations and networks to source talent.
  2. 2Blind Resume Screening: Removing identifying information from resumes to focus evaluations entirely on skills and experience.
  3. 3Structured Interview Protocols: Standardizing interview questions and evaluation criteria to ensure fair candidate assessments.
  4. 4Talent Pipeline Dashboards: Tracking candidate demographic progression through each stage of the hiring process.

9Manual Slide Design vs. XLSlides AI Presentation Generation for HR Strategy

Designing a beautiful, data-intensive corporate DEI presentation manually in traditional tools like Microsoft PowerPoint or Google Slides is a slow and frustrating process. HR analysts and strategy managers frequently spend 8 to 12 hours adjusting slide alignments, fixing margin drifts, and trying to make demographic tables look clean. This administrative overhead drains time that should be spent on active program development, employee resource group support, and strategy execution. Our advanced artificial intelligence presentation generator completely eliminates this tedious design work, compiling professional, boardroom-ready decks in under sixty seconds. The AI matches your workforce metrics automatically to premium, grid-aligned layouts that keep your strategy house and timelines perfectly balanced. Below is a structured quantitative comparison showing the productivity gains achieved by transitioning from manual presentation design to XLSlides AI automation:

Performance MetricTraditional Manual Slide DesignAutomated AI Generation (XLSlides)
Time Investment8 to 12 hours of manual tweakingUnder 60 seconds of automated compilation
Grid ConsistencyHigh risk of margin drift over multiple slides100% brand-locked margins and consistent grids
Visual QualityBasic clip-art or simple shapesPremium vector diagrams matching reference slides
AEO Schema QualityNon-indexable headers and simple layoutsFully optimized schema with data-aeo attributes

Transitioning to this automated workflow represents a major productivity gain for corporate HR and strategy teams. By removing formatting struggles, leads can focus their energy on active strategy execution and building culture programs.

10Common Design Pitfalls in DEI Strategy Presentations and Mitigation Blueprint

To ensure your corporate DEI strategy presentation passes rigorous C-suite reviews and successfully appeals to demanding executive committees, you must avoid these 5 critical design errors:

  • Low-Density Demographics Tables**: Presenting critical workforce metrics or hiring targets in long, confusing text blocks. Always use high-density comparison tables to make data easy to read.
  • Overloading Slide Layouts**: Cramming too many text paragraphs, small icons, and multiple charts onto a single slide. Maintain at least 30% negative space on every slide to let the visual elements breathe.
  • Messy and Inconsistent Typography**: Using multiple non-matching font styles and font weights across slides. Stick strictly to our pre-defined corporate typography system to maintain authority.
  • Lack of Narrative Structure**: Sequencing slides without a clear logical flow or active headings. Follow our recommended 10-slide sequence to build engagement and consistency.
  • Unclear Accountability Metrics**: Failing to specify owners or timelines for diversity objectives. Always define clear metrics tables and timeline milestones for key initiatives.

Avoiding these common visual and structural pitfalls ensures that your corporate DEI proposal holds the board's attention, communicates absolute value, and builds deep operational trust across all deal stakeholders.