Real Estate Portfolio Review Presentation Templates

Stop wasting hours on manual formatting. Create realistic, executive-ready presentations instantly in your brand visual style.

Interactive occupancy & yield analysis dashboards
Widescreen asset-level performance matrices
Multi-track 3-year capital reallocation roadmaps

1The Strategic Role of Real Estate Portfolio Reviews

In the highly competitive institutional real estate market, managing a portfolio of commercial, residential, or industrial assets requires rigorous oversight, continuous performance calibration, and clear communication with stakeholders. A real estate portfolio review is the primary strategic document used by asset managers, REIT executives, and fund directors to evaluate property performance, justify investment decisions, and align operations with overall market conditions. This presentation serves as the definitive reporting mechanism for institutional sponsors, limited partners, and corporate boards, translating complex property-level data into actionable business intelligence. Conducting periodic, structured portfolio reviews ensures that asset management teams identify underperforming properties early, optimize operational efficiencies, and allocate capital to high-yield projects. Grounding these reviews in clear, structured visual formats allows board members to quickly grasp occupancy trends, cash flow volatility, and valuation fluctuations, establishing a baseline of professional credibility and trust that is vital for securing continued capital commitments. Furthermore, these sessions provide a structured forum to evaluate macroeconomic indicators, localized supply-demand dynamics, and regulatory changes, enabling the fund to pivot its strategic asset positioning before market shifts impact the bottom line.
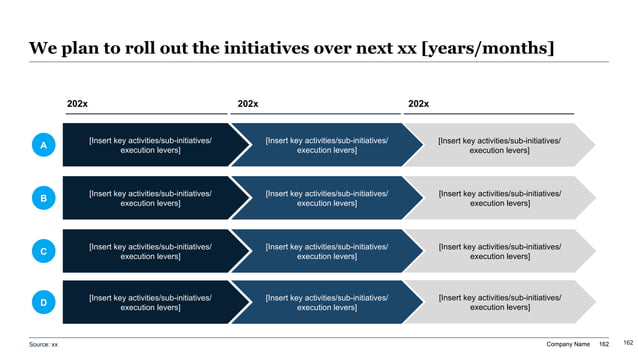
Professional real estate portfolio review slide showing a multi-track 3-year initiative rollout grid with interlocked chevron bands and key milestone markers.
Template Design LayoutReal Estate Portfolio Review Presentation Templates

2Aligning Portfolio Performance with Fund Investment Objectives

Every real estate fund operates under a specific investment mandate and risk profile, ranging from low-risk core strategies focusing on capital preservation and steady cash distribution, to value-add and opportunistic strategies seeking high capital appreciation through property repositioning and development. A comprehensive portfolio review must demonstrate how the performance of individual assets aligns with these overarching fund objectives. For a core REIT, the deck should highlight long-term tenant stability, lease expiration schedules, and predictable yield metrics. In contrast, an opportunistic private equity fund review must focus on execution milestones, construction timelines, capital expenditure (CapEx) budgets, and exit strategies. By structuring your presentation slides to explicitly map asset-level metrics against the fund's target benchmarks, you prove to your investment committee that your operations are aligned with investor expectations. This strategic alignment helps justify asset hold-sell decisions, capital refinancing proposals, and new acquisition targets, ensuring that all actions support the fund’s ultimate return objectives.

3Applying Minto's Pyramid Principle to Real Estate Presentations

A common pitfall in real estate presentations is drowning the audience in massive, unstructured spreadsheets and technical property descriptions, forcing decision-makers to guess the strategic takeaways. To avoid this communication bottleneck, top-tier asset managers structure their portfolio review decks using Barbara Minto’s Pyramid Principle. This structured communication standard dictates that every slide must lead with the conclusion first. Rather than using passive titles like "Occupancy Metrics," you should write an active headline such as "Industrial Assets Reach 98% Occupancy, Driving a 12% Increase in Quarterly Rental Income." The supporting data cards, occupancy charts, and operational details on the slide must represent mutually exclusive, collectively exhaustive (MECE) sub-arguments that logically validate this main claim. This narrative discipline ensures that busy investment committee members and fund sponsors can scan your portfolio review in under ninety seconds, immediately understanding the primary drivers of financial performance and accelerating strategic approvals. Furthermore, storylining with conclusion-first statements eliminates slide clutter, keeping the focus on critical strategic takeaways.

4Key Financial and Operational Performance Metrics to Track

To build complete credibility with private equity sponsors, investment committees, and corporate controllers, a portfolio review must present quantitative performance metrics in a clear, high-density format. Relying on qualitative descriptions will fail under rigorous financial audits. The deck must showcase critical key performance indicators (KPIs) such as Net Operating Income (NOI), Weighted Average Lease Expiry (WALE), Capitalization Rates (Cap Rates), Debt Service Coverage Ratio (DSCR), and Net Asset Value (NAV). The table below outlines standard target metrics expected by institutional real estate investors to measure portfolio health:

Metric CategoryTarget Institutional BenchmarkStrategic Importance in Asset Management
Occupancy RateGreater than 92%Determines revenue stability and market demand
WALE (Years)Greater than 5.5 YearsMinimizes short-term rollover and tenant lease risk
Debt Service Coverage (DSCR)Greater than 1.45xEnsures debt compliance and refinancing security
Operating Expense RatioLess than 40% of Gross RevenueMeasures property management cost efficiency

Presenting these benchmarks in a structured grid signals professional accountability and gives owners peace of mind.

5Visualizing Asset Allocation and Risk Exposure

A resilient real estate portfolio must maintain a balanced allocation across geographic regions, property sectors, and tenant types to mitigate concentration risk. A thorough portfolio review should include high-density visual matrices that breakdown exposure across these critical dimensions. For example, a heavy concentration in a single metropolitan statistical area (MSA) leaves the fund vulnerable to localized economic downturns, while over-exposure to a single tenant industry can lead to massive cash flow shocks if that sector experiences a contraction. Your presentation should demonstrate how your team actively monitors and manages these boundaries. Showcase geographic diversification using heatmaps, and highlight property sector splits—such as multi-family, logistics, retail, and office—using clean comparative bar charts. Proving that your asset mix is balanced and protected by strict risk limits reassures risk committees and limited partners that the fund is prepared to withstand macroeconomic volatility, safeguarding investor capital. Additionally, displaying historical correlation coefficients between different asset classes demonstrates a sophisticated approach to portfolio risk modeling, proving your operational diligence to institutional allocators.

6Constructing a 3-Year Capital Allocation and Reinvestment Roadmap

A successful portfolio strategy requires a clear, forward-looking plan for capital recycling, property upgrades, and asset divestments. An advanced multi-track project delivery engine stacks high-level phase arrows, key steering milestones, and workstream deliverables across a timeline to show this clearly. In our suggested layout, a multi-track 3-year initiative rollout grid utilizes interlocked chevron bands to map out grouped strategic initiatives across calendar quarters. The roadmap should be divided into distinct workstreams: Asset Dispositions, Value-Add Upgrades, Sustainable Energy Retrofits, and Capital Reinvestments. For example, the first track might show the planned sale of mature retail assets, while the second track details the renovation phase of multi-family properties to capture higher market rents. Visualizing this long-term strategy on a structured timeline proves to owners that your team possesses the operational discipline needed to manage capital recycling smoothly, preventing resource gaps and ensuring that cash proceeds are reinvested efficiently to drive net asset value growth.

7Asset-Level Deep Dives and Value-Add Initiative Structuring

While high-level portfolio metrics provide a general overview of fund health, strategic managers must also present asset-level deep dives to address underperforming properties and outline value-creation plans. Your portfolio review should dedicate specific slides to assets that are falling short of underwriting expectations, detailing the root causes—such as tenant bankruptcies, deferred maintenance, or localized supply spikes—and presenting concrete recovery initiatives. Detail how your team plans to execute value-add programs, such as modernizing building lobbies, implementing energy-efficient HVAC systems, or introducing smart home amenities to multi-family units. These improvements allow you to justify higher rental rates and compress cap rates upon exit. By organizing these recovery and value-add plans in a structured card format with clear milestones, estimated costs, and target yield improvements, you demonstrate to the board that you are actively managing asset risk and maximizing the return potential of every property in the portfolio. This process shows that you do not simply report losses but rather actively engineer recovery strategies to protect investor equity.

8Mitigating Debt Refinancing and Interest Rate Risks

Operating a leveraged real estate portfolio involves navigating complex financial risks, particularly in volatile interest rate environments. A professional portfolio review must detail the fund’s debt structure and refinancing strategy. Your deck should present a clear debt maturity ladder, illustrating when outstanding mortgages and credit lines mature over the next five to ten years. This visualization allows the investment committee to assess refinancing risk and plan capital requirements well in advance. Furthermore, outline the portfolio's mix of fixed-rate versus floating-rate debt, alongside any interest rate hedging instruments, such as swaps or caps, used to limit exposure. Detailing these financial controls, along with current compliance margins for key debt covenants like loan-to-value (LTV) and debt yield ratios, proves to lenders and equity sponsors that your asset management team maintains rigorous financial governance, protecting the portfolio from foreclosure risks and ensuring access to affordable credit. Maintaining optimal leverage ratios helps secure favorable financing terms and keeps interest expense predictable during volatile market cycles.

9Aesthetic and Typography Rules for Dark-Executive Presentations

To maintain a premium, boardroom-grade aesthetic that commands visual authority, your presentation must follow strict design rules. The "dark-executive" theme uses a dark slate or charcoal background to project corporate gravity and sophistication, making it ideal for financial reviews and investment pitches. Avoid the common pitfall of crowded layouts by maintaining a 60% dominant background canvas, a 30% structured layout grid (using clean, dark-grey card containers to organize charts and metrics), and a 10% high-contrast accent key (such as a vibrant gold or bright teal) to highlight key performance figures, cap rates, and timeline milestones. All text containers, metrics cards, and graphics must align perfectly to a 12-column visual grid, avoiding layout drift. Furthermore, keep typography disciplined: limit the deck to exactly two font families, keeping slide headings at 24pt-28pt, subheadings at 16pt-18pt, and body text at 12pt-14pt. Protecting at least 30% negative space on every slide lets the content breathe, reducing cognitive friction and helping board directors focus on your asset strategy.

10Leveraging XLSlides AI to Automate Real Estate Deck Compilation

Creating a comprehensive real estate portfolio review manually in PowerPoint is a slow, frustrating task, often consuming 12 to 18 hours of adjusting margins, aligning data grids, and formatting financial tables. XLSlides AI automates this design process, allowing asset managers and real estate analysts to compile premium, boardroom-ready decks in under sixty seconds. The AI performs context-aware layout matching, interpreting your property brief and automatically mapping data to visual timelines, allocation grids, or comparison cards. Brand consistency is strictly maintained based on your chosen design preset, preventing font or margin drift. The final presentation exports as standard, editable PowerPoint vector shapes, allowing you to easily adjust property details, update financial charts, or customize slides for specific investment committees. This design automation frees up real estate strategy and operations teams to focus on managing assets and driving property yields rather than wasting hourly resources on layout checks, providing a major efficiency boost to investment firms.