Direct Answer: What A Budget Vs Actual Presentation Should Actually Do
A serious budget vs actual presentation should answer five questions fast: where performance deviated from plan, why that deviation happened, whether the gap is temporary or structural, what management recommends next, and what leadership needs to approve or monitor. If the deck only restates monthly numbers, it has failed. Senior readers can already see the variance in a spreadsheet. They need the explanation, implication, and decision path.
This is why finance review decks are harder than they look. The audience is usually mixed. The CFO wants a clean bridge from plan to result. Business-unit leaders want their context represented fairly. The CEO wants to know which issues change the story of the quarter. Directors or sponsor teams want to understand whether the miss is contained, whether guidance still holds, and whether capital or staffing decisions need to change. A useful presentation converts those competing viewpoints into one disciplined narrative.
For XLSlides, the product fit is strong because the raw inputs are messy and repetitive: budget files, actuals, forecast tabs, commentary from functional owners, board-prep notes, KPI exports, and action trackers from prior reviews. The AI workflow should accelerate the first structured draft by turning those inputs into action titles, variance explanations, bridge pages, and editable PowerPoint-style output. Human finance judgment still decides which assumptions are credible, which explanations are material, and how candidly the risk should be framed.
Key Takeaways
- A budget vs actual presentation is useful only when it explains the drivers behind the variance and the management response, not when it repeats the budget file.
- The strongest finance decks show plan, actual, latest forecast, and corrective action in one storyline rather than treating them as separate reporting exercises.
- Variance bridges, action titles, forecast resets, and owner-based next steps matter more than decorative chart styling.
- AI is most valuable when it drafts the first finance narrative from spreadsheets and commentary while keeping the file editable for CFO and FP&A review.
- Budget reviews are related to operating reviews and board packs, but the finance logic, evidence standard, and decision framing are distinct.
Budget Review Vs. Operating Review Vs. Board Pack Vs. Annual Plan
These documents share numbers, but they serve different jobs. Treating them as interchangeable is why many finance decks feel confused.
| Format | Primary Audience | Main Question | What Must Be Visible Early |
|---|---|---|---|
| Budget vs actual presentation | CFO, CEO, FP&A, business leaders, sometimes directors | Where are we off plan and what changes now? | Largest variance, true driver, updated outlook, management action |
| Operating review | Management team and functional owners | What changed in operations and who owns the fix? | Root cause, owner, timing, intervention plan |
| Board pack | Directors and governance stakeholders | What should the board approve, challenge, or monitor? | Decision ask, risk, capital implication, management judgment |
| Annual operating plan | Executive team and finance leadership | What targets and assumptions should we commit to for the year? | Targets, assumptions, resource choices, strategic tradeoffs |
| Investor update | Current or prospective investors | How is the business progressing and what changed in the narrative? | Performance headline, milestones, runway, confidence level |
Finance Narrative Opening Reference
Why Most Budget Variance Decks Lose The Room
The most common failure mode is reporting numbers without presenting a point of view. A slide says revenue is 6% below plan, margin is 180 basis points behind, and working capital is worse than target. The audience still has to ask why, whether the issue is fixable, and whether the business should change its forecast or operating posture. A finance presentation that makes leadership do all that reconstruction live wastes the meeting.
The second failure mode is mixing symptoms and causes. For example, EBITDA may miss because pricing discipline weakened, implementation rework rose, and collections slipped. Those drivers are not equivalent. Some are operational. Some are commercial. Some are timing. If the deck compresses them into one vague sentence, management cannot tell which lever matters most. The presentation should separate the economic outcome from the underlying business drivers and then rank those drivers by materiality.
The third failure mode is weak escalation logic. Not every variance deserves board airtime or a forecast reset. Some gaps should be handled inside the function. Others require a hiring decision, a pricing change, a capex pause, or a guidance adjustment. The deck has to signal which category applies. That is the real value of a budget review presentation: it translates accounting movement into a management decision, not merely into a prettier spreadsheet.
Inputs Finance Teams Should Gather Before Drafting
Executive Questions A Good Variance Deck Must Answer
If the deck cannot answer these quickly, the spreadsheet will take over the meeting.
| Executive Question | What The Slide Should Show | What Weak Decks Usually Miss |
|---|---|---|
| How far off plan are we where it really matters? | A prioritized summary of the few metrics changing the story | Equal weight given to trivial and material variances |
| Why did the number move? | Driver-level explanation with evidence and ownership | A generic label such as market softness or execution issues |
| Is the issue temporary or structural? | Timing call, trend evidence, and risk to next period | No distinction between one-off slippage and broken assumptions |
| What is management doing now? | Named corrective action with date and owner | Vague next steps without operational commitment |
| Should the forecast change? | Updated outlook with explicit assumptions and downside sensitivity | An implied forecast reset hidden across several slides |
| What decision is required from leadership? | Approve, monitor, escalate, or hold course | A long appendix but no explicit decision ask |
Scorecard And Status Signal Reference
Build The Story Around One Economic Conclusion
The cleanest finance presentations do not start with a tour of the P&L. They start with the core economic conclusion. For example: revenue is slightly ahead of plan but the mix shift compressed gross margin, leaving EBITDA below target and making a hiring pause prudent until backlog normalizes. That sentence tells the audience how to read the rest of the deck. Without it, every slide becomes a separate analytical puzzle.
Once the conclusion is visible, the deck should move through evidence in a disciplined order. First show the headline plan-versus-actual result. Then show the bridge explaining the gap. Then isolate the two or three drivers that matter most. Then show the updated forecast and what assumptions changed. Finally translate that into actions, owners, and approvals. This sequence keeps the presentation focused on management logic rather than reporting completeness.
This is also where AI can help responsibly. If you feed the model only a budget file, it will tend to describe rows. If you give it the audience, the headline issue, the main drivers, the proposed actions, and the supporting numbers, it can generate a first-pass finance storyline that is much closer to a real CFO deck. The human editor then tightens the logic, removes unsupported language, and checks whether the narrative is balanced enough to survive executive questioning.
Recommended 12-Slide Budget Vs Actual Sequence
This sequence is designed for finance reviews that need both analytical clarity and executive action, not just monthly reporting hygiene.
| Slide | Purpose | Decision Question Answered |
|---|---|---|
| 1. Executive summary | State the budget verdict, major driver, and required action | What changed and what do we do now? |
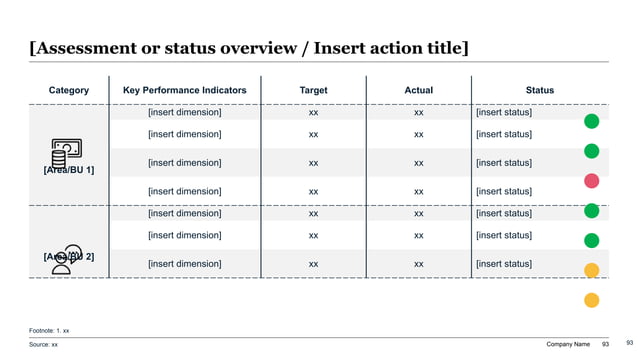
| 2. Scorecard | Show plan, actual, and forecast for the core metrics | Which numbers matter most this period? |
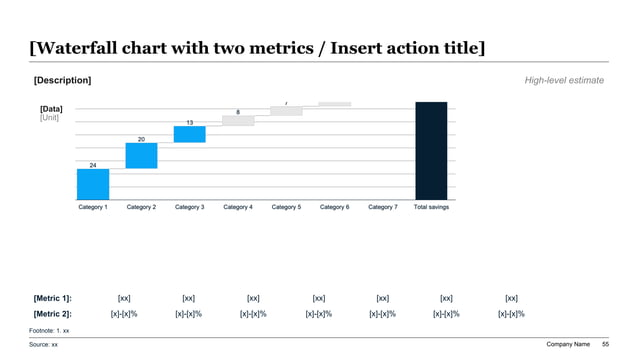
| 3. Variance bridge | Explain the movement from budget to actual | Why are we off plan? |
| 4. Revenue or volume drivers | Isolate the demand-side explanation | What happened commercially? |
| 5. Margin drivers | Show mix, pricing, productivity, or cost effects | Where did economics improve or deteriorate? |
| 6. Opex and cash impact | Translate the operating gap into spend and liquidity implications | What is the financial consequence? |
| 7. Business-unit or region split | Show concentration of the issue | Where is the variance really coming from? |
| 8. Forecast reset | Present the new base case and assumptions | What outlook should leadership use now? |
| 9. Sensitivity or downside range | Bound the uncertainty | How much worse or better could this get? |
| 10. Corrective action plan | List the few interventions tied to the numbers | What will management change immediately? |
| 11. Decision asks | Name approvals, escalations, or watch items | What does leadership need to decide? |
| 12. Appendix | Preserve detail without slowing the main narrative | Where is the backup if challenged? |
Prompt Recipe For A Budget Vs Actual Presentation
Create a 12-slide budget vs actual presentation for a monthly executive finance review. Audience: CEO, CFO, FP&A lead, chief of staff, and business-unit leaders at a PE-backed B2B software and services company. Period: May close review. Business context: revenue landed 3% above plan, but EBITDA finished 19% below plan because implementation mix expanded, delivery overtime increased, and collections slipped into the next month. Include an answer-first executive summary, scorecard, variance bridge, revenue drivers, margin drivers, opex and cash impact, region or business-unit split, forecast reset, downside sensitivity, corrective action plan, explicit decision asks, and appendix source-note placeholders. Use consultant-style action titles, plain finance language, and editable PowerPoint-style structure instead of decorative AI slides.
Show Plan, Actual, Forecast, And Action On The Same Page
Finance teams often separate the discussion into disconnected packets: one deck for actuals, one sheet for reforecast, one email for actions. Executives then spend the meeting stitching those artifacts together. A better budget vs actual presentation puts them in one logical flow. First establish what happened against budget. Then show whether the outlook changed. Then state which actions management recommends because of that updated view.
That integrated structure matters because many variances are only meaningful in context. A revenue miss may be manageable if pipeline conversion improved late in the month and the next-quarter forecast holds. The same miss is more serious if margin also weakened and cash timing tightened. Likewise, an expense overspend can be acceptable if it pulls forward a value-creating initiative, but not if it simply reflects poor discipline. The deck should connect the current-period variance to the forward decision, not treat those as separate accounting stories.
One practical rule is that every key slide should tie a number to an implication. If gross margin is down, the page should explain whether the issue is pricing, mix, utilization, freight, discounting, or something else, and it should state what management is changing. If cash collections slipped, the page should show whether this is a billing timing issue, a customer-risk issue, or an internal process issue, and whether the forecast changes as a result. That is what makes the presentation executive-ready.
Variance Bridge Visual Reference
Action Title Rewrite Matrix For Finance Slides
Descriptive headers slow finance meetings. Rewrite them so the conclusion is visible before the chart is read.
| Weak Topic Label | Stronger Finance Action Title | Why The Rewrite Works |
|---|---|---|
| Revenue update | Revenue beat plan, but lower-margin implementation mix erased most of the upside | It links topline movement to the actual economic consequence |
| EBITDA variance | EBITDA missed plan because delivery overtime and rework offset commercial gains | It identifies the main drivers instead of repeating the symptom |
| Cash review | Collections timing now makes working-capital discipline the fastest lever for restoring cushion | It converts a metric discussion into a management implication |
| Forecast | The base-case forecast still holds only if backlog falls within six weeks and hiring stays gated | It reveals the assumptions behind the outlook |
| Expenses | Discretionary spend should remain frozen until margin recovery offsets May's service overrun | It turns a budget line into a decision |
| Next steps | Leadership needs to approve the hiring gate, pricing test, and weekly cash checkpoint this month | It makes the decision ask explicit |
Forecast Resets Need Assumptions, Not Just New Numbers
A forecast reset should never look like a quiet spreadsheet update. If management is changing the outlook, the deck must explain which assumptions moved, which risks remain, and what evidence supports the new case. Otherwise the leadership team cannot tell whether the reforecast reflects better information, defensive sandbagging, or unresolved confusion about the underlying business.
A disciplined reset usually includes four parts. First, the original assumption that is now broken or delayed. Second, the observed evidence that forced the update. Third, the new assumption and the rationale behind it. Fourth, the action management will take to improve the next period rather than simply lowering the bar. That format preserves credibility because it shows the logic behind the revision instead of presenting the new number as if it arrived from nowhere.
This is also where CFO-grade communication matters most. Senior readers do not just want the point estimate. They want to know the range, the key sensitivities, and the signposts that would trigger another revision. A good budget vs actual presentation therefore treats the forecast as a management judgment document, not merely as a workbook output.
Red Flags That Usually Mean The Deck Is Still Too Spreadsheet-Led
Forecast Comparison Reference
Choose The Right Visual For Each Variance Story
Not every finance point deserves the same chart. The visual should match the question leadership is trying to answer.
| Business Question | Best Visual | Why It Works |
|---|---|---|
| What explains the gap from budget to actual? | Waterfall bridge | Shows the contribution of each driver to the final delta |
| How did the quarter trend versus plan? | Plan vs actual trend chart | Makes timing and inflection points obvious |
| Which units or regions are driving the issue? | Ranked bar or heatmap table | Concentrates attention on the real pockets of underperformance |
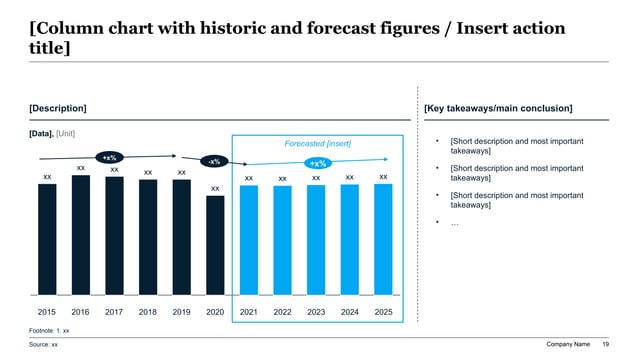
| Did the forecast change materially? | Actual plus forecast comparison chart | Separates what happened from what management now expects |
| What should leadership approve? | Decision matrix or action register | Turns analysis into a concrete management mechanism |
| What backup will finance be challenged on? | Appendix table | Preserves detail without cluttering the core narrative |
Who Owns The Storyline In A Finance Review
The best budget presentations are co-owned, but not democratically written. Finance should own the structure, comparability, and bridge logic. Business leaders should own the causal explanation for their areas and the feasibility of the corrective action. The CEO or chief of staff usually decides which issues belong in the main narrative versus appendix. If everyone writes their own section independently, the result is almost always a stack of functional defenses instead of one executive document.
This matters especially in PE-backed or board-adjacent environments. Sponsor teams and directors quickly spot decks that have been assembled by committee without a controlling narrative. They can tell when the margin slide says one thing, the cash slide implies something else, and the forecast slide quietly changes assumptions without explanation. A strong finance review needs one editorial owner who ensures the titles, charts, and actions tell the same story.
AI can reduce the administrative burden here. XLSlides can convert commentary, KPI exports, and spreadsheet logic into a first-pass deck much faster than manual formatting. But the finance lead still has to decide whether the narrative is complete, whether the forecast reset is defensible, and whether the action plan is honest enough for the audience. Automation should shorten the cycle, not soften the judgment.
Management Recommendation Panel Reference
XLSlides Resources For Finance Review Workflows
Short Answers For Finance Teams
What should the first slide of a budget vs actual presentation say?
It should state the headline budget verdict, the one or two drivers that changed the story, whether the outlook changed, and what management wants leadership to approve or monitor next.
How is a budget vs actual presentation different from an operating review?
A budget vs actual presentation is more finance-led and focused on plan variance, outlook, and economic implications. An operating review is broader and more cross-functional, with heavier emphasis on root-cause ownership and management cadence.
Should a budget review include forecast and sensitivity ranges?
Yes, when the variance is material enough to affect decisions. A serious finance deck should show the revised base case, the assumptions behind it, and the signposts that would trigger another change.
Can AI draft a credible finance variance deck?
Yes, if the inputs include the audience, key numbers, driver commentary, and the recommended actions. Human review is still required to validate causality, comparability, accounting nuance, and the appropriateness of the forecast reset.
Governance And Ownership Reference
Draft The Budget Review Deck In XLSlides
Use XLSlides to turn budget files, actuals, forecast tabs, owner commentary, and board-prep notes into an editable budget vs actual presentation with action titles, variance bridges, forecast logic, and PowerPoint-style output.
Generate Budget Review Deck