Key Strategic Sourcing & Procurement Takeaways for CPOs, Consultants & PE Operating Partners
- Reconcile Sourcing Savings to Audited EBITDA: Contracted paper savings never impress executive leadership unless reconciled to P&L line items, working capital releases, and audited cost center baseline reductions.
- Segment Addressable Spend via Kraljic Matrix: Avoid one-size-fits-all RFP mandates; classify direct and indirect spend into Bottleneck, Critical/Strategic, Leverage, and Non-Critical quadrants to deploy tailored negotiation levers.
- Deconstruct Value via Total Cost of Ownership (TCO) & Clean-Sheets: Never evaluate supplier bids solely on baseline purchase price; model logistics, duties, inventory holding costs, scrap rates, and payment terms to reveal true landed margin impact.
- Normalize RFP Bids Mathematically: Implement multi-attribute scoring matrices that weigh technical capabilities, ESG/regulatory resilience, and lead-time guarantees alongside commercial pricing to eliminate cognitive bias.
- Structure Sourcing Waves with Clear Stage-Gates: Execute multi-wave procurement transformations across 4 distinct phases—Diagnostic, Supplier Engagement, Commercial Negotiations, and Contract Realization—with strict sign-off gates.
- Establish Procurement Transformation Office (PTO) Governance: Secure ongoing P&L savings capture through dual-signoff purchase orders, supplier scorecard reviews, and monthly steering committee cadence.
Executive Summary: Bridging Spend Analytics with Boardroom Decision-Making
In global enterprise management, private equity portfolio operations, and supply chain transformations, procurement has fundamentally shifted from a transactional purchasing utility into a primary engine of EBITDA expansion and enterprise risk mitigation. With geopolitical fragmentation, raw material inflationary spikes, supplier insolvency threats, and aggressive corporate margin targets, senior executives can no longer tolerate disconnected purchasing silos. Strategic sourcing directly touches 45% to 70% of enterprise revenue through external vendor spend across direct raw materials, indirect corporate overhead, cloud and IT infrastructure, and third-party logistics. The primary mandate of the strategic sourcing presentation is to synthesize complex spend cubes, supplier market dynamics, and multi-round commercial negotiations into clear, decision-ready investment cases for executive committees and CFOs.
A chronic failure mode among corporate procurement teams and operations consulting engagements is the 'raw data deluge trap'—entering boardroom presentations with 90-slide decks filled with unnormalized ERP purchase-order dumps, dense spend pivot tables, and anecdotal supplier complaints. Board members, Chief Financial Officers, and Private Equity Operating Partners do not need to parse individual line items; they demand strategic answers to fundamental economic questions: What is our total addressable spend baseline? Where are we overpaying relative to competitive market benchmarks? How much contracted cost-out will flow directly through to audited P&L EBITDA versus being absorbed by operational inflation or volume growth? What supply chain failure risks are being created by sole-source vendor dependencies?
An institutional strategic sourcing presentation establishes clarity by applying rigorous structured problem-solving methodologies pioneered by A.T. Kearney, McKinsey Operations, and Peter Kraljic. It translates unstructured invoice data into a disciplined spend cube categorized by business unit, category taxonomy, and vendor concentration. It establishes transparent baseline benchmarks, evaluates supplier market structures, applies clean-sheet cost models, conducts normalized multi-attribute RFP bid comparisons, and charts explicit contract governance roadmaps that protect margin delivery over multi-year holding periods.
This guide establishes the comprehensive executive standard for strategic sourcing and procurement presentations. It details the core slide architectures required by management consulting practices (Kearney, McKinsey, BCG, Bain, Alvarez & Marsal) and PE sponsor deal teams, provides concrete frameworks for Kraljic portfolio segmentation and Total Cost of Ownership (TCO) modeling, establishes production-ready RFP evaluation matrices and negotiation concession strategies, and provides comprehensive prompt recipes for generating executive-ready presentations in XLSlides.
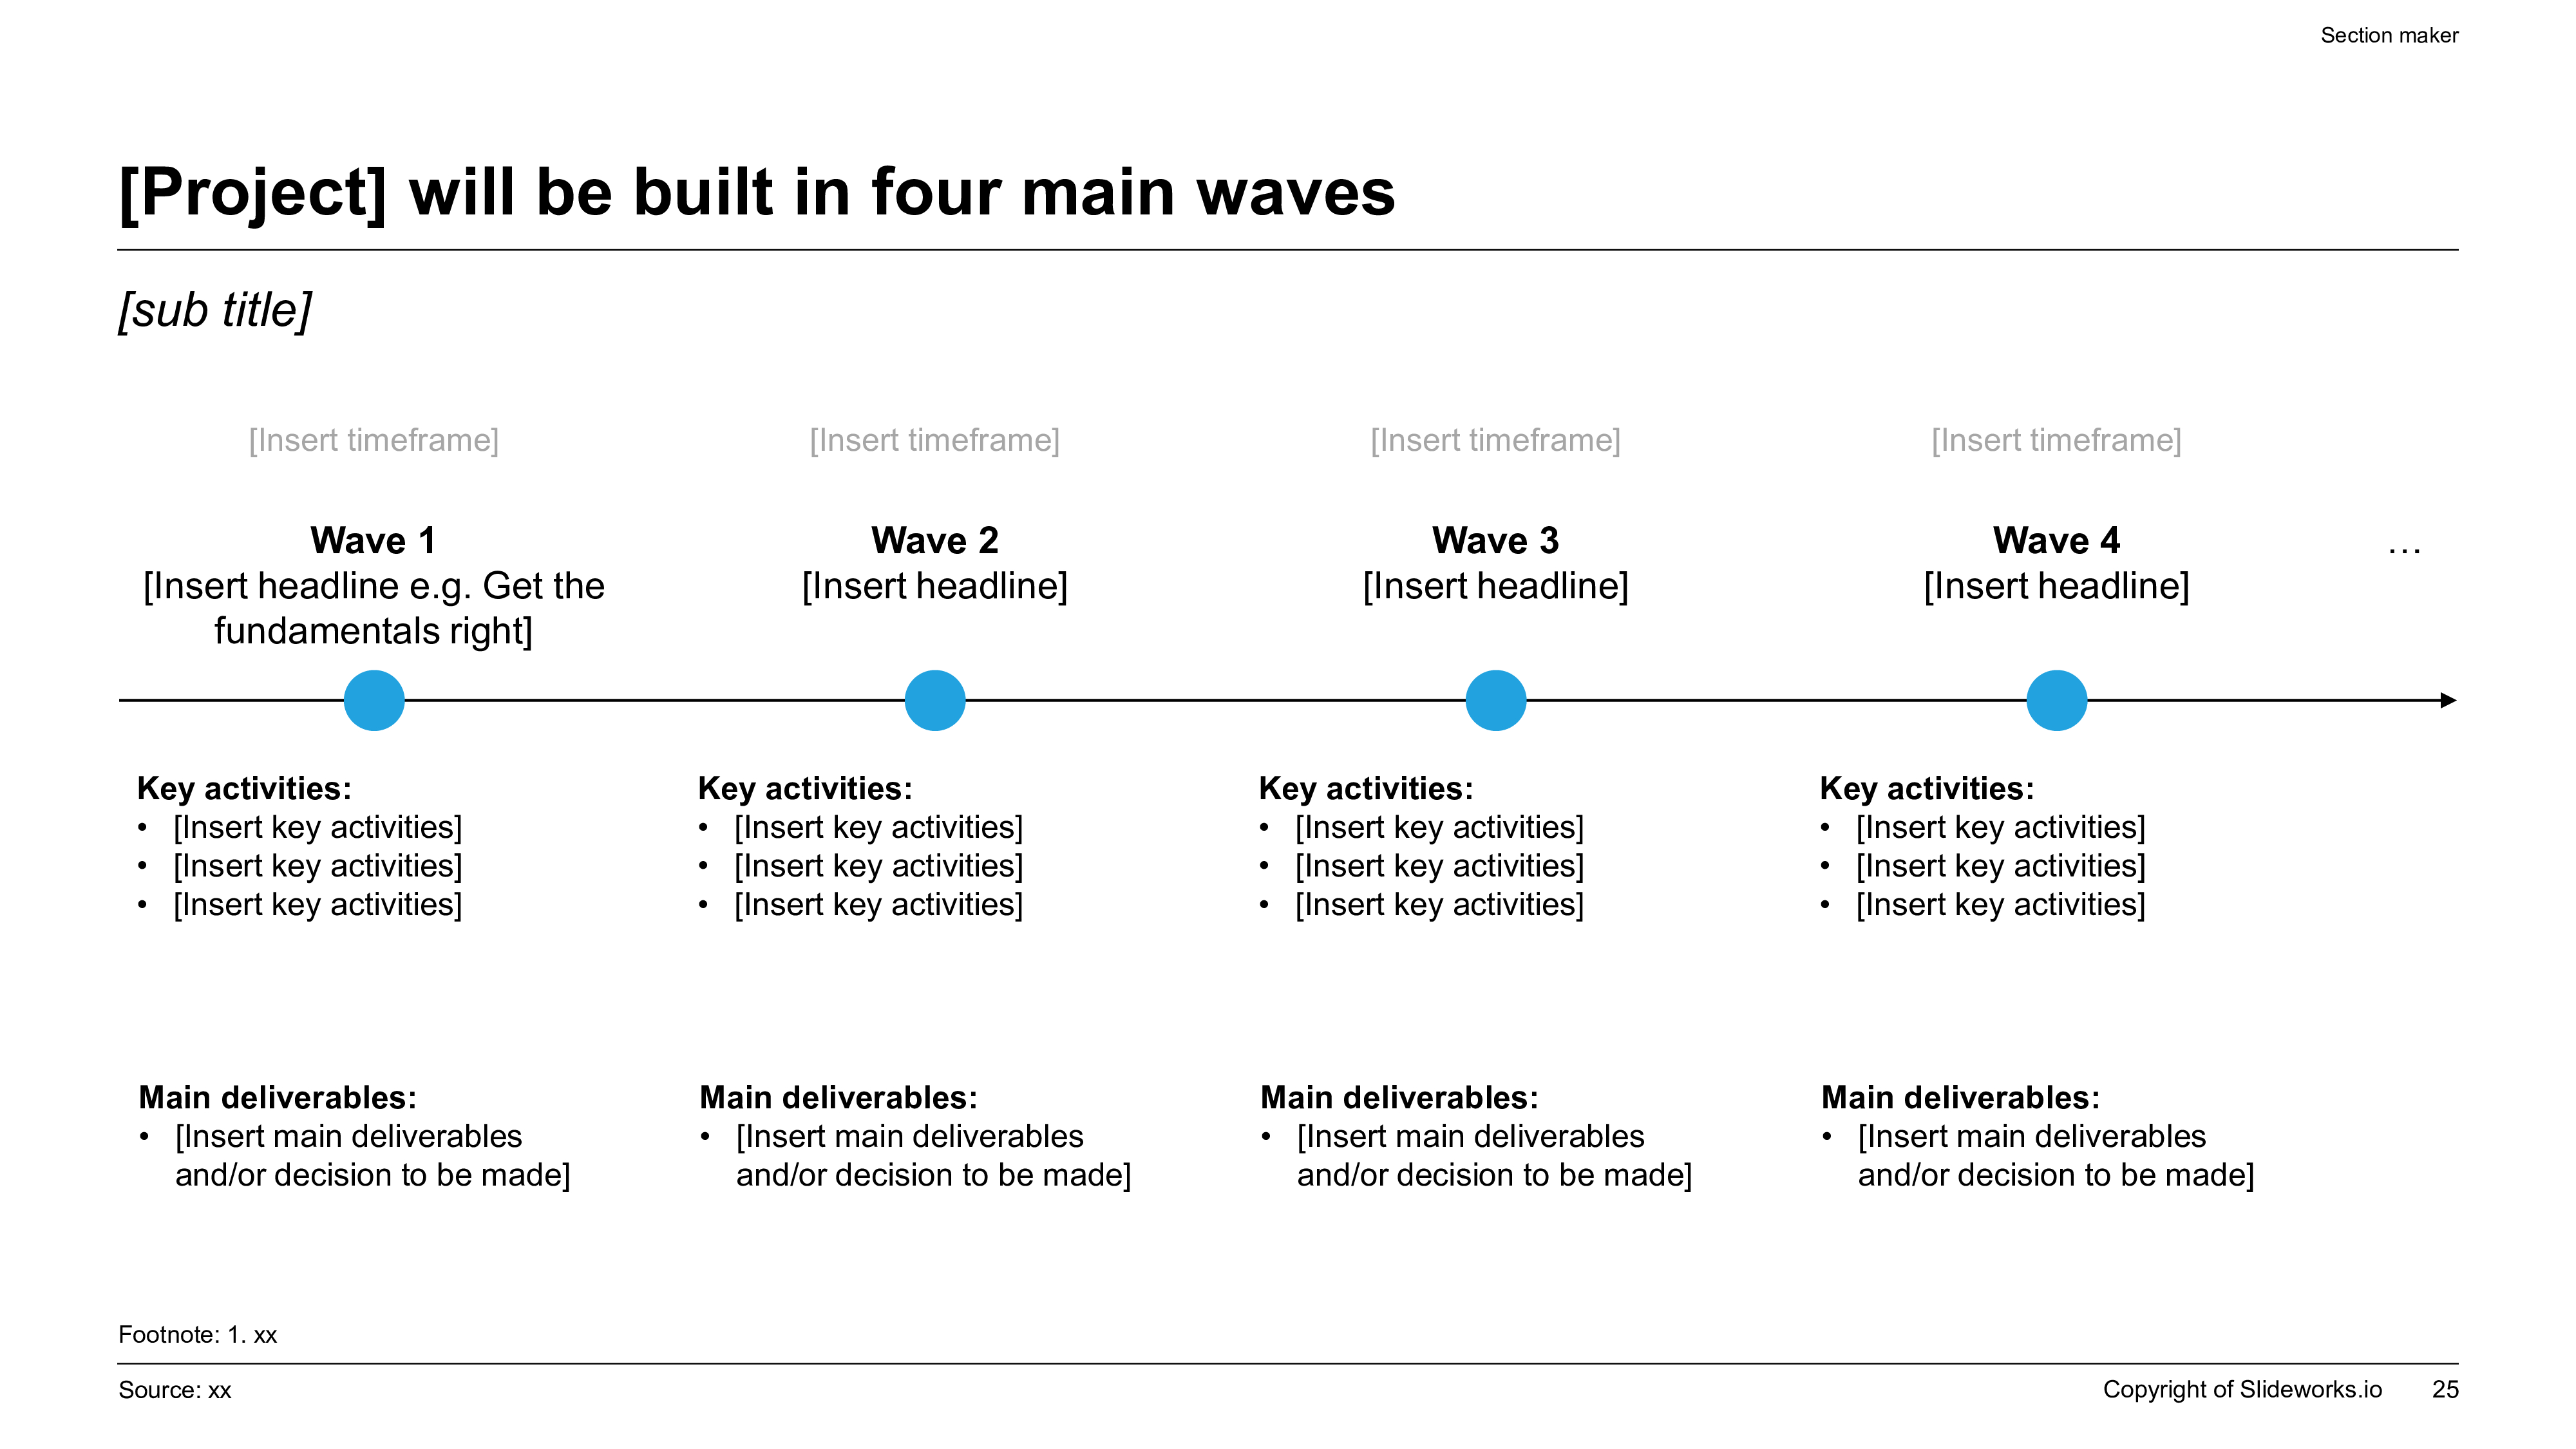
Exhibit 1: The 4-Wave Strategic Sourcing Timeline & Category Execution Architecture
Category Spend Diagnostics & Addressable Baseline Qualification Checklist
The Kraljic Portfolio Matrix: Aligning Category Strategy with Supply Risk and Profit Impact
Introduced by Peter Kraljic in his seminal Harvard Business Review study 'Purchasing Must Become Supply Management,' the Kraljic Portfolio Matrix remains the foundational framework for corporate procurement strategy. In high-stakes executive presentations, the Kraljic Matrix prevents the catastrophic strategic error of applying generic cost-cutting mandates uniformly across heterogeneous supply markets. Demanding aggressive 15% rate cuts from a sole-source patent-protected technology vendor can lead to abrupt contract termination and catastrophic plant shutdowns, while passively accepting annual price increases on generic office supplies or standard packaging destroys operating leverage.
The Kraljic Matrix positions categories along two distinct axes: Supply Risk (the degree of market scarcity, number of qualified suppliers, barriers to entry, logistics complexity, and geopolitical risk) and Profit Impact (the total dollar spend, percentage of cost of goods sold, and direct sensitivity of bottom-line EBITDA to price movements). This 2x2 segmentation defines four distinct operational quadrants that dictate executive presentation structure:
1. Non-Critical Items (Low Risk, Low Impact): General indirect spend, MRO supplies, standard office equipment, and routine facility services. The executive strategy focuses on transaction automation, catalog standardization, purchasing card (p-card) adoption, vendor consolidation, and eliminating administrative overhead.
2. Leverage Items (Low Risk, High Impact): High-volume raw materials, standard transportation freight, commodity packaging, and commercial enterprise IT hardware where multiple competitive vendors exist. The presentation strategy centers on aggressive competitive bidding, reverse auctions, volume pooling across portfolio companies, and short-to-medium-term multi-vendor split allocations.
3. Bottleneck Items (High Risk, Low Impact): Specialized replacement parts, proprietary software micro-services, and niche chemical catalysts where spend is relatively modest but supply failure paralyzes core operations. The strategic focus is risk mitigation, buffer stock optimization, specification redesign, supplier relationship management (SRM), and contractually secured minimum capacity commitments.
4. Strategic / Critical Items (High Risk, High Impact): Core bespoke components, critical contract manufacturing (CDMO/EMS), sole-source logistics infrastructure, and mission-critical cloud platform architecture. The executive presentation must outline long-term strategic partnerships, open-book cost transparency, joint value engineering, co-investment in tooling, and comprehensive business continuity failover protocols.
Comprehensive Kraljic Category Strategy & Sourcing Levers Matrix
Executive strategic mapping of spend categories across the Kraljic quadrants, detailing core market dynamics, strategic sourcing objectives, primary negotiation levers, and governance cadence.
| Kraljic Quadrant | Typical Categories | Market Characteristics | Primary Sourcing Objective | Core Commercial Levers | Executive Review Cadence |
|---|---|---|---|---|---|
| Non-Critical Items (Low Risk, Low Impact) | Office supplies, standard MRO, uniform laundry, routine travel bookings | Abundant suppliers, low switching costs, standardized specifications, high invoice volume | Process automation & administrative cost minimization | P-card deployment, punch-out e-catalogs, vendor consolidation, spot-buy elimination | Annual review by Category Lead |
| Leverage Items (Low Risk, High Impact) | Corrugated packaging, bulk freight logistics, generic direct resins, commercial laptops | Commoditized market, multiple global suppliers, substantial spend volume, price-sensitive | Aggressive cost-out & competitive price maximization | Electronic reverse auctions, volume bundling across BUs, multi-vendor share allocations, index pricing | Quarterly review with Sourcing Director |
| Bottleneck Items (High Risk, Low Impact) | Specialized spare parts, niche testing reagents, legacy software licenses | Monopoly or duopoly vendors, high switching friction, low volume, critical operational role | Supply security & business continuity assurance | Safety stock agreements, dual-vendor qualification, specification redesign, index-capped pricing | Bi-monthly review with VP Supply Chain |
| Strategic Items (High Risk, High Impact) | Core engine assemblies, specialized API active ingredients, enterprise cloud infrastructure | Oligopolistic market, heavy technical customization, long qualification cycles, immense P&L impact | Long-term value creation & supply chain resilience | Open-book clean-sheet cost models, joint value engineering, gain-share contracts, dedicated executive councils | Monthly review with CPO & Board Committee |
Exhibit 2: Category Spend Diagnostics & Kraljic Portfolio Matrix Architecture
Total Cost of Ownership (TCO) & Clean-Sheet Cost Modeling for Executive Committees
In management consulting and private equity cost-out programs, one of the most hazardous cognitive traps is the 'Unit Price Fallacy'—celebrating a 12% reduction in nominal supplier quote price while ignoring ballooning freight rates, extended inventory holding carrying costs, higher scrap rates, and delayed warranty reimbursements. An executive presentation must guide leadership through a comprehensive Total Cost of Ownership (TCO) methodology that captures the true end-to-end economic impact of every sourcing decision.
Total Cost of Ownership encompasses six discrete financial cost buckets that must be visually broken down in executive decks:
1. Base Acquisition Cost: The invoiced unit price, inclusive of volume discount tiers, minimum order quantities (MOQ), and currency exchange rate assumptions.
2. Transportation, Logistics & Tariffs: International ocean/air freight, drayage, customs clearance, import tariffs under Section 301/MFN schedules, harbor maintenance fees, and demurrage penalties.
3. Working Capital & Inventory Carrying Costs: Extended transit lead-times (e.g., 45 days ocean transit from Southeast Asia versus 3 days domestic trucking) tied up in in-transit inventory, safety stock buffers required to insulate against port disruptions, and capital financing charges calculated at the company's weighted average cost of capital (WACC).
4. Quality, Defect & Scrap Costs: Incoming inspection testing, supplier factory audit expenses, defective parts per million (PPM) scrap rates, manufacturing downtime caused by out-of-spec tolerances, and customer warranty RMA chargebacks.
5. Supplier Integration & Onboarding Costs: Tooling qualification, factory production part approval processes (PPAP), EDI/API procurement software integration, and compliance validation audits (SOC 2, ISO 9001, ESG labor standards).
6. End-of-Life, Disposal & Obsolescence: Hazardous waste disposal, regulatory recycling compliance (WEEE/RoHS), and inventory write-downs caused by product lifecycle transitions.
Complementing TCO is Clean-Sheet Cost Modeling (often referred to as 'Should-Cost Modeling'). Instead of relying on supplier markups and opaque pricing proposals, operations consultants construct bottom-up engineering financial models of what a product or service should legitimately cost. Clean-sheet models break down baseline commodity raw materials (indexed to London Metal Exchange or ICIS benchmarks), direct manufacturing labor minutes, machine cycle times and depreciation, allocated plant overhead, and standard supplier profit margins (typically 8% to 14%). When presented to an Executive Committee or deployed in high-stakes negotiations, clean-sheet models strip away supplier pricing opacity and ground commercial debates in undisputed empirical manufacturing facts.
RFP Vendor Evaluation, Bid Normalization & Commercial Due Diligence Checklist
Competitive RFP Structuring, Multi-Attribute Supplier Scoring & Reverse Auctions
The competitive bidding process represents the fulcrum of strategic sourcing execution. However, executive committees frequently resist procurement transformations because they fear that low-bid RFPs will compromise product quality, customer delivery reliability, or technical innovation. An institutional procurement deck directly dispels these executive concerns by demonstrating a rigorous, mathematical multi-attribute vendor selection process that balances cost reduction against operational resilience.
A best-practice RFP presentation presents an objective 100-Point Weighted Scoring Model across four balanced dimensions: Commercial Pricing & TCO (35-40%), Technical & Operational Capability (25-30%), Quality & Delivery Reliability (20-25%), and Strategic Partnership & Compliance (10-15%). Each evaluation dimension is supported by granular sub-criteria scored independently by cross-functional evaluation teams—including Engineering, Quality Assurance, Plant Operations, Finance, and Procurement. Presenting consensus scoring tables where technical evaluators score vendor capabilities blindly before commercial pricing is unveiled reinforces fiduciary credibility and eliminates accusations of procurement bias.
Furthermore, for highly competitive Leverage categories, the executive presentation outlines the deployment of Electronic Reverse Auctions (e-Auctions). Electronic reverse auctions represent dynamic, real-time online bidding events where pre-qualified suppliers compete to win market share by submitting progressively lower price bids during a time-compressed window (typically 60 to 90 minutes). Executive presentations must clearly articulate the prerequisites for successful e-Auctions: clear, immutable product specifications, a minimum of 4 to 6 fully pre-qualified and certified suppliers, excess market capacity, and guaranteed substantial award volume. Clarifying that reverse auctions are never deployed on complex Bottleneck or Strategic categories reassures board members that operational integrity will not be sacrificed for transactional price concessions.
Exhibit 3: Global Supplier Sourcing Footprint & Multi-Tier Geographic Supply Base Risk Evaluation

Multi-Attribute Supplier Evaluation & Vendor Selection Scorecard (100-Point Model)
Comprehensive cross-functional evaluation matrix scoring five competing enterprise vendors across commercial, technical, operational, and ESG compliance criteria to determine final sourcing awards.
| Evaluation Dimension | Weight (%) | Specific Evaluation Criteria | Incumbent Vendor | Challenger Vendor A | Challenger Vendor B (Recommended) | Low-Cost Off-Shore Bidder |
|---|---|---|---|---|---|---|
| Commercial Pricing & TCO | 35% | Total landed cost, volume discount tiers, payment terms (Net 90), tooling investment, indexed raw material pass-through | 72 / 100 (High baseline cost, historical markup creep) | 84 / 100 (11% baseline price reduction, rigid terms) | 93 / 100 (16% landed TCO reduction, flexible tiering, Net 90 terms) | 96 / 100 (22% lowest nominal unit bid, unindexed freight risk) |
| Technical & Manufacturing Capability | 25% | Engineering tooling precision, production cycle velocity, automated testing, R&D co-development capabilities | 88 / 100 (Proven technical fit, deep legacy intimacy) | 81 / 100 (Strong automated capacity, modern plant) | 89 / 100 (State-of-the-art automation, dual-facility footprint) | 64 / 100 (Manual assembly lines, limited engineering support) |
| Quality & Delivery Reliability | 25% | Historical PPM defect rates, On-Time In-Full (OTIF) track record, safety stock buffers, rapid prototype turnaround | 82 / 100 (94.2% OTIF, acceptable 120 PPM scrap) | 86 / 100 (96.5% OTIF, ISO certified QA labs) | 92 / 100 (98.8% OTIF, automated vision inspection, 45 PPM) | 58 / 100 (88.0% OTIF, volatile transit lead times, 350 PPM) |
| Financial Resilience & ESG Compliance | 15% | Altman Z-score balance sheet strength, Scope 3 ESG auditing, cyber security (SOC 2), supply chain labor standards | 85 / 100 (Investment-grade credit, established ESG) | 79 / 100 (Stable financials, emerging Scope 3 reporting) | 88 / 100 (Strong balance sheet, zero long-term debt, certified green factory) | 52 / 100 (Private entity opacity, unverified labor audits) |
| Weighted Composite Score | 100% | Consolidated multi-attribute selection score across all cross-functional stakeholder evaluations | 80.9 / 100 (Rank 3 - High cost, satisfactory quality) | 82.8 / 100 (Rank 2 - Strong alternative, modest cost-out) | 90.9 / 100 (Rank 1 - Optimal balance of TCO savings & low operational risk) | 72.0 / 100 (Rank 4 - Severe supply chain disruption risk) |
Executive Negotiation Strategy: Concession Matrix, Clean-Sheets & BATNA Governance
In strategic sourcing transformations, commercial negotiations must never be treated as subjective haggling or emotional posturing. For executive committees, presenting a structured negotiation strategy demonstrates that the sourcing team possesses complete command over market dynamics, understands the vendor's economic profit drivers, and has codified clear governance boundaries that protect the enterprise from signing unfavorable long-term commitments.
An institutional procurement deck outlines the commercial negotiation strategy through four structured frameworks:
1. Best Alternative to a Negotiated Agreement (BATNA): Establishing an unassailable BATNA is the single most critical source of negotiation leverage. The deck must explicitly document the viable alternatives if primary negotiations stall: transitioning volume to qualified Challenger Vendor A, extending incumbent contracts on month-to-month transitional terms, or insourcing critical operations. If vendors perceive that the buyer has no viable operational alternative, commercial concessions will remain negligible.
2. The Executive Concession Matrix: Professional procurement negotiations operate on the iron law of reciprocal value: 'Never concede a commercial point without obtaining an offsetting concession of equal or greater economic value.' The presentation should include a pre-approved Concession Matrix mapping low-cost, high-value trades. For instance, if a supplier demands shorter payment terms (moving from Net 90 to Net 45 days to optimize their working capital), the procurement team trades that concession for an additional 2.5% unit price rebate or guaranteed consignment inventory ownership on-site.
3. Fact-Based Clean-Sheet Negotiation Trajectories: Armed with bottom-up should-cost engineering models, negotiators do not argue whether prices are 'fair'; they systematically review specific cost variances with the vendor's executive team: 'Your quote models direct machine cycle time at 42 seconds with an hourly overhead rate of $85; our empirical plant teardowns benchmark this operation at 28 seconds and $62 overhead. Let us review the engineering assumptions that drive this $1.2M variance.' This shifts negotiations from adversarial friction to collaborative technical optimization.
4. Executive Walk-Away Boundaries & Approval Escalation Gates: The deck establishes clear financial walk-away thresholds. Any commercial proposal that fails to achieve the target 12% EBITDA savings floor or that attempts to alter fundamental liability, indemnification, or intellectual property terms must be escalated to the CPO and CFO Steering Committee for formal sign-off.
Exhibit 4: Competitive RFP Bid Evaluation, Total Cost of Ownership (TCO) & Negotiation Playbook
Reconciling Contracted Savings to Audited EBITDA: The CFO-Grade P&L Bridge
The single most damaging credibility crisis that corporate procurement organizations face is the perennial 'Procurement Savings Disconnect.' Every year, procurement leaders proudly report tens of millions of dollars in 'negotiated paper savings,' while the Chief Financial Officer and operating business unit heads look at the corporate general ledger and see zero corresponding margin expansion. Where did the money go? It evaporated into volume growth, unbudgeted category scope expansion, supplier price creep on unmanaged items, and maverick off-contract purchasing.
To win unwavering support from CFOs, Audit Committees, and Private Equity Operating Partners, a strategic sourcing presentation must feature a rigorous, audited Cost-Out P&L Reconciliation Waterfall Bridge. This bridge systematically reconciles top-line negotiated contract savings down to verifiable, audited P&L budget reductions across five explicit transition stages:
Stage 1 - Gross Contracted Paper Savings: The headline annualized savings calculated by comparing new negotiated unit prices against the prior 12-month baseline across estimated annual volume.
Stage 2 - Less: Timing Lag & Phased Implementation Ramp: Adjusting gross savings for contract execution dates, tooling lead times, and inventory burn-off of old, higher-priced stock (e.g., a contract signed in June delivers only 5 months of realized cash flow in the current fiscal year).
Stage 3 - Less: Compliance Leakage & Maverick Purchasing Drag: Deducting historical slippage where business unit end-users continue ordering legacy SKUs or non-contracted items through decentralized purchasing channels.
Stage 4 - Less: External Market Index & Commodity Headwinds: Isolating unhedged raw material market increases, statutory labor wage inflation, or foreign exchange currency swings that offset gross commercial price cuts.
Stage 5 - Net Realized EBITDA Impact & Operating Budget De-obligation: The definitive bottom-line savings that flows directly into general ledger EBITDA. Crucially, the deck must document the corresponding 'Budget De-obligation' mechanism: the CFO formally reduces the operating department's baseline spending budget by the exact net savings dollar amount, ensuring the liberated capital cannot be absorbed by discretionary departmental spending.
Sourcing Wave Sequencing & Category Savings Potential Prioritization
Strategic multi-wave portfolio sequencing matrix organizing 16 core enterprise spend categories by addressable spend, implementation velocity, estimated savings % and projected 3-year run-rate EBITDA impact.
| Sourcing Wave | Target Categories | Addressable Baseline Spend ($M) | Implementation Velocity | Estimated Savings Range (%) | Target 3-Year Run-Rate EBITDA Impact ($M) | Key Strategic Focus |
|---|---|---|---|---|---|---|
| Wave 1: Quick Wins & Direct Commodities | Corrugated packaging, bulk freight logistics, commercial fleet leases, standard fasteners | $85.0M | Months 1 - 4 (Rapid) | 12.0% - 16.5% | $11.8M | Leverage electronic reverse auctions, volume pooling across portcos, standard contract templates |
| Wave 2: Complex Indirect & IT Infrastructure | Enterprise SaaS licenses, cloud hosting (AWS/Azure), temporary staffing, corporate telecom | $125.0M | Months 4 - 8 (Medium) | 14.0% - 20.0% | $21.2M | License tier rationalization, FinOps reserved instances, rate card standardization, master MSP agreements |
| Wave 3: Engineered Direct & Specialized Manufacturing | Custom injection molded plastics, stamped metal subassemblies, electronic PCBA manufacturing | $210.0M | Months 8 - 14 (Extended) | 8.0% - 13.5% | $22.5M | Bottom-up clean-sheet should-cost modeling, dual-sourcing qualification, joint supplier value engineering |
| Wave 4: Tail Spend Automation & Professional Services | Marketing agencies, legal advisory, management consulting, localized plant MRO tail spend | $65.0M | Months 14 - 18 (Ongoing) | 15.0% - 22.0% | $11.5M | AI-automated tail spend buying desk, agency rate-card caps, catalog p-card compliance enforcement |
| Total Enterprise Transformation | Comprehensive 16-Category Sourcing Transformation | $485.0M | 18-Month Program | 11.5% - 15.5% (Blended) | $67.0M Run-Rate | Institutional multi-wave transformation delivering sustainable P&L margin expansion |
Multi-Wave Sourcing Execution & Procurement Transformation Office (PTO) Governance
A flawless strategic sourcing presentation does not stop at contract awards; it establishes the governance infrastructure required to guarantee flawless execution, supplier operational onboarding, and multi-year savings persistence. In corporate transformations and private equity holding periods, execution discipline is institutionalized through a dedicated Procurement Transformation Office (PTO) operating under a formal stage-gate governance framework.
The PTO governance model establishes five strict Stage-Gates that every category sourcing team must satisfy before proceeding to the subsequent phase:
Gate 1 - Baseline Spend & Opportunity Charter Sign-off: The category team presents the 12-month addressable spend baseline, market benchmarking data, and project charter. Approval is required from both the CPO and the BU General Manager before engaging external supply markets.
Gate 2 - Sourcing Strategy & Vendor Long-List Approval: The team presents the Kraljic quadrant strategy, TCO evaluation criteria, weighted scoring scorecard, and candidate supplier long-list (typically 8 to 15 vendors). Gate 2 approval authorizes issuance of the formal RFP.
Gate 3 - Shortlist Selection & Negotiation Mandate Sign-off: Following bid normalization and scoring, the team presents the vendor short-list (2 to 3 final bidders) alongside the clean-sheet cost models, concession matrix, and specific BATNA walk-away thresholds. Gate 3 sign-off formally authorizes final commercial negotiations.
Gate 4 - Final Award Recommendation & Contract Execution: The team presents the final negotiated contract, multi-attribute scorecard rankings, legal risk allocation, and detailed implementation timeline. Approval requires joint signatures from the CPO, BU GM, and corporate Legal Counsel.
Gate 5 - Realized Savings Validation & Budget De-obligation: Conducted 90 to 180 days post-implementation, Gate 5 reviews actual general ledger purchase volumes, verifies invoice compliance against contract rate cards, audits supplier OTIF service levels, and confirms the formal CFO budget de-obligation.
By packaging the entire sourcing program into a predictable, transparent stage-gate framework, the presentation assures directors, operating partners, and C-level stakeholders that procurement is operating with world-class fiduciary rigour.
Exhibit 5: P&L Cost-Out Realization & Procurement Transformation Office (PTO) Governance Cadence

Procurement Transformation Office (PTO) Implementation & Savings Capture Checklist
Production-Ready AI Prompt Recipe: Strategic Sourcing & Category Review Presentation
Role: Senior Operations Practice Leader & Global Strategic Sourcing Director Context: [object Object] Task: Draft a comprehensive, executive-ready Strategic Sourcing & Category Cost-Out Presentation for an Executive Committee and CFO review.
Common Procurement Presentation Pitfalls & Executive Delivery Guidelines
Even analytically rigorous sourcing programs frequently stall during executive presentations due to preventable communication failures. Senior leadership teams, board directors, and private equity partners evaluate procurement decks with high scrutiny; any perceived misalignment between purchasing goals and core business strategy will trigger skepticism. To ensure seamless executive buy-in, avoid these five classic pitfalls:
Pitfall 1: Reporting Theoretical Savings Instead of P&L Realization: Never present gross 'negotiated rate reductions' as accomplished facts without demonstrating the exact P&L accounting line where the savings will emerge and how operating budgets will be reduced. CFOs view un-reconciled savings as accounting fiction.
Pitfall 2: Treating Operations as Hostile Bystanders: Procurement transformations fail when category teams conduct RFPs in a vacuum and present newly selected vendors to plant managers or engineering leads as a fait accompli. The deck must showcase cross-functional governance, proving that technical leads evaluated supplier samples, approved specifications, and co-designed cutover plans.
Pitfall 3: Underestimating Supplier Switching Friction & Tooling Lead Times: Demanding aggressive transition timelines without accounting for production part approval processes (PPAP), mold re-tooling, or customer re-certification creates severe production shutdown risks. The executive roadmap must clearly illustrate conservative buffer periods, parallel production runs, and dual-facility safety stock.
Pitfall 4: Neglecting Geopolitical & Supply Chain ESG Vulnerabilities: Presenting low-cost offshore bids that optimize nominal unit costs while exposing the enterprise to single-point choke points, trade embargoes, or forced-labor compliance penalties destroys enterprise value. Always pair commercial bids with comprehensive supply chain resilience and ESG audits.
Pitfall 5: Cluttered Visual Formatting & Passive Headings: Executive audiences do not read dense paragraph blocks on slides. Replace generic labels like 'Category Overview' or 'Supplier Bids' with bold, informative action titles: 'Consolidating Corrugated Packaging from 14 Suppliers to 2 Strategic Partners Captures $4.2M in Scale Discounts While Raising OTIF to 98.5%.' Use structured visual cards, clean comparison tables, and prominent data callouts.
Strategic Sourcing & Executive Procurement Presentation FAQ
How do you distinguish between addressable and non-addressable spend in an executive presentation?
In executive decks, clearly define addressable spend as external commercial expenditures where competitive market alternatives, commercial renegotiations, or demand management can legally and operationally influence pricing or consumption. Non-addressable spend encompasses statutory taxes, government regulatory fees, intercompany transfers, debt service, charitable contributions, and regulated utility monopolies with legally mandated tariffs. Explicitly separating non-addressable spend upfront prevents executive debates over un-actionable balance sheet line items.
What is the difference between strategic sourcing and traditional procurement?
Traditional purchasing is reactive, transactional, and operational—focused on executing purchase orders, processing invoices, and ensuring immediate material availability at quoted catalog prices. Strategic sourcing is proactive, analytical, and enterprise-wide—evaluating total lifecycle spend, analyzing global supply market structures, conducting clean-sheet should-cost modeling, executing competitive multi-attribute RFPs, and restructuring supplier relationships to maximize long-term EBITDA and supply chain resilience.
How do you present the Kraljic Matrix effectively to non-procurement executives?
Introduce the Kraljic Matrix as a portfolio investment allocation tool rather than procurement jargon. Explain that the matrix prevents two equal and opposite corporate errors: treating mission-critical sole-source partners with transactional hostility, and treating commoditized leverage suppliers with passive complacency. Use clear real-world examples from the company's own operations to populate each of the four quadrants, illustrating why distinct negotiation strategies are deployed for each.
Why do CFOs frequently distrust reported procurement cost savings, and how do you solve it?
CFOs distrust procurement savings because reported figures often represent theoretical rate card discounts that fail to appear in audited general ledger EBITDA due to volume growth, maverick spending, or unbudgeted scope creep. Solve this by presenting an audited Cost-Out P&L Waterfall Bridge that reconciles gross negotiated savings down to net realized EBITDA, and explicitly partner with FP&A to execute formal departmental budget de-obligations following contract execution.
When should an enterprise deploy electronic reverse auctions versus traditional RFP negotiations?
Deploy reverse auctions exclusively in the Leverage quadrant where product or service specifications are completely standardized, multiple pre-qualified suppliers (minimum 4 to 6) possess verified excess production capacity, switching friction is minimal, and the award volume is guaranteed. Never deploy reverse auctions on custom-engineered components, Bottleneck categories, or complex professional services where quality, innovation, and long-term partnership outweigh immediate price cuts.
How should supplier risk and ESG compliance be incorporated into vendor selection presentations?
Incorporate supplier resilience directly into the weighted multi-attribute selection scorecard, allocating 15% to 25% of total evaluation weighting to operational resilience, Altman Z-score financial solvency, cybersecurity (SOC 2), geographic multi-facility redundancy, and ESG supply chain compliance (Scope 3 reporting, labor standards). Presenting quantitative risk scores alongside commercial price proposals protects executive decision-makers from hidden downstream supply chain liabilities.
What governance structure ensures that negotiated sourcing savings persist over multi-year holding periods?
Sustained savings capture requires a Procurement Transformation Office (PTO) operating with a stage-gate review cadence, automated ERP dual-signoff purchase controls that prevent off-contract maverick purchasing, quarterly business reviews (QBRs) enforcing supplier SLA compliance, and an annual index-adjustment audit that verifies raw material pass-through formulas against public market benchmarks.
Transform Raw Spend Data into Executive-Ready Sourcing Presentations with XLSlides
Stop spending countless hours wrestling with clunky ERP spreadsheets and rebuilding manual PowerPoint category decks. XLSlides empowers Chief Procurement Officers, operations consultants, and category leaders to convert unstructured spend cubes, supplier RFP scorecards, and clean-sheet cost models into polished, consultant-grade presentations in seconds.
Methodology And Sources
- Assessment of Excellence in Procurement (AEP) & The 7-Step Sourcing Methodology(Kearney (A.T. Kearney) • 2024)
Foundational empirical research on strategic sourcing methodologies, procurement maturity benchmarking, and cross-functional category governance.
- Procurement 2030: Supply Chain Resilience, Generative AI, and Category Value Creation(McKinsey & Company • 2024)
Executive analysis on digital spend analytics, clean-sheet should-cost modeling, and strategic procurement operating models.
- Purchasing Must Become Supply Management (The Kraljic Portfolio Matrix)(Harvard Business Review (Peter Kraljic) • 1983)
The seminal foundational management framework establishing the 2x2 Supply Risk vs. Profit Impact category segmentation model.
- Global Sourcing and Supplier Relationship Management Professional Standards(Chartered Institute of Procurement & Supply (CIPS) & Institute for Supply Management (ISM) • 2023)
Global industry standards for multi-attribute RFP bid normalization, ethical sourcing compliance, and vendor SLA management.
- Magic Quadrant for Strategic Sourcing Application Suites & Sourcing Optimization(Gartner Research • 2024)
Industry research evaluating advanced e-sourcing platforms, reverse auctions, spend cube analytics, and supplier risk governance tools.