Direct Answer: What A Target Operating Model Presentation Must Do
A target operating model presentation should make one thing clear to an executive audience: how the business will actually work differently after the strategy is approved. That means the deck cannot stop at ambition, org charts, or a list of workstreams. It has to convert strategy into choices about roles, decision rights, process ownership, governance, technology support, service levels, and measurable operating outcomes. If the audience finishes the meeting still asking who decides what, which capabilities move first, or how performance will be tracked, the presentation has not done its job.
Serious target operating model decks are usually requested when leadership is about to change how revenue teams, delivery teams, shared services, functions, or business units interact. The audience may be a CEO and CFO deciding whether to fund the shift, a transformation steering committee aligning on design principles, a private equity operating team pushing for margin improvement, or a post-merger sponsor deciding what the combined model should look like. In each case, the deck has to connect the model to economics and execution, not just to structure.
This is a strong XLSlides use case because operating model work produces messy source material: interview notes, org charts, RACI drafts, process maps, meeting transcripts, design principles, scorecards, and conflicting executive comments. The bottleneck is rarely content creation alone. The bottleneck is turning those fragments into answer-first slides that show the operating choices, the implications, the sequencing, and the asks in a format that senior leaders can review quickly and still edit.
Target Operating Model Deck Vs. Strategy Deck Vs. PMI Deck Vs. Org Design Readout
These presentations often sit in the same program, but they answer different questions. A target operating model deck is the bridge between ambition and execution reality.
| Document | Primary Audience | Main Job | Common Failure Mode |
|---|---|---|---|
| Strategy deck | CEO, board, strategy lead, business sponsor | Explain where the business should play and how it plans to win | Stops at market logic without defining how the organization must change |
| Target operating model deck | COO, CFO, transformation office, executive sponsor, workstream leaders | Define how work, governance, capabilities, and accountability should operate in the future state | Looks like an org chart exercise with no performance logic or transition path |
| PMI deck | Integration office, sponsor, operating partner, steering committee | Translate a signed transaction into Day 1, Day 100, and year-one execution | Focuses on activity tracking without clarifying the future-state model being built |
| Org design readout | HR, business unit leads, leadership team | Explain role design, spans, layers, and reporting lines | Treats the people structure as the whole answer rather than one part of the operating model |
Capability Stack And Workstream Coverage Reference
Target Operating Model Deck Takeaways
- A target operating model presentation is a decision document about how the business should run, not a decorative transformation update.
- The strongest decks define design principles, capability ownership, decision rights, governance cadence, and measurable outcomes before they show implementation detail.
- Executives will challenge the model on economic logic, accountability, sequencing, and risk, so the deck must make those answers visible early.
- AI is most useful when it converts fragmented workshop material into an editable first draft with action titles, structured scorecards, and cleaner executive flow.
Why Executives Ask For A Target Operating Model Deck
Leadership teams ask for target operating model presentations when the current way of working can no longer support the strategy. Sometimes the trigger is growth and complexity: the company added products, regions, or channels and now decisions are too slow. Sometimes the trigger is margin pressure: shared services, planning routines, or operating handoffs have become expensive and inconsistent. Sometimes the trigger is a transaction or transformation: two organizations must converge on one way of operating, or a new digital platform requires teams to behave differently.
In all of those situations, the executive audience is asking a sharper question than teams often realize. They are not merely asking what the future org chart looks like. They are asking whether the future model will improve speed, clarity, cost discipline, customer experience, risk control, or scalability enough to justify the disruption of change. A presentation that only shows future-state boxes will feel incomplete because it skips the performance case.
That is why useful TOM decks usually combine operating logic with governance and economics. They show what decisions move closer to the front line, which capabilities become centralized, where shared services or centers of excellence sit, what metrics prove the model is working, and which choices need to be made before implementation begins. The deck is the artifact that turns a vague phrase like operating model redesign into an explicit management contract.
The Design Choices A Serious TOM Deck Has To Settle
Most operating model presentations become clearer when they are framed as a finite set of management choices instead of an endless list of workshop outputs.
| Design Choice | What The Deck Must Clarify | Why Executives Care |
|---|---|---|
| Customer and business-unit interface | Which teams own demand, relationship management, delivery, and escalation | This determines accountability at the revenue and service edge |
| Process ownership | Which role owns end-to-end workflows instead of only local steps | Cross-functional friction usually lives here |
| Decision rights | Which decisions sit in the business, shared services, center of excellence, or corporate layer | It prevents endless approval loops and role confusion |
| Capability placement | Which capabilities are centralized, federated, embedded, or outsourced | This drives cost, quality, speed, and talent leverage |
| Governance cadence | Which forums govern performance, risk, prioritization, and exceptions | Without cadence the model degrades into local improvisation |
| Metrics and incentives | Which KPIs and incentives reinforce the intended behavior | The model fails if measurement still rewards the old way of working |
Inputs To Gather Before You Draft The TOM Story
Functional Spine And Shared-Services Reference
Recommended 12-Slide Target Operating Model Sequence
| Slide | Purpose | Executive Question Answered |
|---|---|---|
| Executive summary | State the future-state model, expected benefits, and key decisions | What are we changing and why does it matter? |
| Current-state problem statement | Show the few operating failures that justify redesign | Why can the current model no longer support the strategy? |
| Design principles | Make the future-state rules explicit | What criteria are guiding the choices? |
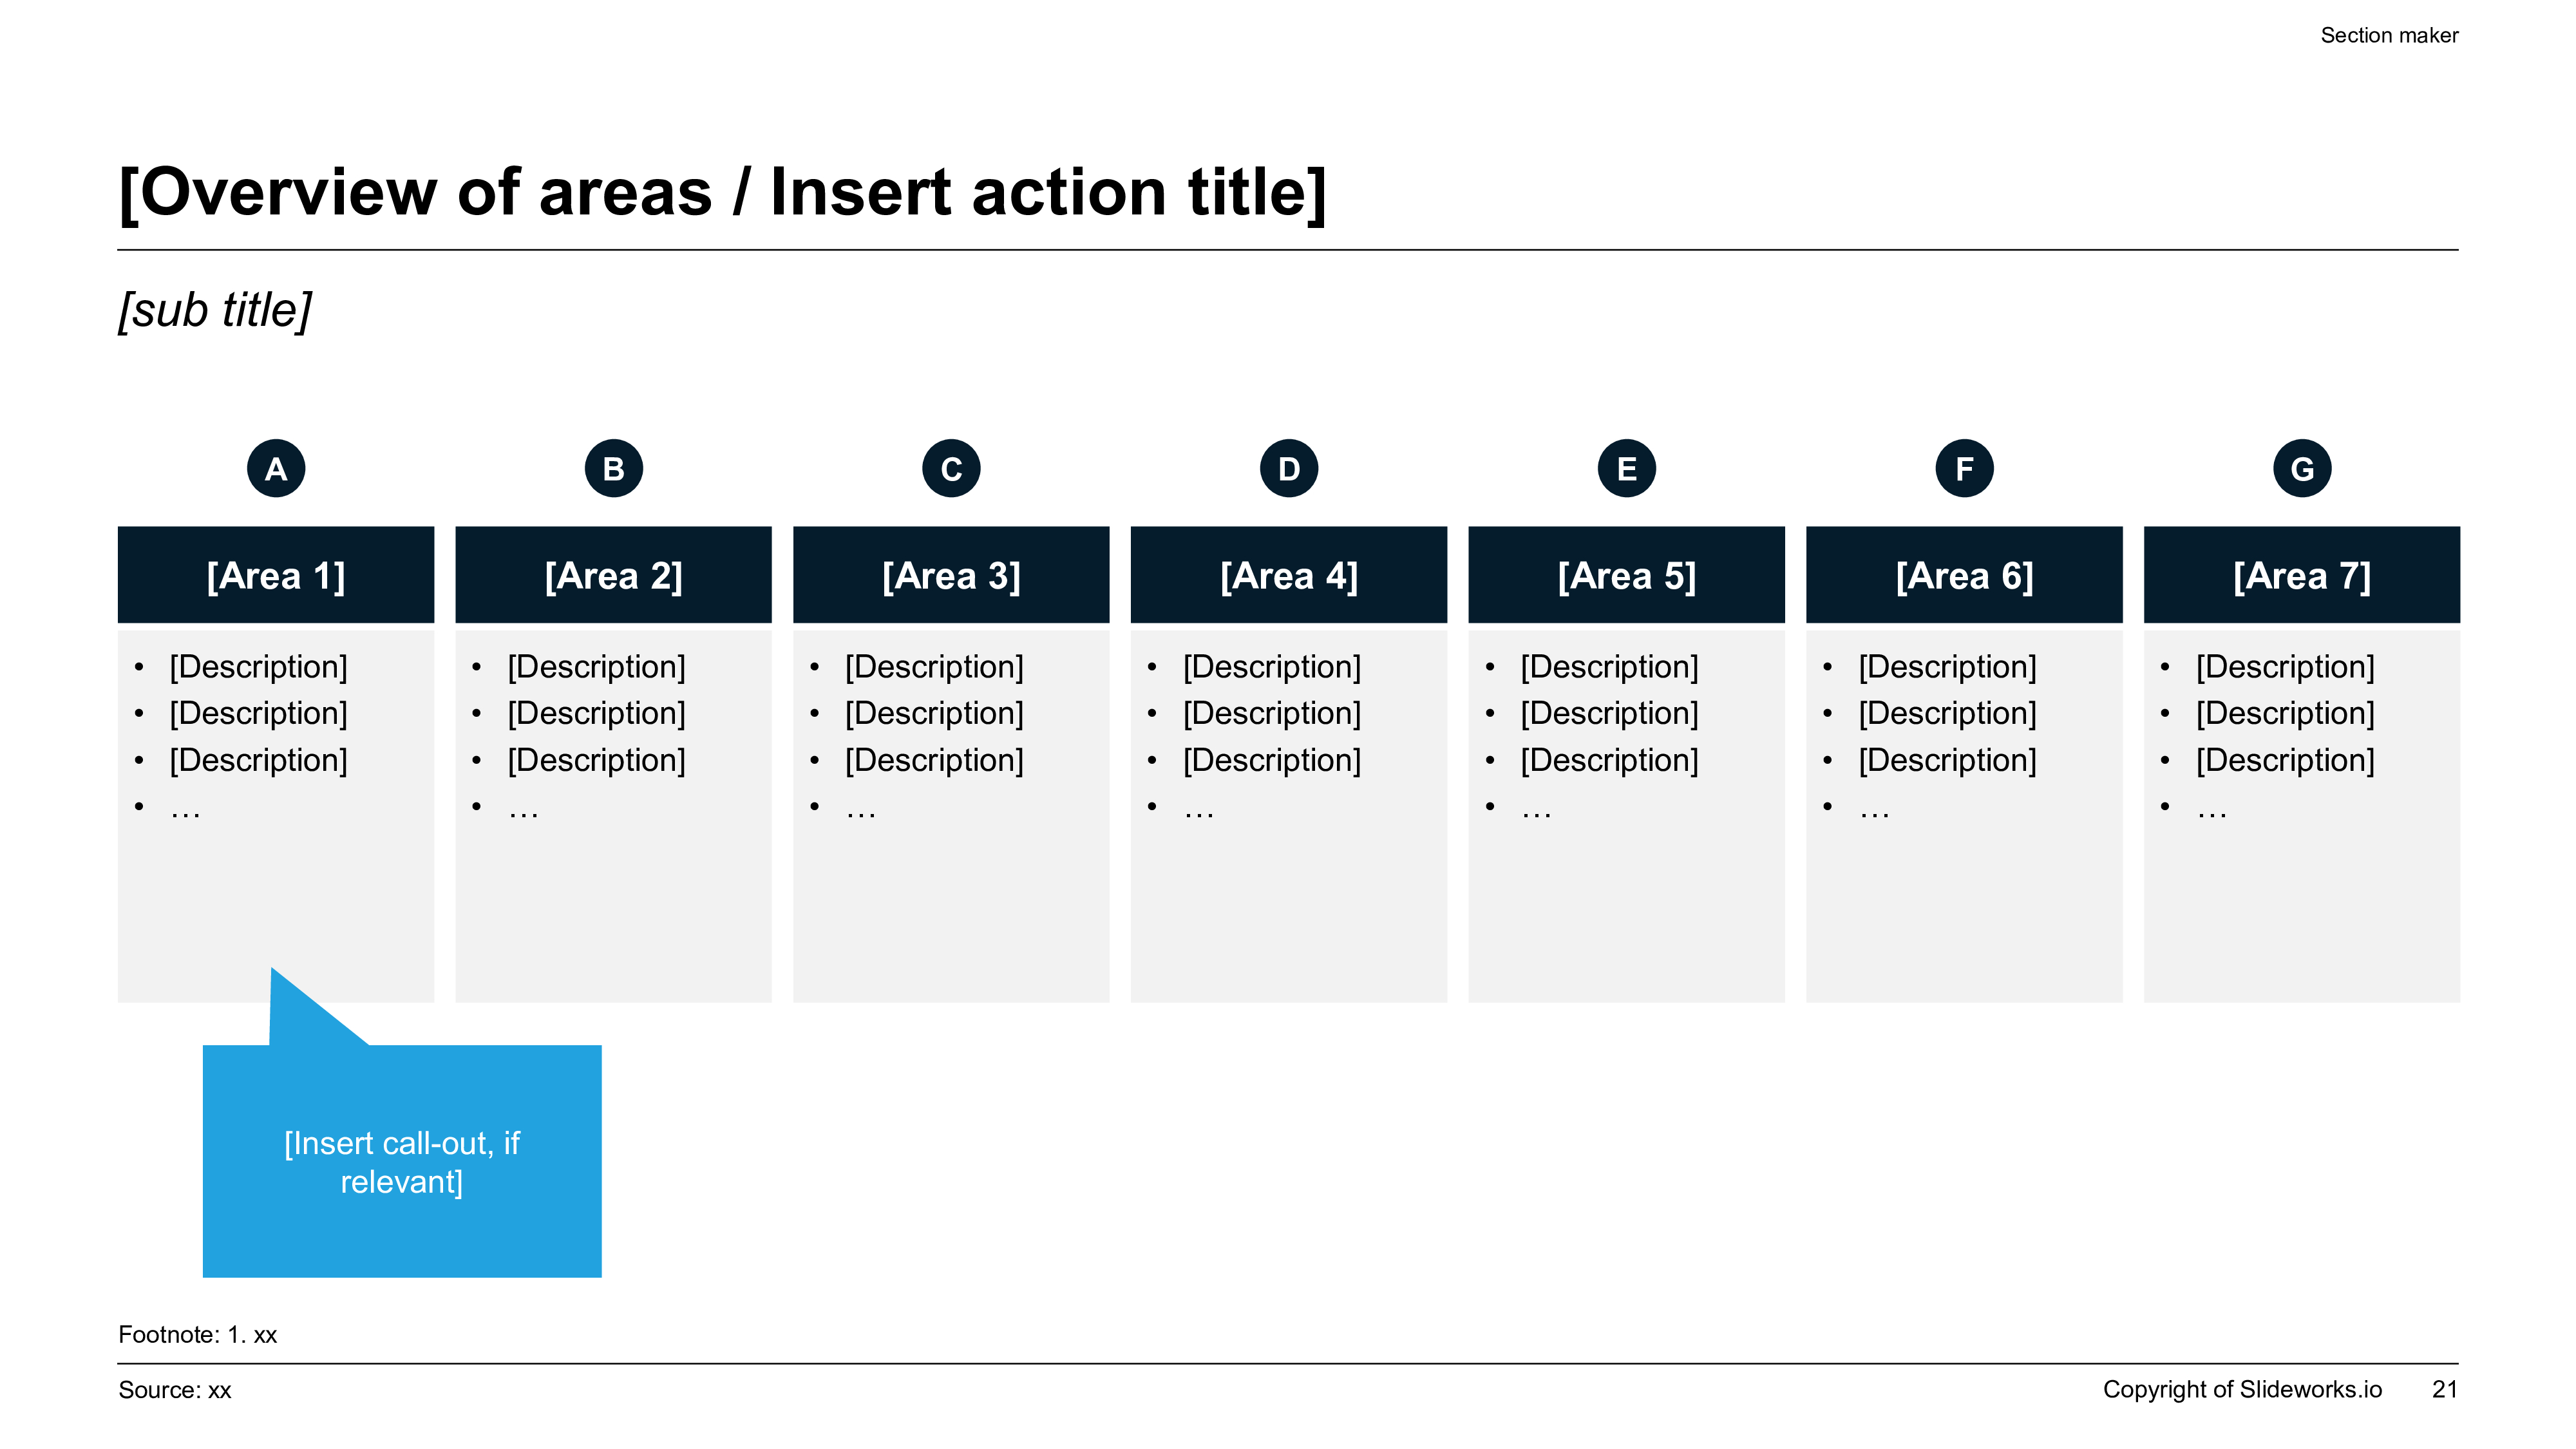
| Future-state operating model overview | Show the integrated model across functions and interfaces | What will the target model actually look like? |
| Capability placement | Clarify which capabilities are centralized, embedded, or shared | Where does key work live? |
| Decision rights and governance | Define forums, owners, and escalation paths | Who decides what and how are conflicts resolved? |
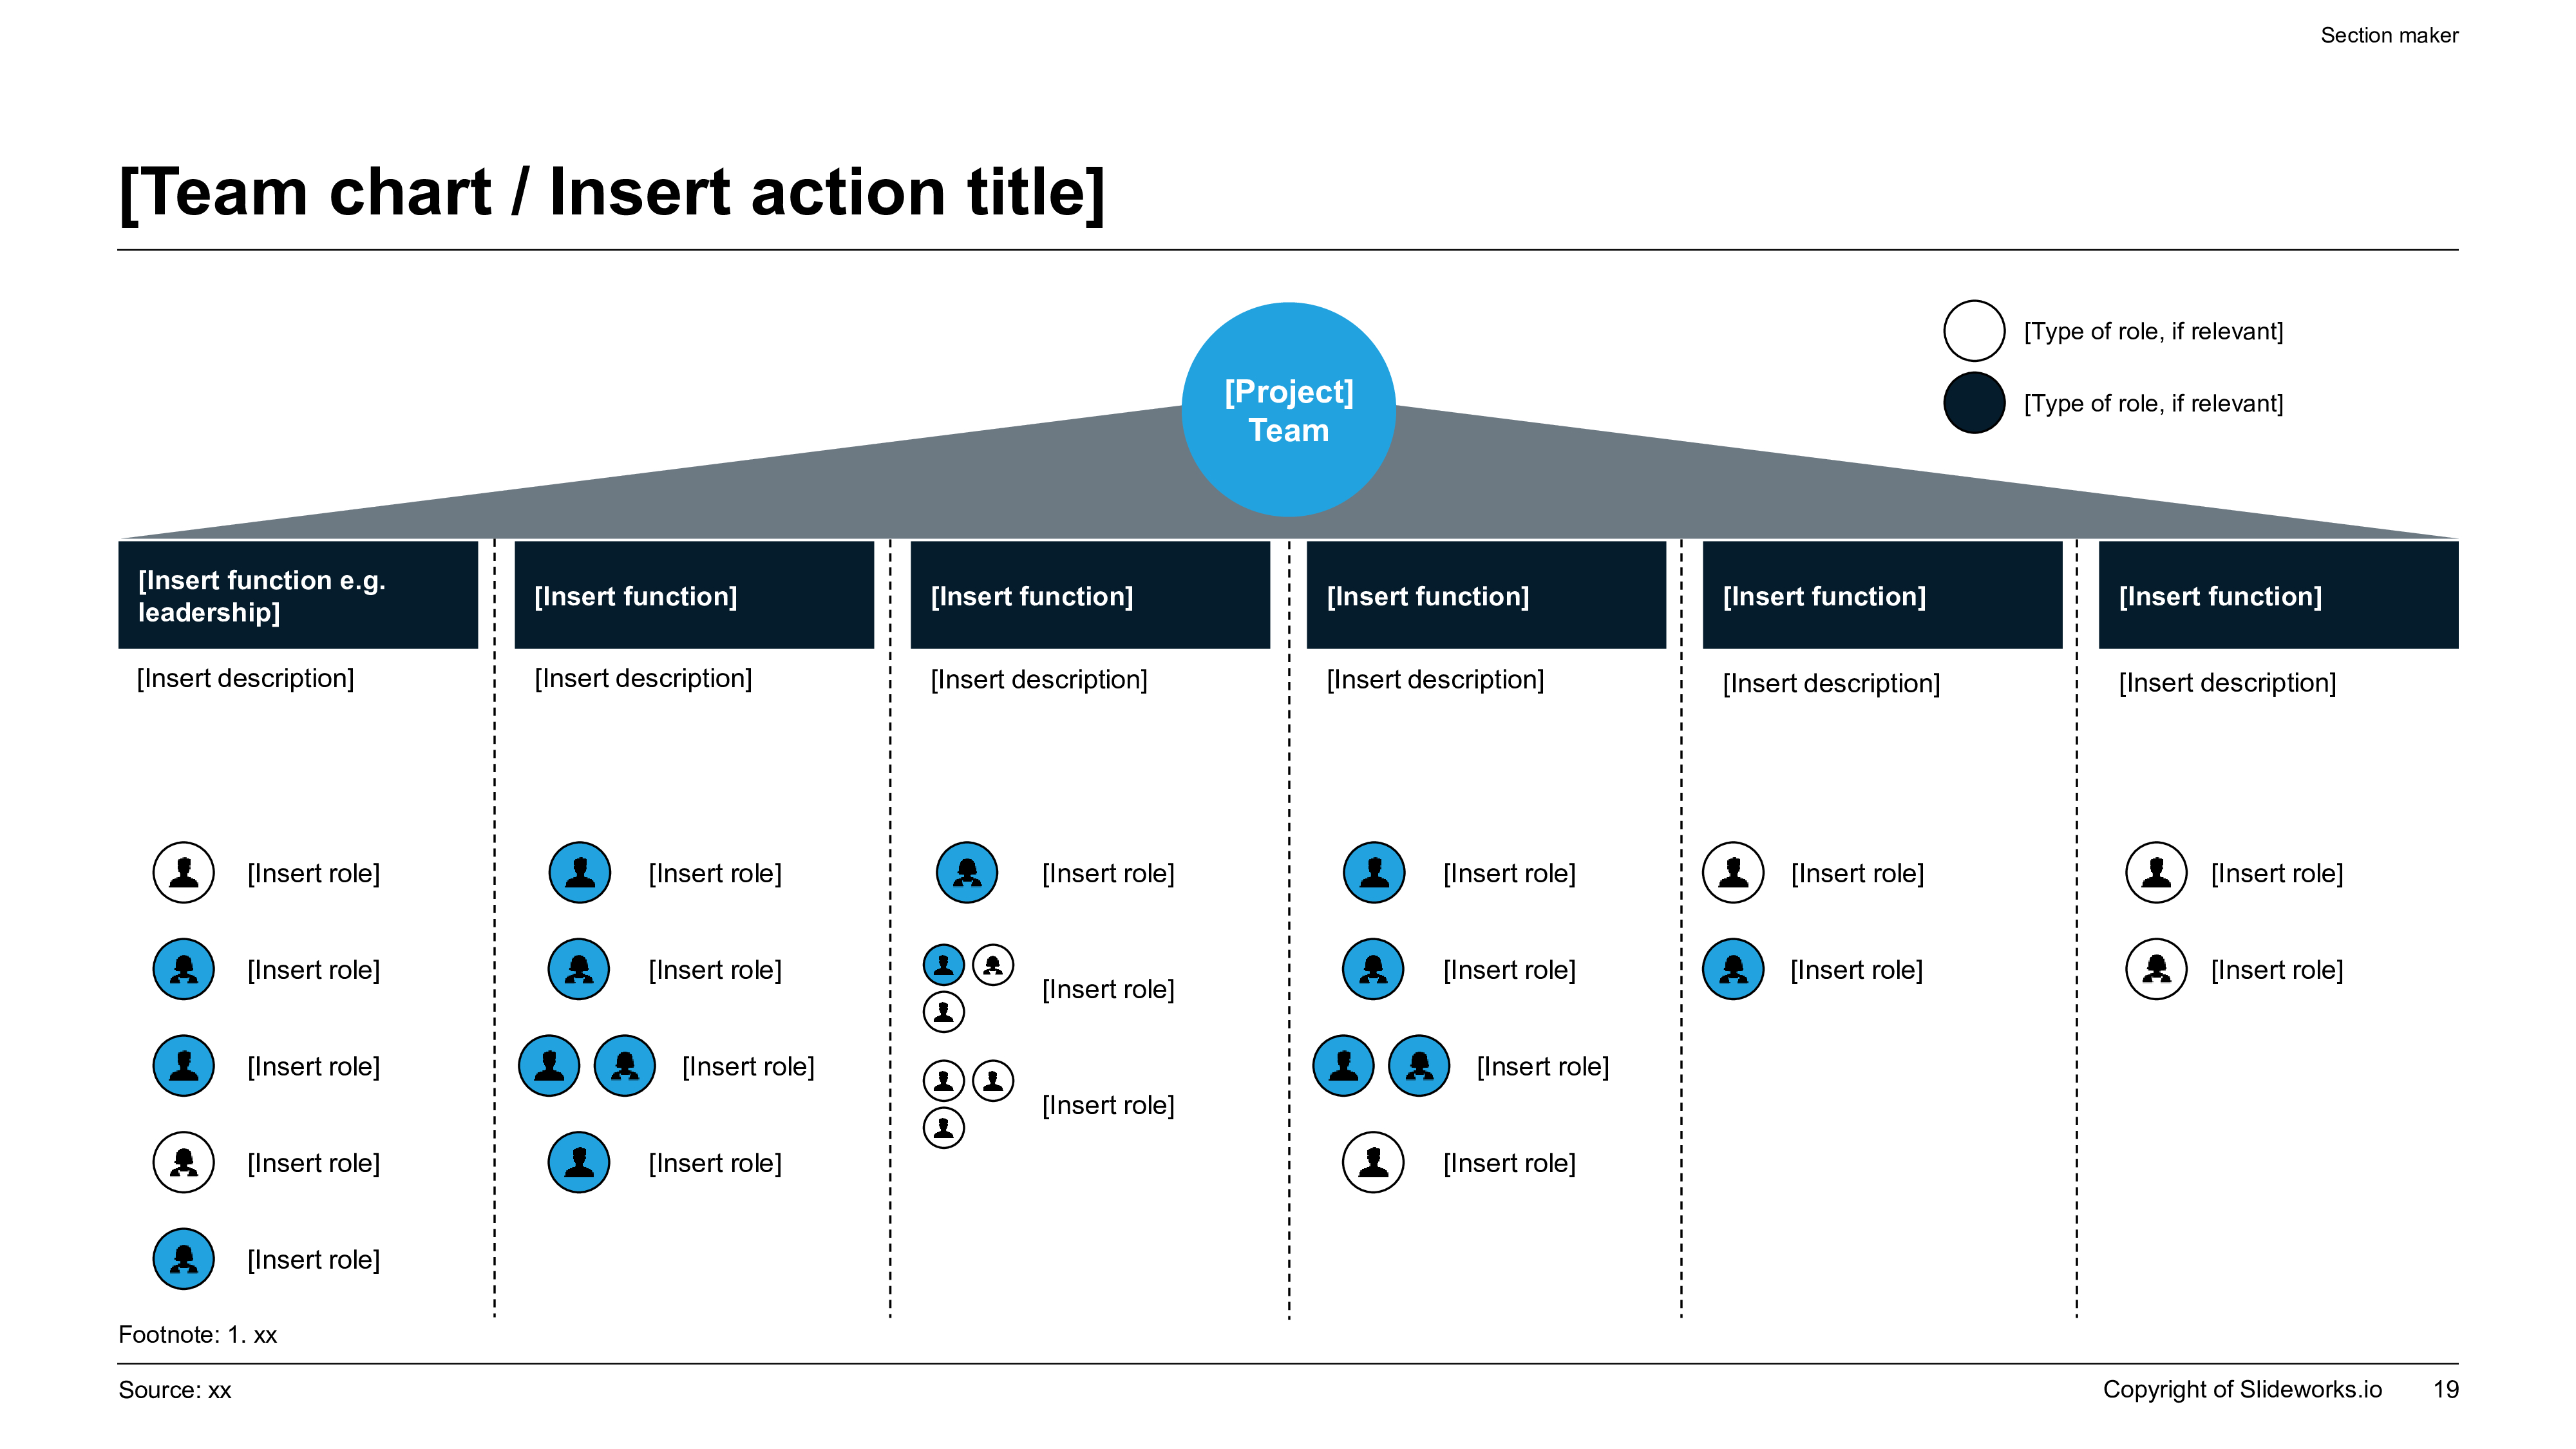
| Role and org implications | Translate the model into accountabilities, leadership spans, and talent needs | What changes for people and management layers? |
| Process and handoff changes | Show how core workflows move through the new model | How will work actually flow differently? |
| Technology and data enablers | Identify systems, data, and reporting dependencies | What must be true for the model to function? |
| Benefits and KPI scorecard | Show the economic and service outcomes expected | How will we know the redesign is working? |
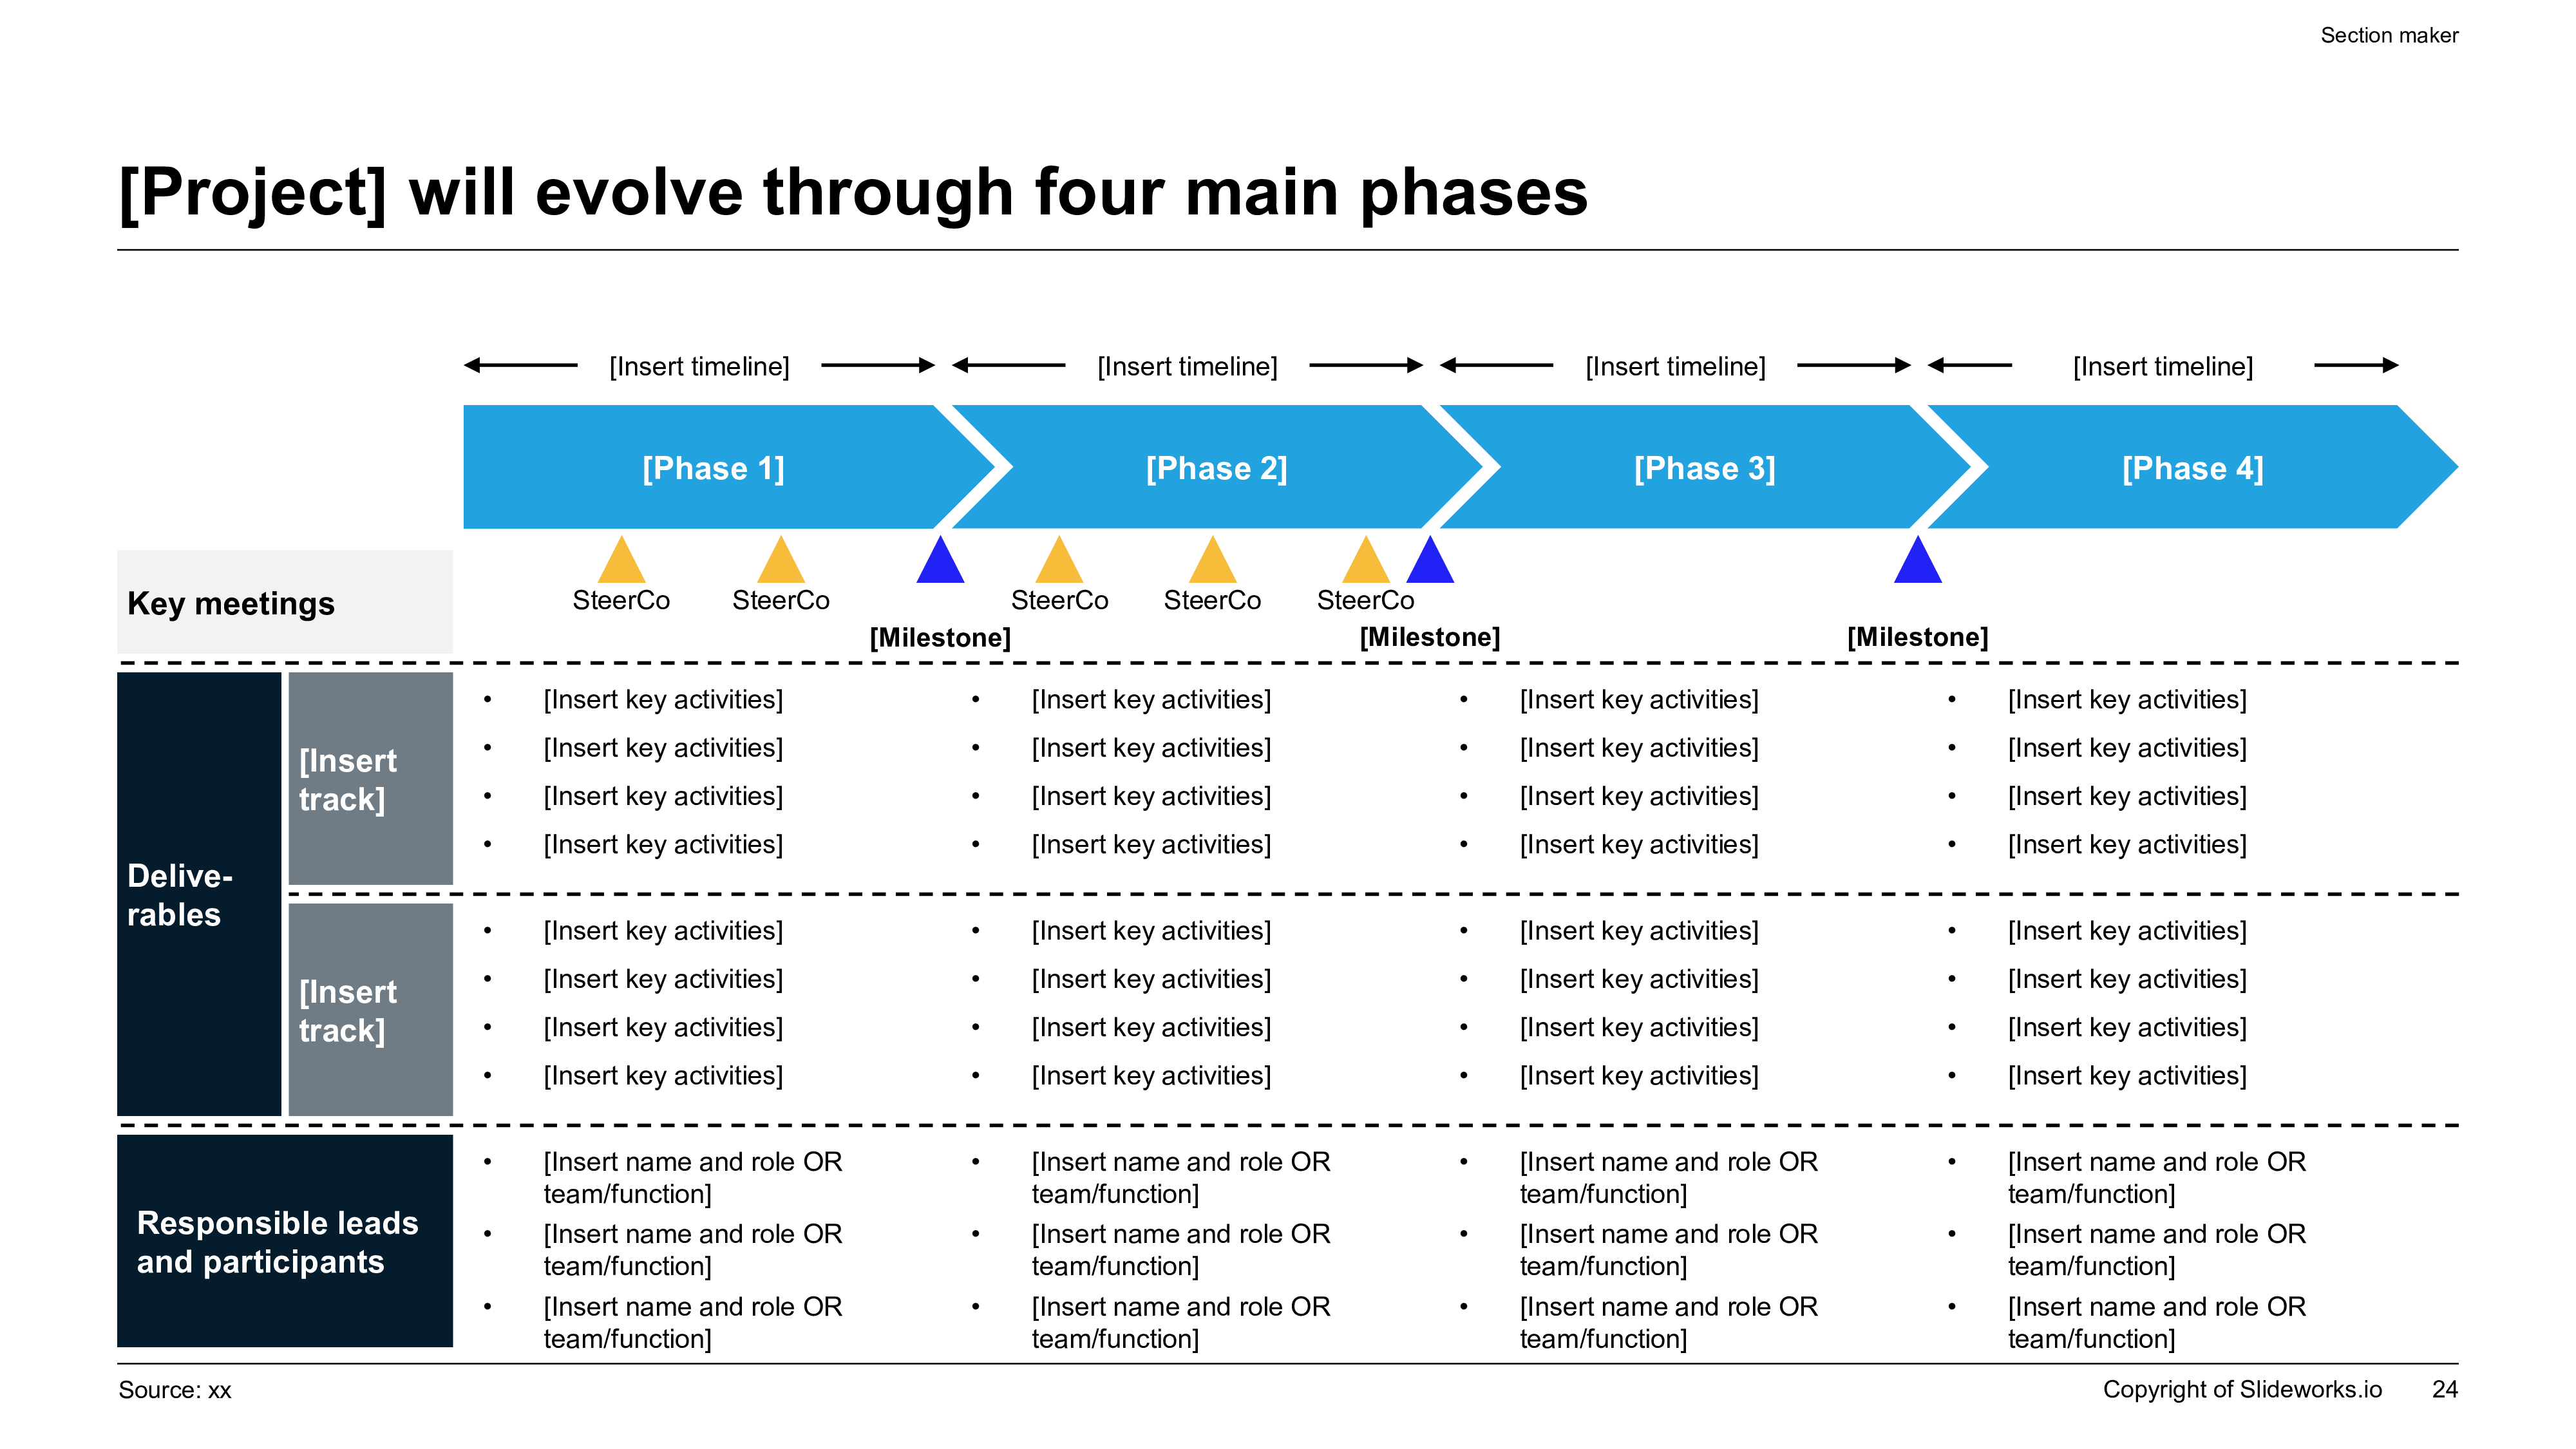
| Transition roadmap | Sequence the implementation waves and key milestones | How do we get there without disrupting the business? |
| Decision requests and next steps | State approvals, open issues, and owner actions | What must leadership approve now? |
Where Most Operating Model Presentations Lose The Room
Many target operating model decks lose credibility because they show too much design output and too little management judgment. The team presents every workshop artifact, every possible capability grouping, and every version of the org chart. Executives do not need to relive the workshop. They need to understand the recommended model, the alternatives that were rejected, the tradeoffs involved, and the consequences of acting or not acting.
Another frequent problem is false neatness. The slides imply the model is settled even though key decisions about funding, governance, service levels, or technology ownership are still unresolved. Senior audiences usually prefer explicit uncertainty over hidden uncertainty. A deck that says two governance options remain open, and explains the tradeoff between them, is far more credible than a deck that pretends the answer is obvious when it is not.
The third failure mode is forgetting transition reality. Teams often show the target state as though the business can teleport into it. But operating model changes usually run into platform limitations, leadership capacity, legacy metrics, and political resistance. If the presentation does not show how the future state will be sequenced and governed, the audience will treat it as conceptual rather than executable.
Prompt Recipe For A Target Operating Model Presentation
Create a target operating model presentation for [company or business unit] aimed at [CEO/CFO/COO/steering committee]. The business is trying to solve [current-state problems] while pursuing [strategy or value goal]. Build an answer-first deck that includes executive summary, current-state pain points, design principles, future-state operating model overview, capability placement, decision rights and governance, role implications, process changes, technology and data enablers, KPI scorecard, transition roadmap, top risks, and leadership asks. Use consulting-style action titles, make tradeoffs explicit, and keep the structure editable for PowerPoint-style review.
Action Title Rewrite Matrix For Operating Model Slides
A target operating model deck reads better when each slide headline states the operating implication rather than the topic label.
| Weak Topic Title | Executive Action Title | Why The Rewrite Works |
|---|---|---|
| Operating model | The future model centralizes standards while keeping customer decisions close to the business | It explains the structural choice and the intended balance |
| Governance | Three forums will remove most approval bottlenecks without adding another management layer | It links governance design to a concrete outcome |
| Capabilities | Analytics, planning, and pricing should sit in one shared capability hub to reduce duplicate work | It tells leadership what should move and why |
| Process changes | Quote-to-cash handoffs will shrink from five approvals to two under the target workflow | It makes the improvement measurable |
| Roadmap | The model should launch in two waves because data and role design can stabilize before systems migration | It turns timing into a defended sequencing choice |
| Metrics | Service quality, span of control, and decision cycle time are the earliest signals that the model is working | It shows what leadership should watch after launch |
MECE Operating Model Decomposition Reference
How To Turn A Box-And-Wire Diagram Into A Decision Document
The box-and-wire diagram is usually the least persuasive slide in an operating model deck when it stands alone. It can show reporting relationships or capability placement, but it rarely explains why the model is superior or what tradeoffs it imposes. To become useful, the diagram needs narrative around it: which decisions move, which interfaces simplify, where governance tightens, which roles gain or lose scope, and how the design supports customer or financial outcomes.
A practical way to improve the page is to pair every structural choice with one operational consequence. If planning moves into a shared hub, what improves: forecast consistency, resource leverage, or scenario speed? If commercial decisions move closer to the business, what guardrails prevent pricing chaos? If technology ownership is centralized, what local flexibility is intentionally lost? Those are the questions executives ask even if they are not written on the slide.
This is also where consultants and transformation teams should be disciplined about alternatives. A good TOM presentation does not imply that one structure is inevitable. It shows that the team considered at least two or three plausible models and selected one because it best matched the design principles, economics, risk tolerance, and change capacity of the organization.
Decision Rights And Governance Blocks That Belong In The Main Story
If governance is buried in appendix pages, the audience will assume the model is not yet real.
| Governance Block | What To Show | Why It Matters |
|---|---|---|
| Strategic direction forum | Who sets direction, approves model shifts, and resolves cross-business conflicts | It anchors accountability at the sponsor level |
| Performance cadence | Monthly or quarterly forums, KPI owners, and escalation thresholds | It keeps the model tied to measurable outcomes |
| Service-level governance | How business units and shared teams manage demand, priorities, and service expectations | It prevents shared services from becoming a black box |
| Investment and prioritization forum | Who approves capability investments, sequencing, and tradeoffs | The model will drift if investment logic is unclear |
| Risk and controls layer | Finance, compliance, data, and policy requirements built into the model | It shows the redesign can survive audit and control scrutiny |
| Exception handling | Which issues escalate, how quickly, and to whom | This is where operational friction often becomes visible first |
Questions A CFO, COO, Or Steerco Will Push Back On
Transformation Milestone Roadmap Reference
What AI Should Automate In An Operating Model Workflow
AI should automate the parts of the operating model workflow that are time-consuming but not inherently executive. It can cluster interview themes, convert workshop notes into capability buckets, draft action-title options, summarize current-state pain points, standardize scorecards, and turn a rough design readout into a more coherent first-pass deck. That is valuable because TOM programs often waste senior time reformatting and rewriting instead of pressure-testing the actual design.
What AI should not own is the judgment about which governance tradeoff is acceptable, whether the business can absorb centralization now, how much control should sit with corporate versus the front line, or whether the economic assumptions are truly defensible. Those decisions need sponsor ownership because they depend on context, politics, talent reality, and risk appetite. AI can help surface the choices. It cannot sign off on them.
The right XLSlides promise is therefore practical rather than magical. It helps strategy and transformation teams move from messy materials to a PowerPoint-ready operating model draft faster, with clearer structure and more disciplined wording. Human review still determines whether the model is strategically right, operationally feasible, and politically workable.
Metrics That Prove The Model Is Working After Launch
A target operating model is not finished when the slide deck is approved. It is finished when the behavior, quality, and economics start to move.
| Metric Block | Sample KPI | What It Indicates |
|---|---|---|
| Decision speed | Cycle time for pricing, hiring, investment, or exception approvals | Whether governance simplified or added friction |
| Service quality | Internal SLA attainment, rework rate, and backlog age | Whether shared capabilities are actually delivering value |
| Cost discipline | Run-rate savings, management-layer cost, or duplicate-role reduction | Whether the model is producing the expected economics |
| Front-line effectiveness | Revenue productivity, conversion, case resolution, or customer wait time | Whether the model helps the business edge perform better |
| Control health | Forecast accuracy, policy exceptions, close quality, or audit findings | Whether the redesign preserved necessary governance |
| Adoption and behavior | Forum attendance, RACI adherence, and manager satisfaction | Whether teams are actually operating in the new way |
Capability Prioritization Portfolio Reference
Short Answers To Common Target Operating Model Questions
What should be on the first slide of a target operating model presentation?
The first slide should state the future-state operating model in one sentence, the business problem it solves, the expected performance benefits, the biggest open tradeoff, and the exact decision leadership needs to make. Executives should understand the operating implication before they reach the detail pages.
How is a target operating model deck different from an org chart presentation?
An org chart presentation shows reporting lines. A target operating model deck explains how work is meant to flow, where capabilities sit, how decisions are made, how governance works, what metrics change, and why the model is better for strategy execution. The org chart is one exhibit, not the whole story.
How detailed should a TOM presentation be?
The main story should stay at executive altitude and focus on the few design choices that drive value, speed, control, and accountability. Detailed RACI tables, process maps, and local role lists usually belong in appendices or supporting packs unless a specific decision depends on them.
Can AI create a credible target operating model deck?
Yes, if the team uses AI to structure material, draft clearer headlines, and assemble an editable first pass. The final model still needs human judgment on tradeoffs, economics, political feasibility, and execution risk. XLSlides is most useful as the drafting and formatting layer, not as the sponsor making the operating choices.
Final Readout Standard Before The Deck Goes To Leadership
Draft The Operating Model Deck In XLSlides
Use XLSlides to turn workshop notes, design principles, org options, capability maps, governance drafts, and scorecard assumptions into an editable target operating model presentation with answer-first structure, action titles, and executive-ready visuals.
Generate TOM Deck