Professional Post-Merger Integration (PMI) Roadmap Templates

Stop wasting hours on manual formatting. Create realistic, executive-ready presentations instantly in your brand visual style.

Synergy realization trackers
Systems consolidation roadmaps
Cultural alignment frameworks

1What is a Post-Merger Integration (PMI) Roadmap?

The Post-Merger Integration (PMI) Roadmap is a highly structured, analytical framework designed to govern the complex transition that occurs when two distinct corporate entities merge their operations, systems, cultures, and strategies. In high-stakes investment banking, corporate development, and private equity transactions, the PMI roadmap serves as the central blueprint that converts deal model assumptions into real-world operational results. Unlike standard project management plans, an executive-level PMI roadmap enforces a rigid logical progression, ensuring that every operational workstream is aligned with the core synergy thesis. The roadmap outlines a unified operational narrative, detailing how functional departments—such as information technology, finance, legal, sales, and human resources—will synchronize their efforts under a consolidated management structure. By utilizing this structured planning blueprint, corporate leadership teams and advisory partners can eliminate formatting drift and communication gaps, ensuring that all stakeholders have absolute clarity on target operating models and synergy capture timelines throughout the transaction lifecycle.
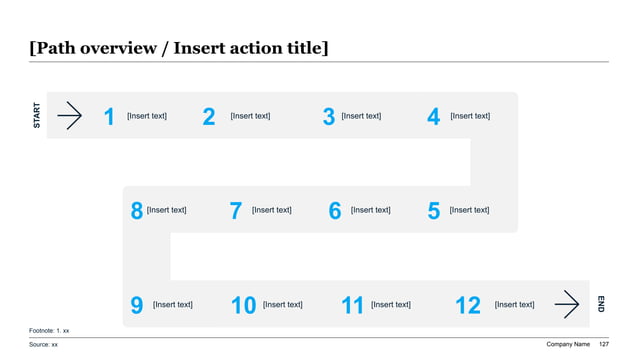
A premium 12-step winding serpentine process roadmap slide featuring a continuous light-grey winding S-curve track container embedded with bold light-blue step numbers 1 to 12.
Template Design LayoutProfessional Post-Merger Integration (PMI) Roadmap Templates

2Ideal Audience: Who is this template built for?

This premium presentation template is explicitly engineered for high-intent business professionals who present complex integration plans to board directors, private equity sponsors, or corporate steering committees. The primary target demographics include management consultants, strategy analysts, Operations Directors, Chief Strategy Officers (CSOs), and corporate development partners who operate in high-pressure transaction environments. These professionals require high-density, authoritative slide layouts that convey deep analytical rigor and systematic thoroughness, matching the strict standards of McKinsey, BCG, and Bain partners. Strategy directors and Integration Management Office (IMO) leads use this structured standard to report weekly integration progress, resource allocation shifts, and risk mitigation strategies to C-suite decision-makers. By leveraging this pre-configured template, advisory teams can focus entirely on core business logic, due diligence findings, and synergy realization curves rather than wasting hours on manual alignment and formatting tasks, projecting competence and securing investor trust. Additionally, corporate planners and private equity investment associates utilize these slide sets during quarterly portfolio reviews to highlight operational improvements, key synergy captures, and cost-reduction timelines, ensuring maximum transparency and capital efficiency across the entire corporate structure.

3Practical Use Cases: When and where to deploy this deck

Deploying the Post-Merger Integration (PMI) Roadmap template is essential during major strategic business milestones where operational continuity and stakeholder trust are at stake. Key deployment scenarios include Day 1 readiness briefings, Day 100 integration planning workshops, steering committee progress reports, and private equity portfolio review sessions. During the high-intensity Day 1 transition, this deck is utilized to align day-one operational continuity plans across newly joined business units, preventing customer-facing friction. For the comprehensive Day 100 planning cycles, the template structures long-term synergy realization targets, cloud system consolidations, and department-level organizational structures into clear, boardroom-ready blocks. Utilizing this standardized, high-contrast visual blueprint ensures that your integration recommendations are received as structured, highly professional assets, accelerating executive decision-making speed and deal transaction velocity while maintaining alignment across all global business divisions. This structured approach minimizes operational drift and ensures that capital allocation plans are executed in a timely manner, providing a clear reference point that keeps all functional teams focused on the ultimate financial objectives.

4Structural Blueprint: Recommended slide-by-slide outline

To guide C-suite steering committees and private equity sponsors through a successful integration project, your presentation outline must follow a logical, narrative-driven 12-slide sequence that covers all operational aspects:

  1. 1Executive Title & Hook: Declaring the core integration thesis, primary target operating model, and synergy outcomes.
  2. 2Integration Vision & Strategic Imperatives: Outlining corporate growth drivers and market factors.
  3. 3The IMO Governance Structure: Visualizing the central Integration Management Office steering hierarchy.
  4. 4Day 1 Readiness Checklist: Detailed columns proving zero operational friction on day one.
  5. 5Synergy Realization Roadmap: Widescreen CAGR and cost-efficiency graphs mapping financial goals.
  6. 6Functional Integration Tracks: Structural grids isolating individual department milestones.
  7. 7Systems & IT Consolidation Plan: Detailed roadmaps showing cloud architecture timelines.
  8. 8Cultural & Talent Alignment Plan: Clear initiatives for organizational change management.
  9. 9Financial Feasibility & Budgets: High-density EBITDA, revenue growth, and cash flow models.
  10. 10Risk Mitigation & Risk Registers: Anticipating operational roadblocks and regulatory compliance.
  11. 11Conclusion & Day 100 Milestones: Highlighting high-impact short-term integration goals.
  12. 12Capital Allocation & Ask: Standard chevron bars outlining capital distribution across integration workstreams.

5Aesthetics & Design Rationale of the mckinsey-blue Theme

Our corporate design system replicates the visually striking, high-contrast aesthetics of top-tier consulting firms like McKinsey, BCG, and Bain. The 'mckinsey-blue' theme provides an authoritative, premium feel, utilizing deep royal blue, professional navy, and clean slate tones paired with high-contrast accent highlights to guide the steering committee's eye to critical data parameters. Margins are strictly locked to native 16:9 widescreen proportions to guarantee perfect visual scaling across high-resolution boardroom projectors, desktop screens, and mobile devices. A key element of professional design is maintaining at least 30% negative space on every layout card. This prevents cognitive friction and visual clutter, allowing complex systems roadmap diagrams and synergy metrics to remain readable and impactful. The mckinsey-blue aesthetic establishes instant structural authority, conveying a sense of premium quality and attention to detail. It speaks to the intelligence of the audience, ensuring that design always serves the strategic content, making every slide look highly polished and deliberate.

6Key Synergy Tracking Metrics & High-Density Tables

To build credible topical authority (E-E-A-T) and pass investment committee scrutiny, your Post-Merger Integration presentation must ground its narrative in quantitative synergy metrics. Tracking both cost synergies (such as vendor consolidation, real estate reduction, and headcount optimization) and revenue synergies (such as cross-selling, geographical expansion, and product bundling) requires high-density tabular visualizations. The table below represents a standard integration synergy dashboard structure:

Synergy CategoryBaseline Cost ($M)Target Synergy ($M)Timeline (Months)Risk Level
IT Infrastructure12.54.212Low
SG&A Consolidation8.42.118Medium
Supply Chain Operations15.03.524High
Cross-Selling Program0.0 (Rev)5.0 (Rev)36High

Leveraging high-density tables allows leaders to compare parameters across different functional departments instantly, accelerating validation speed and decision-making during steering committee meetings. By presenting cost baseline vs. synergy targets in structured grids, you provide the administrative thoroughness expected by financial sponsors.

7Storylining & Narration: The Minto Pyramid Principle

Executive business decisions are driven by narrative momentum and logical clarity rather than raw, unorganized data dumps. To maximize the impact of your Post-Merger Integration deck, structure your storyline around Barbara Minto’s legendary Pyramid Principle. Under this elite communication standard, every single slide headline must serve as an active, key conclusion rather than a passive label. For example, instead of titling a slide 'IT Integration Status,' write an active headline like 'IT infrastructure consolidation will yield $4.2M in annual recurring savings by month 12.' Every supporting detail, bullet point, or metrics card must represent a MECE sub-argument that logically validates the main conclusion of that specific slide. Ideas must flow in chronological, structural, or comparative order to ensure a seamless widescreen narrative. This narrative discipline allows busy corporate directors and PE sponsors to grasp your entire integration thesis in under 2 minutes, significantly accelerating operational trust and aligning diverse stakeholder groups on critical priorities without administrative friction.

8Operational Phases of the Winding 12-Step Serpentine Process

A successful Post-Merger Integration roadmap is built on a methodical sequence of execution phases. Using a winding 12-step serpentine roadmap ensures that high-density processes flow in a continuous, logical path. The standard 12-step progression is structured across four primary integration tracks:

- Phase 1: Deal Closure & Pre-Day 1 Alignment (Steps 1 to 3) — Securing antitrust compliance, appointing IMO leads, and setting up joint steering taskforces.

- Phase 2: Day 1 Transition & Stabilization (Steps 4 to 6) — Executing day-one communication plans, securing key customer relations, and stabilizing employee networks.

- Phase 3: Deep Systems & IT Consolidation (Steps 7 to 9) — Migrating core cloud architectures, unifying corporate data warehouses, and consolidating software licensing agreements.

- Phase 4: Synergy Realization & Scale (Steps 10 to 12) — Optimizing redundant supply chains, launching cross-selling initiatives, and conducting final post-integration audits.

Enforcing this structured sequence prevents teams from skipping crucial alignment gates, ensuring operational stability and transaction success.

9XLSlides AI Capability: Customizing the PMI Roadmap

Manually formatting corporate roadmap slides in Microsoft PowerPoint or Google Slides usually drains 8 to 12 hours of frustrating labor, dealing with misaligned serpentine shapes, overlapping text labels, and messy margin drift. Our advanced AI engine handles this design debt in under 60 seconds. The model performs context-aware slide matching, analyzing your text brief to map elements automatically to premium layouts like SWOT matrices, serpentine roadmaps, or chevron timelines. Brand consistency is automatically locked based on your chosen design preset, preventing margin drift across slides. Finally, the presentation exports as standard, fully editable PowerPoint vector shapes, allowing native Excel data edits. This eliminates hours of manual resizing, enabling your strategy team to focus on integration logic rather than alignment rules. You get boardroom-ready widescreen layouts that are fully compatible with Microsoft Office and Google Slides instantly, giving you a massive operational multiplier during high-stakes corporate transactions, integration planning sessions, and steering board alignments, while ensuring your brand assets are strictly locked to professional guidelines.

10Common Pitfalls to Avoid in Merger Integrations

To ensure your Post-Merger Integration roadmap passes rigorous steering board scrutiny, you must avoid these 5 critical design and messaging mistakes:

- Neglecting Culture: Focusing entirely on financial synergies while ignoring cultural differences; use dedicated workstreams to address organizational change.

- Overloading Layouts: Cramming too many raw Gantt bar details onto a single slide; keep at least 30% negative white space to let key milestones stand out.

- Low-Contrast Text: Using light grey text on white backgrounds, which washes out on older projectors; high-contrast, accessibility-compliant coloring is mandatory.

- Non-Widescreen Margins: Outdated 4:3 layouts stretch poorly on modern displays; always build on locked 16:9 margins to ensure professional polish.

- Ambiguous Timelines: Outlining initiatives without clear milestone markers or owner names; assign exact dates and track accountability on every roadmap slide.

Avoiding these common presentation pitfalls guarantees that your integration plan retains board attention, communicates operational excellence, and builds professional alignment across all corporate teams.