What Is an M&A Management Presentation and Why Does It Determine Valuation Outcomes?
An M&A Management Presentation (frequently referred to as the "Management Meeting", "Management Pitch", "MP", or "Phase II Sell-Side Presentation") is the pivotal 3-to-4 hour executive session in an M&A sale process where the target company's C-suite—the Chief Executive Officer (CEO), Chief Financial Officer (CFO), Chief Operating Officer (COO), and Chief Technology/Product Officer (CTO/CPO)—presents the business directly to shortlisted prospective buyers (private equity buyout deal teams and corporate strategic acquirers).
While the Confidential Information Memorandum (CIM) is a static, highly sanitized 60-to-120 page written document reviewed primarily by junior investment associates, the Management Presentation is an interactive executive audition. It is the single moment in a multi-month transaction where buyers form an unvarnished judgment regarding management competence, operational scalability, cultural chemistry, and the defensibility of the forward financial model.
In institutional mergers and acquisitions, the financial stakes of this meeting are immense. A company that enters Phase II with initial non-binding Indications of Interest (IOIs) clustered around 12.0x to 14.0x EBITDA can easily see final binding Letters of Intent (LOIs) diverge between 10.5x and 16.5x EBITDA—representing a tens-of-millions or hundreds-of-millions dollar valuation delta on a mid-market or upper-middle-market transaction. Buyers do not haircut bids because the market opportunity shrunk between Phase I and Phase II; they haircut bids because the management presentation revealed fatal operational cracks, evasive answers, founder key-person dependencies, or financial reconciliations that failed under live cross-examination.
To command top-quartile valuation multiples, sell-side teams must understand the core distinction between consumer slide generation and institutional investment banking presentation standards:
1. **The Executive Audition Dynamic:** Sophisticated private equity sponsors (such as Thoma Bravo, Vista Equity Partners, Blackstone, KKR, and Francisco Partners) are not merely underwriting historical numbers; they are underwriting whether the executive team has the intellectual rigor, strategic vision, and operational control to scale the platform from $15M to $50M+ EBITDA. If the CEO struggles to explain cohort attrition, or if the CFO cannot reconcile gross margin shifts on the fly, buyers bake in substantial "execution risk discounts." 2. **Reconciliation with the Virtual Data Room (VDR):** In an institutional process, every number, metric, and percentage cited on a management slide must reconcile perfectly to the Virtual Data Room (VDR) and the sell-side Quality of Earnings (QofE) report. Discrepancies between the slide deck and the underlying data room files trigger immediate skepticism, opening the door for aggressive buy-side accounting diligence teams to demand valuation concessions. 3. **Proactive Vulnerability Inoculation:** Every business has flaws: customer concentration, recent executive turnover, legacy technical debt, or temporary supply chain disruptions. Novice sellers attempt to bury these issues behind marketing euphemisms, only to be ambushed during Q&A. Elite management teams practice proactive inoculation: acknowledging the constraint upfront, framing it within historical context, demonstrating operational countermeasures, and presenting it as the buyer's post-close value creation upside. 4. **MECE Structural Discipline:** Slides must follow the Pyramid Principle and MECE (Mutually Exclusive, Collectively Exhaustive) logic pioneered by top strategy consultancies. Headers must be declarative action titles that state the core takeaway rather than generic category labels. Instead of a slide titled "Customer Retention," an institutional action title states: "Enterprise NRR of 124% Driven by Expansion in Regulated Sectors with Negligible Logo Churn (<2.1%)."
Generic AI presentation generators fail catastrophically in this environment. Consumer AI tools produce superficial bulleted lists, speculative buzzwords, and decorative illustrations that alienate institutional investors. An M&A management deck demands dense, Excel-linked charts, footnoted accounting definitions, transparent bridge waterfalls, and precise cohort analysis formatted in editable, production-grade PowerPoint.
Table 1: The M&A Management Presentation Chapter Taxonomy: Chapters, Owners & Buyer Evaluation Gates
Simulate & Prototype: M&A Management Presentation Guide: High-Stakes Sell-Side Decks That Maximize Valuation
Drag to draw custom components, test consulting layout presets, and preview presentation architecture live before generating with AI.
Executive Summary: 5 Institutional Rules for Sell-Side M&A Presentations
The M&A Auction Flight Path: Transitioning from the CIM to Phase II Management Meetings
Understanding where the Management Presentation sits within the broader investment banking sale process is essential for tailoring tone, pacing, and depth. A typical competitive sell-side auction spans 16 to 24 weeks, organized into distinct strategic phases:
### Phase I: Teasers, CIM Distribution, and Indication of Interest (IOI) Bids In Phase I, the investment bank distributes a blinded one-page Executive Teaser to a curated list of 40 to 80 potential acquirers (a mix of financial sponsors and strategic buyers). Upon signing a Non-Disclosure Agreement (NDA), qualified bidders receive the Confidential Information Memorandum (CIM) and a formal Process Letter detailing the deadline and requirements for submitting a non-binding Indication of Interest (IOI).
Phase I bids are based entirely on written materials and desktop diligence. Bidders submit wide valuation ranges (e.g., "$120M to $140M Enterprise Value") based on standard multiple benchmarks and high-level financial metrics. The sell-side team and company board evaluate the IOIs, ranking bidders by headline valuation, debt financing certainty, strategic fit, speed to close, and transaction terms, selecting a shortlisted group of 4 to 8 top-tier bidders to advance into Phase II.
### Phase II: The Management Meeting and Confirmatory Diligence Phase II is the decisive competitive arena. Shortlisted bidders are granted access to the Virtual Data Room (VDR)—containing customer transaction logs, audited financial statements, tax filings, legal agreements, and the sell-side Quality of Earnings (QofE) report.
The centerpiece of Phase II is the **Management Presentation**. Over a concentrated 5-to-10 business day window, the company hosts back-to-back, 3.5-to-4.5 hour presentation sessions with each bidder. These meetings are conducted either in-person (often at a neutral conference room at the investment bank's offices or a private hotel suite) or via high-definition secure video conference.
### The Strategic Objectives of the Sell-Side Team in Phase II: 1. **Validate and Elevate the IOI Valuation:** Bidders enter Phase II looking for reasons to re-trade down to the bottom of their IOI range. The management presentation must provide empirical evidence that propels buyers to submit binding Letters of Intent (LOIs) at or above the top end of their initial range. 2. **Manufacture Relentless Competitive Tension:** Bidders must feel that they are in a tightly contested race against highly sophisticated, aggressive peer bidders. The investment banking deal lead orchestrates this dynamic through strict process letters, rigid diligence schedules, and calibrated commentary regarding process momentum. 3. **Establish Chemistry and Governance Alignment:** Private equity investors back management teams they respect and trust. The presentation must demonstrate that the leadership team is coachable, commercially ambitious, and capable of executing the post-close Value Creation Plan (VCP) alongside the sponsor. 4. **Pre-Empt Second-Round Diligence Ambukes:** The management deck must answer 80% of the buyer's detailed diligence questions before they are asked, reducing friction and compressing the timeline to binding LOI submissions and exclusivity.
Exhibit 1: The M&A Equity Story & Executive Investment Thesis Architecture
Checklist 1: The Pre-Management Meeting Rehearsal & VDR Data Reconciliation Gate: 10 Mandatory Checks
Deconstructing Chapters 1 & 2: Establishing the Investment Thesis and Overcoming Founder Reliance
The first fifteen minutes of the Management Presentation set the psychological frame for the entire meeting. If the CEO begins with a dry chronological history of how the company was founded in a garage fifteen years ago, institutional bidders mentally check out.
### The 8-Minute Executive Hook The opening must immediately answer the primary question of private equity and strategic investment committees: *What makes this business a rare, high-conviction asset that commands a premium valuation multiple?*
The CEO must present Exhibit 1—the M&A Investment Thesis Canvas—within the first three slides. This canvas establishes the six foundational pillars of the investment thesis: 1. **Market Category Leadership:** Dominant position in a high-growth, high-margin vertical or specialized niche. 2. **Defensible Competitive Moat:** Embedded customer workflows, high switching costs, and proprietary technological assets that prevent commoditization. 3. **Exceptional Financial Profile:** Rapid organic revenue CAGR combined with top-quartile EBITDA margins and high free cash flow conversion (the "Rule of 50" profile). 4. **Predictable Recurring Revenue:** High contractual visibility (annual/multi-year auto-renewing contracts) paired with world-class Net Revenue Retention (NRR). 5. **Multiple Proven Growth Vectors:** Substantial whitespace within existing accounts, adjacent product lines, geographic territories, and M&A consolidation. 6. **Institutional Operating Discipline:** Scalable cloud-native infrastructure, robust internal financial controls, and a deep secondary leadership bench.
### De-Risking the "Founder Sun King" Trap One of the most pervasive valuation destroyers in founder-led and mid-market companies is **Founder Key-Person Dependency**. When private equity deal teams observe that the founder-CEO personally owns all key customer relationships, signs off on every software architecture decision, and dictates all pricing exceptions, they perceive massive operational risk. The immediate buyer conclusion is: *If the founder takes chips off the table and steps back, this company will implode.*
To dismantle this perception, the presentation must deliberately showcase the depth and autonomy of the second tier of leadership: - The CEO must speak for no more than 35% of the total presentation time, actively transitioning major sections to the CFO, COO, CPO, and CRO. - The deck must include a detailed organizational architecture slide highlighting functional heads, their prior industry pedigree (e.g., leaders hired from scaled enterprise corporations), and their specific operational decision rights. - Documented Standard Operating Procedures (SOPs), KPI dashboards, and delegated approval hierarchies must be highlighted to prove that day-to-day operations run on institutional systems rather than founder intuition.
Exhibit 2: Historical Revenue Trajectory, Gross Margin Expansion & Normalized EBITDA Bridge
Table 2: Quality of Earnings (QofE) to Management Case EBITDA Reconciliation Matrix
Deconstructing Chapter 3: Defending Unit Economics, Customer Cohort Health, and Churn Resilience
In modern M&A, customer telemetry is where buyout sponsors win or lose conviction. Bidders do not accept high-level customer count totals; they conduct forensic cohort analyses to identify underlying revenue decay, margin degradation, or customer concentration risks.
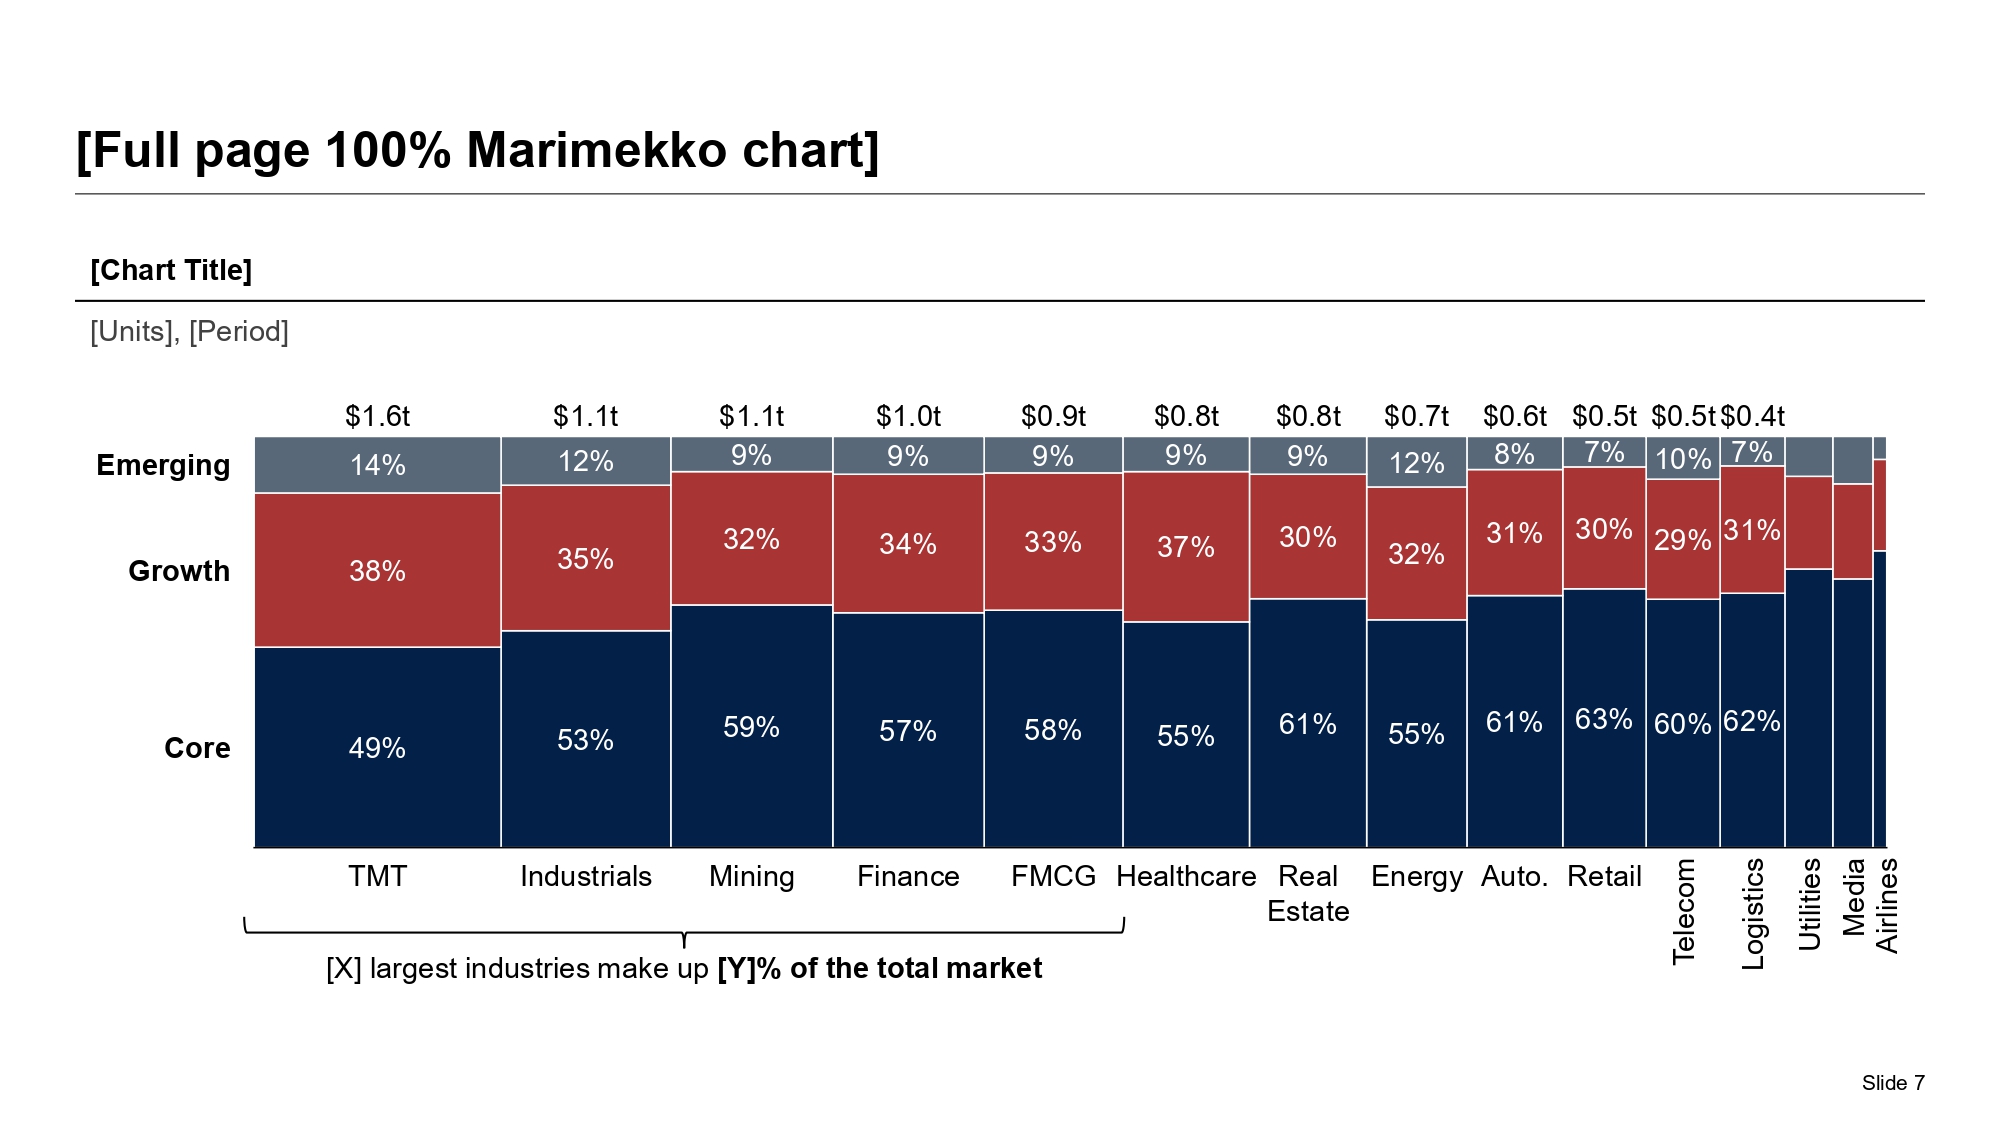
### The Customer Cohort "Layer Cake" Exhibit 3 displays the gold standard of customer telemetry: the multi-year customer cohort Marimekko (Mekko) chart. This visualization proves three critical underwriting facts: 1. **Negative Net Churn:** Older customer cohorts expand their annual spend year-over-year at a rate that dramatically exceeds any logo or dollar churn. In high-performing software and service platforms, an original $10M revenue cohort from four years ago expands to $14M+ today, proving powerful organic upsell and cross-sell momentum. 2. **Gross vs. Net Revenue Retention Discipline:** Bidders scrutinize whether a high Net Revenue Retention (NRR = 124%) is masking an unhealthy Gross Revenue Retention (GRR). A company with 124% NRR but 82% GRR is suffering from severe customer dissatisfaction that is temporarily obscured by aggressive price hikes on remaining accounts. Elite management teams explicitly showcase both metrics: proving high GRR (>= 95%) alongside strong NRR (>= 120%). 3. **De-Risking Customer Concentration:** If a target company generates 35% of its revenue from its top three customers, buyers immediately model severe downside haircuts, fearing that the loss of a single customer will wipe out debt service capacity. The management deck must present a transparent concentration schedule showing: - Historical tenure of top-10 accounts (proving long-standing 7+ year relationships). - Multi-year contractual lock-in with auto-renewal terms. - Deep structural integration: documenting that the software or service is embedded across multiple business units with thousands of daily active users, making vendor replacement operationally prohibitive.
### Unit Economics That Justify Multiple Expansion The CRO and CFO must present undeniable unit economics that validate sales and marketing efficiency: - **Customer Acquisition Cost (CAC) Payback Period:** Proving that fully loaded acquisition costs (sales rep commissions, marketing spend, SDR overhead, and onboarding engineering) are recouped within 10 to 14 months. - **Lifetime Value to CAC Ratio (LTV:CAC):** Demonstrating an LTV:CAC ratio exceeding 5.0x, confirming that each incremental marketing dollar generates exceptional long-term enterprise cash flow. - **Sales Rep Quota Attainment Distribution:** Demonstrating that quota attainment is broadly distributed across the sales team (e.g., 72% of reps hitting >= 100% of plan) rather than driven by one superstar rainmaker whose departure would derail growth.
Exhibit 3: Enterprise Customer Cohort Retention, Net Revenue Retention (NRR) & Industry Segmentation Mekko
Deconstructing Chapter 4: Market Sizing, Competitive Moats, and Neutralizing the Commodity Narrative
One of the most predictable diligence attacks launched by private equity associates and corporate M&A directors is the **"Commoditization & Market Saturation"** argument. Bidders attempt to convince the seller that their product is an easily replicated point solution operating in a crowded market with limited remaining addressable runway, justifying a discounted valuation multiple.
The Management Presentation must systematically dismantle this thesis using rigorous market sizing and defensible competitive moat architecture.
### Rejecting the "Gartner Top-Down Fallacy" Amateur pitch decks open their market sizing chapter with broad claims: *"Gartner predicts the global software market will reach $1.2 trillion, and capturing just 0.5% gives us a $6B business."* Institutional investors dismiss this instantly as desktop fluff that proves nothing about operational reality.
An institutional M&A presentation builds a **Bottom-Up Triangulated Addressable Market (TAM/SAM/SOM)**: - **Total Addressable Market (TAM):** Defined by an empirical census of qualified enterprise entities (e.g., 28,500 mid-market enterprises with 500 to 5,000 employees in target geographies) multiplied by verified, demonstrated Annual Contract Value (ACV = $85,000) = $2.42B TAM. - **Serviceable Addressable Market (SAM):** Filtered for enterprises with specific technological ecosystems, compliance mandates, or operating complexities that match the company's ICP = $1.15B SAM. - **Serviceable Obtainable Market (SOM):** The realistic 3-to-5 year capture target based on current go-to-market capacity and sales headcount = $280M SOM. - **Market Penetration Headroom:** Proving that the company's current $110M revenue represents only a ~9.5% penetration of SAM, demonstrating that the business has years of reinvestment runway before facing saturation.
### Defending the Four Institutional Competitive Moats Exhibit 4 presents the competitive landscape through an objective curved quadrant moat matrix. The CPO and CRO must articulate four distinct, verifiable competitive barriers: 1. **High Switching Costs & Data Gravity:** The platform stores historical mission-critical audit trails, compliance records, and workflow automations. Migrating to a competitor would require 12+ months of costly systems integration and immense business disruption risk. 2. **Proprietary Integration Ecosystem:** Pre-built, certified bidirectional connectors into complex enterprise backbones (SAP, Oracle, Workday, Salesforce) that require years of custom development and third-party certifications to replicate. 3. **Proprietary AI & Algorithmic Datasets:** Proprietary operational data accumulated over a decade, training specialized domain models that deliver 99.4% precision compared to generic off-the-shelf LLMs. 4. **Regulatory & Compliance Moats:** Mandatory compliance certifications (SOC2 Type II, FedRAMP, HIPAA, ISO 27001, GDPR) that act as an unyielding filter against low-cost offshore entrants.
Table 3: Sell-Side Competitor Benchmarking Matrix: Moat Dimensions, Win-Rates, and Defensibility Criteria
Exhibit 4: Relative Competitive Positioning, Moat Defensibility & Win-Rate Benchmark
Deconstructing Chapters 5 & 6: Financial Performance, Forward Forecasts, and Buyer Upside Levers
The financial presentation is the crucible of Phase II. The CFO must command the numbers with absolute authority. While the CEO inspires the room with strategic vision, the CFO must anchor that vision in mathematical reality, cash flow conversion, and defensible projections.
### The Quality of Earnings (QofE) Battleground Table 2 details the reconciliation from reported GAAP operating income to Pro Forma Adjusted EBITDA. In an institutional sale process, the sell-side QofE prepared by a reputable independent accounting firm (Alvarez & Marsal, Big 4, FTI Consulting, or BDO) serves as the baseline defense.
The CFO must clearly delineate between: 1. **Established Accounting Normalizations:** Eliminating non-recurring professional fees, litigation settlements, and historical owner perks ($4.7M total). These are mathematically verifiable and rarely disputed by serious bidders. 2. **Pro Forma Run-Rate Adjustments:** Annualizing the impact of mid-year contract wins, executed restructuring actions, and contractual price increases ($6.8M total). This is where buy-side accounting teams attack. The CFO must defend the exact timing, revenue recognition schedules (ASC 606), and customer onboarding milestones that justify why these cash flows are bankable run-rate reality.
### Constructing the Forward Forecast: "The Three-Pillar Architecture" Forward financial forecasts must be constructed to withstand aggressive private equity haircut modeling. When buyout deal teams review management projections, they automatically apply standard sensitivity haircuts (as modeled in Table 4): slicing 300-500 basis points off revenue growth, haircutting gross margins, and expanding maintenance CapEx assumptions.
To protect valuation multiples, the management model should be structured across three distinct tiers: 1. **Pillar 1: Contracted & Committed Backlog (The Underwritten Floor):** Revenue and cash flow derived entirely from existing multi-year contracts, contracted pricing uplifts, and signed enterprise implementations currently in deployment. This constitutes 75% to 85% of Year 1 forecasted revenue, providing an unshakeable valuation foundation. 2. **Pillar 2: Core Organic Growth (The Base Management Case):** Highly predictable growth driven by historical sales rep quota attainment, proven marketing funnel conversion rates, and historical Net Revenue Retention (NRR). 3. **Pillar 3: Strategic Buyer Upside ("Leaving Meat on the Bone"):** Highly lucrative growth initiatives that management has scoped and validated, but has deliberately *excluded* from the baseline financial model. Examples include international geographic rollout, brand-new adjacent product modules, strategic price restructuring, and programmatic M&A roll-ups.
By presenting these initiatives as qualitative growth catalysts rather than baking them into the baseline model, management gives the incoming private equity deal team room to model their own internal upside case. This empowers the deal lead to defend a higher valuation multiple to their firm's Investment Committee, confident that they have identified unpriced return levers.
Table 4: Management Case vs. Sponsor Underwritten Base Case Haircut Analysis: Modeling Diligence Defensibility
Choreographing the 4-Hour Management Meeting: Rehearsal Cadence, Body Language, and the Banker 'Bad Cop' Protocol
A flawless slide deck will fail if executive execution in the room is undisciplined, disjointed, or defensive. The 4-hour management meeting is high-stakes commercial theater. Every interaction, gesture, and pause is scrutinized by the buyer's deal team.
### The 4-Hour Meeting Agenda Architecture Institutional sell-side advisors enforce a disciplined chronological schedule for each Phase II meeting: - **00:00 - 00:20 (Executive Framing & Rapport):** Informal introductions, coffee, and opening remarks by the investment banking deal lead. The banker establishes the ground rules, re-emphasizes the process letter timeline, and sets an upbeat, highly competitive tone. - **00:20 - 01:45 (The Formal Presentation - 85 Minutes):** The C-suite presents Chapters 1 through 6. The CEO sets the vision and market positioning (25 min); the CPO/CTO showcases products and technical moats (20 min); the CRO presents customer telemetry and GTM execution (20 min); and the CFO delivers financial performance, QofE adjustments, and forward model mechanics (20 min). - **01:45 - 02:00 (Executive Break & Informal Chemistry Check):** Crucial 15-minute recess. The deal team steps into the hallway to calibrate, gauge buyer body language, and identify which topics the buyer focused on during the presentation. - **02:00 - 03:45 (Interactive Q&A & Technical Deep-Dive - 105 Minutes):** The meeting shifts to open cross-examination. Private equity partners, operating partners, and industry advisors test the management team across unit economics, competitive threats, and forecast sensitivities. - **03:45 - 04:00 (Wrap-Up & Next Steps):** The CEO closes with an authentic restatement of conviction regarding the company's trajectory. The investment banker steps in to outline the final binding bid submission instructions, VDR supplemental upload schedules, and bidder access rules.
### Executive Choreography and Body Language Rules 1. **The Rule of Mutual Elevation:** Executives must visibly demonstrate respect for one another. When a question is directed at the CEO regarding cloud hosting unit economics, the CEO should say: *"That is a critical architectural pillar; our CTO, Sarah, has led our FinOps re-platforming and can walk you through our exact server unit costs."* Never interrupt a colleague; never correct an executive peer in front of the buyer; and never look surprised by a teammate's answer. 2. **Answer-First (Minto Pyramid) Precision:** Avoid long, meandering preambles that make the management team appear evasive. When asked: *"Did customer churn increase in Q3?"*, the answer must begin immediately with: *"Yes, gross churn increased by 0.8% in Q3 due to the planned sunset of our legacy on-premise module. As shown on Slide 28, 92% of those customers migrated to our cloud platform, resulting in a net positive ARR contribution."* 3. **The Banker "Bad Cop" Protocol:** Buyers will inevitably attempt to test the CEO on sensitive transaction terms during Q&A: *"What valuation multiple do you consider fair?"*, *"Are you willing to grant us a two-week exclusivity window?"*, or *"Would you accept a seller note or rollover equity earn-out?"* - The CEO must NEVER negotiate or answer deal terms in the room. Doing so compromises competitive auction leverage. - The rehearsed CEO response is: *"We are fully aligned with our board and our advisors at Goldman/Morgan Stanley. Our advisory team is running a structured, competitive process, and they will communicate all transaction parameters in the formal process letter. Our focus today is ensuring you have complete visibility into our operating model and market opportunity."* - The investment banker immediately steps in as the "Bad Cop" to absorb the friction and protect management's relationship with the prospective buyer.
Exhibit 5: The Post-Acquisition Value Creation Flight Path: 4 Strategic Buyer Upside Vectors
Checklist 2: The Phase II Management Meeting Follow-Up & Final LOI Bid Defense Gate: 10 Critical Steps
How to Structure the Definitive 12-Section Sell-Side M&A Management Presentation Deck
An executive M&A Management Presentation deck typically encompasses 55 to 75 core slides, organized into a disciplined 12-section master narrative architecture, supported by an exhaustive 30-to-50 slide Appendix:
### Core Master Slide Architecture (55 - 75 Slides): 1. **Title & Transaction Confidentiality Notice (2 slides):** Formal transaction headline, sell-side investment bank advisory credentials, date, recipient watermark, and strict SEC / private placement non-disclosure disclaimers. 2. **Executive Summary & Investment Highlights (4-6 slides):** Exhibit 1 Investment Thesis Canvas, company snapshot metrics (Revenue, CAGR, EBITDA, NRR, Gross Margin), key platform achievements, and transaction rationale. 3. **Company Overview, Mission & Historical Evolution (4-6 slides):** Strategic journey from founding to category leadership, structural inflection points, core value proposition, and operating principles. 4. **Business Model & Monetization Architecture (4-6 slides):** Multi-tiered pricing structures, contract terms (annual/multi-year auto-renewals), customer billing cycles, and gross margin unit economics. 5. **Product Portfolio, Architecture & Technical Moats (8-10 slides):** Platform product modules, user experience workflows, cloud architecture, security compliance (SOC2/FedRAMP), and Exhibit 4 Competitive Moat Matrix. 6. **Market Opportunity & Bottom-Up Addressable Sizing (6-8 slides):** Macro industry tailwinds, bottom-up TAM/SAM/SOM build, enterprise white space analysis, and regulatory expansion drivers. 7. **Go-to-Market Strategy, Sales Pipeline & Channel Ecosystem (6-8 slides):** Direct sales organization structure, sales rep quota attainment distribution, CAC payback periods, LTV:CAC ratios, and partner channel distribution models. 8. **Customer Dynamics, Cohorts & Retention Telemetry (6-8 slides):** Exhibit 3 Customer Cohort Retention Mekko, Gross vs. Net Revenue Retention curves, customer concentration Pareto analysis, and representative Fortune 500 case studies. 9. **Historical Financial Performance & QofE Bridges (8-12 slides):** Exhibit 2 Historical Revenue & EBITDA Track Record, Table 2 QofE Normalization Schedule, gross margin evolution, operating expense leverage, and free cash flow conversion waterfall. 10. **Forward Financial Model & Guidance Assumptions (6-8 slides):** Table 4 Management Case vs. Sponsor Haircut Matrix, 3-year P&L forecast, revenue driver causal chains, and contracted backlog visibility. 11. **Post-Acquisition Value Creation Flight Path (4-6 slides):** Exhibit 5 Four-Column Strategic Buyer Upside Vectors, unmodelled organic expansion levers, international rollout plans, and programmatic M&A roll-up pipeline. 12. **Executive Leadership Bench & Organization (3-5 slides):** C-suite executive biographies, second-tier management leadership depth, functional headcount distribution, and governance architecture.
### The Institutional Appendix (30 - 50 Slides): Sophisticated management teams do not clutter the core narrative with granular spreadsheets; they relegate technical data to a structured, tabbed Appendix: - **Appendix A: Quality of Earnings Audit Support:** Detailed invoice-level schedules supporting each EBITDA add-back, pro forma run-rate calculation, and working capital peg analysis. - **Appendix B: Technical & Cloud Architecture Deep-Dive:** Microservices topography, database tenancy schemas, disaster recovery RTO/RPO metrics, and 3-year cloud FinOps cost optimization schedules. - **Appendix C: Customer Case Studies & Return on Investment (ROI):** Blinded enterprise customer implementation case studies detailing payback periods, efficiency gains, and customer quote testimonials. - **Appendix D: Detailed Historical Financial Statements:** Full 5-year monthly Income Statements, Balance Sheets, Cash Flow Statements, and revenue recognition accounting policies (ASC 606).
The Institutional M&A Management Presentation Generator Prompt Recipe for XLSlides
Frequently Asked Questions About M&A Sell-Side Management Presentations
Build Investment-Banking Grade M&A Management Decks with XLSlides
Methodology And Sources
- The Art of the M&A Management Presentation: Bridging Strategy, Financial Modeling, and Buyer Psychology(Morgan Stanley Investment Banking Division)
- Sell-Side M&A Auction Dynamics: Maximizing Competitive Tension in Phase II Management Meetings(Goldman Sachs Global M&A Practice)
- Unlocking Multiple Arbitrage: How High-Performing Management Teams Defend Forward EBITDA in M&A(McKinsey & Company Strategy & Corporate Finance Practice)
- The Private Equity Buyer's Playbook: How Deal Teams Scrutinize Sell-Side Management Presentations and Formulate LOI Bids(Bain & Company Global Private Equity Report)