Executive Framing: The High-Stakes Imperative of Corporate Divestiture & Carve-Out Presentations
Corporate divestitures and carve-outs represent the most intellectually demanding and operationally complex transactions in global corporate finance. Unlike standard whole-company mergers or bolt-on acquisitions—where an acquirer absorbs an intact, fully functioning standalone entity—a carve-out requires the surgical extraction of an interconnected business unit from its parent corporate organism. Every corporate shared service, from enterprise resource planning (ERP) instances and treasury lockboxes to global employee benefits and supplier master service agreements, must be identified, disentangled, and either re-architected as a standalone capability or governed under an interim Transitional Service Agreement (TSA). In this high-stakes environment, an executive presentation is not merely an informational status deck; it is the definitive transaction document that establishes legal perimeter boundaries, underwrites standalone enterprise valuation, and governs Day-1 operational continuity.
In a corporate divestiture, the presentation must successfully arbitrate between two fundamentally divergent and skeptical audiences. On the sell-side, the corporate parent's Board of Directors and Transaction Committee demand proof that the separation perimeter maximizes net after-tax cash proceeds, that parent stranded overhead will be ruthlessly culled within 100 days post-close, and that continuing operations ('RemainingCo') will not suffer operational disruption. On the buy-side, Private Equity Investment Committees (ICs), corporate development leaders, and syndicate credit lenders require indisputable evidence that the carve-out entity ('StandaloneCo') can survive and thrive from Day 1 without parent life support. They scrutinize whether historical corporate allocations reflect realistic standalone G&A costs, whether customer contracts can be successfully novated without revenue attrition, and whether one-time separation costs (CapEx and OpEx) have been rigorously modeled rather than brushed aside as optimistic contingencies.
The financial cost of superficial or poorly structured carve-out presentations is catastrophic. In traditional M&A, an incomplete slide may cause mild diligence friction; in a carve-out, ambiguity destroys transaction value directly at the negotiating table. When a seller presents vague perimeter definitions, unallocated corporate overhead, or open-ended TSA dependencies, sophisticated private equity sponsors immediately price in 'separation uncertainty.' They apply punitive discounts—typically cutting enterprise value bids by 15% to 30%—or demand massive indemnity escrow holdbacks to insulate against untangled pension liabilities, commingled intellectual property, and prolonged IT cutovers. Conversely, a seller that presents a granular 9-panel perimeter architecture, an audited 5-tier standalone EBITDA bridge, and a pre-negotiated, milestone-gated TSA schedule captures a substantial 'readiness premium,' accelerates time-to-close, and pre-empts aggressive buyer purchase-price renegotiations.
This guide provides the definitive playbook for designing, structuring, and delivering institutional carve-out and divestiture presentations. Built on field-tested frameworks from leading M&A advisory practices (including Alvarez & Marsal, McKinsey Strategy & Corporate Finance, Bain M&A, FTI Consulting, and Big 4 Transaction Advisory), it equips corporate development executives, private equity deal leads, and transition directors with the exact analytical models, visual layouts, and executive narratives required to command boardroom conviction and execute flawless corporate separations.
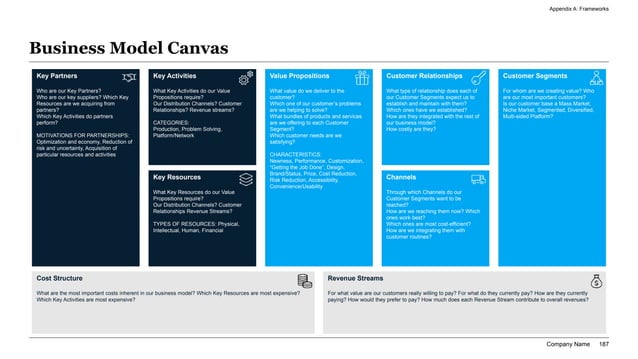
Exhibit 1: Carve-Out Scope & Perimeter Definition: The 9-Dimension Separation Architecture
Core Strategic Takeaways: What Every Deal Lead Must Know About Carve-Out Presentations
- The Perimeter Dictates Enterprise Value: Transaction value in a carve-out is governed by boundary precision. Every unassigned commercial contract, shared software license, co-mingled manufacturing facility, or unallocated patent left in ambiguity triggers buyer valuation haircuts or protracted escrow demands.
- Parent Allocations Never Equal Standalone Run-Rate G&A: Historical corporate overhead allocated under SEC Staff Accounting Bulletin (SAB) Topic 1-B uses arbitrary revenue formulas that bear zero relationship to standalone costs. Deal presentations must present a bottoms-up standalone cost model across IT, Finance, HR, Legal, and Procurement.
- Transitional Service Agreements (TSAs) Are Expensive Stopgaps: While TSAs provide indispensable Day-1 operational stability, extended TSAs destroy transaction IRR. Institutional decks must define strict 6- to 12-month duration windows, escalating cost-plus penalties (e.g., +25% after Month 12), and explicit milestone exit cutover gates.
- Seller Stranded Costs Require an Immediate Culling Plan: When a parent divests a business unit representing 25% of corporate revenue, corporate shared services overhead does not automatically evaporate. Parent board presentations must detail a 100-day restructuring roadmap to eliminate stranded expenses and right-size RemainingCo.
- Day-1 Operational Readiness Is a Strict Binary: On Day 1, StandaloneCo must invoice customers, process employee payroll, process warehouse shipments, and access core ERP records without parental intervention. Presentations must demonstrate verified green-light status across all five mission-critical operational pillars.
- The Separation Management Office (SMO) Drives Transaction Velocity: Without an independent, executive-sponsored SMO running weekly stage-gate reviews and resolving joint transition disputes, carve-out migrations slip by an average of 4 to 8 months, burning millions in unnecessary TSA fees.
Table 1: Audited Carve-Out EBITDA to Standalone Pro Forma Bridge: Adjustments, Add-Backs, and Stranded Cost Deductions
A comprehensive institutional financial model bridging parent-reported historical carve-out EBITDA to buyer-underwritten pro forma standalone run-rate EBITDA across five financial normalization tiers.
| Financial Tier | Line Item / Adjustment Component | Reported Carve-Out P&L ($M) | Adjustment / Normalization ($M) | Pro Forma Standalone ($M) | Deal Underwriting Rationale & Methodology |
|---|---|---|---|---|---|
| Tier 1: Parent Historical | Parent-Reported Division Revenue | $320.0M | $0.0M | $320.0M | Audited GAAP historical top-line revenue generated by divested operating division across global customer accounts. |
| Tier 1: Parent Historical | Division Direct Cost of Goods Sold (COGS) | ($176.0M) | +$4.0M | ($172.0M) | Add-back of corporate parent internal procurement markups and transfer pricing surcharges on shared component fabrication. |
| Tier 1: Parent Historical | Division Gross Profit Baseline | $144.0M | +$4.0M | $148.0M | Adjusted standalone gross profit margin of 46.25% reflecting independent third-party commercial supplier pricing terms. |
| Tier 2: Direct SG&A | Dedicated Division Operating Expenses (OPEX) | ($64.0M) | ($2.0M) | ($66.0M) | Deduction to fund 6 dedicated commercial sales operations and field support heads previously shared at corporate headquarters. |
| Tier 2: Direct SG&A | Reported Division Contribution Margin | $80.0M | +$2.0M | $82.0M | Direct operational margin generated by the division prior to the application of corporate parent overhead allocations. |
| Tier 3: Corporate Overhead | Elimination of Parent Management Fee Allocation | ($28.0M) | +$28.0M | $0.0M | Complete reversal of historical corporate parent overhead allocations under SEC SAB Topic 1-B revenue-ratio methodologies. |
| Tier 3: Corporate Overhead | Bottoms-Up Standalone IT & ERP Licensing | $0.0M | ($11.5M) | ($11.5M) | New standalone cloud ERP (SAP S/4HANA Public Cloud), Microsoft 365 enterprise tenant, Salesforce CRM, and AWS hosting costs. |
| Tier 3: Corporate Overhead | Bottoms-Up Standalone Finance & Accounting | $0.0M | ($5.8M) | ($5.8M) | Full compensation and operating budget for standalone CFO, corporate controller, FP&A team, treasury lead, and Big 4 external audit. |
| Tier 3: Corporate Overhead | Bottoms-Up Standalone HR, Benefits & Payroll | $0.0M | ($4.2M) | ($4.2M) | Establishment of dedicated PEO/Workday platform, standalone health insurance benefit broker fees, and global recruiting staff. |
| Tier 3: Corporate Overhead | Bottoms-Up Standalone Legal, Risk & Governance | $0.0M | ($3.5M) | ($3.5M) | Dedicated General Counsel, trade regulatory compliance officers, corporate secretary, and standalone D&O insurance premiums. |
| Tier 4: Standalone Run-Rate | Pro Forma Standalone Corporate Overhead | ($28.0M) | +$3.0M | ($25.0M) | Net $3.0M favorable overhead efficiency delta vs. parent allocation, achieved via modern cloud architecture and lean executive staffing. |
| Tier 5: Final Pro Forma | Pro Forma Standalone Run-Rate EBITDA | $52.0M | +$5.0M | $57.0M | Underwritten baseline run-rate EBITDA for transaction purchase multiple valuation (17.8% adjusted pro forma EBITDA margin). |
Deconstructing the Standalone EBITDA Bridge: Moving from Parent Allocations to Bottoms-Up Run Rates
In a corporate carve-out, the reported historical EBITDA is essentially an accounting fiction. Under US GAAP and SEC Staff Accounting Bulletin (SAB) Topic 1-B, historical carve-out financial statements require the corporate parent to allocate central corporate expenses—such as executive management, human resources, enterprise software, treasury, and legal services—down to the divested unit. These allocations are almost invariably performed using blunt mathematical formulas, such as allocating costs in proportion to division revenue, headcount, or total asset values. A division that generates 15% of parent revenue is simply assigned 15% of the parent company's $200 million corporate overhead budget ($30 million allocation), regardless of whether the division actually utilized those services or required that level of institutional bureaucracy.
Private equity sponsors, credit rating agencies, and syndicate lenders reject SAB Topic 1-B allocations outright. To underwrite debt leverage and equity return models, buyers require a bottoms-up Standalone EBITDA Bridge. The bridge slide must deconstruct the financial journey in an unmistakable visual waterfall. It begins with the seller's reported carve-out EBITDA, reverses 100% of the parent company's historical management fee allocations, and systematically inserts the newly calculated, bottoms-up operational cost of running StandaloneCo as an independent enterprise. This requires modeling every corporate function from scratch: sizing a right-sized C-suite, establishing standalone payroll engines, licensing cloud software seats, procuring independent commercial insurance, and engaging separate audit and tax advisors.
Furthermore, an institutional bridge slide must address the uncomfortable reality of 'Negative Synergies' (dis-synergies). When a business unit leaves a multi-billion-dollar parent corporate umbrella, it inevitably loses aggregate economies of scale. Direct raw material supplier discounts may compress by 200 to 400 basis points; software enterprise licensing tiers transition from tier-1 volume pricing to smaller seat commitments; and shared distribution hubs must be replaced with dedicated third-party logistics (3PL) warehousing contracts. Decks that transparently quantify these negative synergies and balance them against lean operational efficiencies command immediate credibility with investment committees. Hiding dis-synergies within optimistic 'management adjustments' is the single fastest way to invite aggressive buyer due diligence haircuts.
Finally, the EBITDA bridge presentation must strictly segregate 'Ongoing Standalone Run-Rate Operating Expenses' from 'One-Time Separation Costs' (CapEx and OpEx). One-time separation costs—including severance packages for restructured parent staff, ERP data cloning fees, legal entity incorporation expenses, brand re-naming campaigns, and physical facility partitioning—must be capitalized and funded through the transaction sources and uses table. They must never be blended into run-rate EBITDA. By isolating run-rate earnings from one-time transition friction, deal leads ensure that the business is valued on its true cash-flow generation capability while providing lenders with a clear view of the upfront equity cushion required to achieve independence.
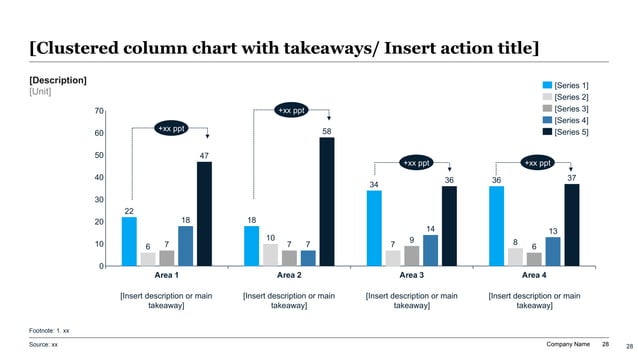
Exhibit 2: Standalone Corporate Overhead & SG&A Benchmark: Parent Allocation vs. Standalone Run-Rate vs. Peer Median
Designing the Transitional Service Agreement (TSA) Schedule: Duration, Pricing, and Governance
A Transitional Service Agreement (TSA) is the operational lifeline that bridges the gap between closing and complete operational independence. Under a TSA, the selling parent company agrees to provide specified back-office, IT, operational, and commercial services to the divested entity for a negotiated transition period in exchange for agreed-upon service fees. While legal teams draft the dense contractual schedules of the TSA agreement, the carve-out presentation must distill these hundreds of contractual pages into an intuitive, executive-level TSA Master Schedule that communicates duration flight plans, economic incentives, and operational cutover milestones to the Board and Investment Committee.
The fundamental design principle of an institutional TSA slide is that 'A TSA is a necessary evil with an expiration clock.' Prolonged TSAs erode transaction value for both sides. For the seller, providing TSAs consumes managerial bandwidth, creates unwanted ongoing operational liabilities, and delays the elimination of corporate stranded overhead. For the buyer, lingering on parent TSAs prevents the implementation of lean operating models, stalls strategic transformation, and leaves the company dependent on an entity whose commercial incentives may no longer align with its own. Therefore, best-practice TSA presentations establish clear tiered duration horizons: Tier 1 (3 to 6 months for treasury lockboxes and payroll), Tier 2 (6 to 12 months for shared logistics and order-to-cash processing), and Tier 3 (12 to 18 months maximum for complex ERP hosting and specialized manufacturing quality assurance).
Economic alignment is the primary mechanism used to ensure timely TSA exit. The TSA presentation must clearly articulate the pricing structure and financial escalation penalty mechanics. Best-practice agreements price initial TSA services at 'Fully Burdened Direct Cost plus a 5% to 10% Administrative Fee' for the standard agreed duration window. However, to prevent buyer complacency, the contract institutes aggressive step-up penalties if the buyer fails to exit on time—for example, increasing service fees to Cost plus 35% during Months 13 through 18, and Cost plus 50% thereafter. Highlighting these escalation mechanisms in the deal presentation demonstrates to lenders and boards that both management teams have powerful financial incentives to drive cutover velocity.
Governance of the TSA relationship requires equal visual prominence in the deck. The presentation must outline the structure and authority of the Joint Transition Committee (JTC), co-chaired by the Separation Management Office (SMO) leads from both ParentCo and StandaloneCo. The slide should establish formal Service Level Agreements (SLAs)—such as ERP system uptime guarantees (99.8%), payroll processing timeliness (100% on-time execution), and IT ticket resolution windows—paired with explicit dispute escalation protocols. By demonstrating that TSA execution is governed with commercial rigor rather than informal goodwill, the presentation assures investors that operational continuity will be preserved throughout the separation journey.
Table 2: Transitional Service Agreement (TSA) Governance Matrix: Service Domains, Service Level Agreements (SLAs), Pricing Markups, and Exit Criteria
An operational governance matrix detailing six core TSA service modules, contractual performance SLAs, pricing penalty step-ups, and definitive exit cutover gates.
| TSA Service Domain | Scope & Shared Services Provided | Contractual Duration | Base Pricing Model | Penalty Markup After Deadline | Exit Cutover Gate & Milestone |
|---|---|---|---|---|---|
| IT Infrastructure & Cloud | Dedicated access to shared SAP S/4HANA ERP, Active Directory authentication, corporate firewalls, and Tier-2 helpdesk. | 12 Months (Max 18) | Actual Burdened Cost + 8% | +35% markup from Month 13–18 | Successful data migration, user acceptance testing (UAT), and cutover to independent cloud SAP instance. |
| Payroll & Employee Benefits | Global multi-country payroll processing, employee health benefit administration, 401(k) matching, and tax withholding compliance. | 6 Months (Max 9) | Actual Burdened Cost + 5% | +25% markup from Month 7–9 | Complete onboarding of standalone PEO / Workday payroll engine and execution of first parallel test payroll run. |
| Treasury & Cash Operations | Customer lockbox cash processing, commercial banking wire disbursements, letters of credit, and FX currency risk hedging. | 3 Months (Max 6) | Flat $45,000/mo retainer | +50% markup from Month 4–6 | Operational independence of StandaloneCo commercial bank accounts, standalone credit facilities, and liquidity sweeps. |
| Supply Chain & Logistics | Shared regional distribution center warehousing, inventory picking/packing, cross-docking, and bulk freight carrier booking. | 12 Months (Max 15) | Pass-through freight + 10% | +30% markup from Month 13–15 | Execution of standalone contracts with third-party logistics (3PL) network and physical transfer of safety stock inventory. |
| Order-to-Cash (O2C) | Customer credit limit evaluation, sales invoicing generation, accounts receivable collections, and cash application. | 9 Months (Max 12) | Actual Burdened Cost + 7% | +40% markup from Month 10–12 | Formal novation of top 80 enterprise customer contracts and activation of standalone billing gateway. |
| Regulatory & Quality Compliance | Maintenance of international regulatory product filings, CE mark technical dossiers, ISO audit certifications, and quality tracking. | 18 Months (Max 24) | Fixed $85,000/mo retainer | +50% markup from Month 19–24 | Formal transfer and re-registration of regulatory marketing authorizations with relevant government health authorities. |
Mitigating Seller Stranded Costs: Managing the Post-Separation Operating Expense Cliff
From the perspective of the selling parent company's Board of Directors and Chief Financial Officer, the single greatest financial risk in a carve-out divestiture is 'Stranded Costs.' Stranded costs represent corporate overhead expenses that previously supported the divested division but remain embedded within the parent company after closing. For example, if a multi-divisional corporation divests a business unit representing 25% of total enterprise revenue, the parent company's central corporate legal, tax, accounting, human resources, and enterprise software costs do not magically drop by 25% on Day 1. Unless aggressively managed, this stranded overhead compresses RemainingCo's operating margins and destroys the net economic benefits of the sale.
An institutional seller carve-out presentation must confront stranded costs directly by categorizing them into three distinct structural buckets: Corporate Headcount, Physical Real Estate, and Long-Term Vendor Contracts. 'Headcount Overhead' includes shared corporate support staff—such as internal auditors, recruiting teams, and corporate communications—sized for a larger enterprise. 'Real Estate Overhead' encompasses vacant corporate headquarters floors, shared research facilities, and underutilized regional offices previously occupied by divested staff. 'Vendor Overhead' comprises enterprise software agreements (e.g., global enterprise agreements with SAP, Oracle, Microsoft, or Salesforce) with take-or-pay minimum volume tiers or multi-year contractual commitments that exceed RemainingCo's shrunken operating footprint.
To win board approval, the deal team must present an aggressive '100-Day Stranded Cost Culling Roadmap.' The slide must show a clear, time-phased cost elimination waterfall mapping how every dollar of stranded expense will be eradicated. In the immediate 0 to 60 days post-close, incoming TSA fee revenue paid by the buyer serves as an operational bridge, offsetting the carrying cost of shared resources. Simultaneously, the parent company must execute targeted workforce restructurings, transfer shared personnel to the buyer under agreed TSA roles, sublease or terminate surplus office space, and exercise contract renegotiation clauses with enterprise software vendors.
Crucially, the presentation must illustrate RemainingCo's 'Pro Forma Normalized Margin Trajectory.' Board members need to see that while RemainingCo will experience an interim margin dip during the 6 to 12 months of active TSA operations, the ultimate post-culling cost structure will be leaner, more agile, and more profitable than the pre-divestiture baseline. By pairing the gross transaction proceeds with an audited stranded cost culling plan, the presentation proves to directors and public equity analysts that the divestiture will be accretive to shareholder value on a per-share basis.
Exhibit 3: The Four Core Separation Workstreams: Commercial, Technology, Legal/Regulatory, and People Disentanglement
Checklist 1: Day-1 Operational Cutover Readiness Checklist: Commercial, HR, Banking, ERP, Supply Chain
Day-1 Operational Readiness & Entanglement Diagnostics: Ensuring Flawless Cutover
In a corporate carve-out, 'Day 1' is the moment of legal and operational closing when the sale transaction takes effect, ownership transfers, and the carved-out entity must function without the legal authority of the corporate parent. Unlike internal corporate reorganizations where missed deadlines can be absorbed through informal bureaucratic flexibility, Day-1 readiness is a strict operational binary. If customer invoices cannot be issued under the new legal entity on Day 1, cash collections freeze. If employee bank details fail to migrate to the new payroll provider, hundreds of employees go unpaid. If supply chain logistics accounts lack established credit lines, critical factory component shipments are halted at port.
To guarantee flawless execution, leading carve-out advisors initiate an 'Entanglement Diagnostic' during early deal due diligence. The diagnostic systematically inspects every operating department to classify business entanglement into three distinct operational categories: 'Clean Cut' (dedicated teams and standalone systems requiring zero parent intervention), 'Entangled but Solvable' (shared systems that can be cleanly decoupled via TSA schedules or data cloning), and 'Severely Tangled' (commingled manufacturing cleanrooms, joint research patents, or unified customer contracts combining multiple product divisions). The presentation must summarize this diagnostic in an executive Heatmap Slide that clearly shows the path to decoupling each entangled node.
A critical mistake in carve-out planning is attempting a high-risk 'Big Bang' technology cutover on Day 1. Trying to launch a completely brand-new, customized cloud ERP and CRM system simultaneously with legal closing is a recipe for catastrophic operational failure. Sophisticated transaction teams design pragmatic 'Day-1 Cutover Workarounds.' If customer invoicing systems are not fully independent by closing, the team institutes a temporary billing agency agreement where the parent invoices customers on behalf of StandaloneCo under TSA Schedule 1.2. If warehouse management systems cannot be partitioned immediately, physical inventory is ring-fenced with distinct SKU barcodes and manual daily reconciliation audits.
The Day-1 Readiness presentation must showcase the governance architecture of the 'Day-1 Cutover War Room.' Deal leads should present a detailed stage-gate scorecard tracking hourly cutover milestones over the 72-hour closing weekend: legal entity funding, treasury cash sweep validation, IT access credential cutovers, customer notification dispatches, and emergency escalation protocols. Presenting a pre-engineered contingency fallback for every red-flag failure mode reassures both the Board of Directors and syndicate lenders that operational resilience has been engineered into the transaction architecture from the ground up.
Table 3: Day-1 Operational Cutover Readiness Scorecard: Critical Path Milestones, Red-Flag Triggers, and Contingency Fallbacks
An executive stage-gate scorecard monitoring mission-critical cutover workstreams across readiness status, critical dependencies, failure triggers, and operational contingency fallbacks.
| Cutover Workstream | Day-1 Target Objective | Readiness Status | Critical Path Dependency | Red-Flag Failure Trigger | Pre-Engineered Contingency Fallback |
|---|---|---|---|---|---|
| Treasury & Cash Operations | Establish independent cash collection and commercial vendor wire disbursements. | Green (Validated) | Commercial bank account KYC documentation and SWIFT network activation. | Customer lockbox payments bouncing to parent holding company accounts. | Activate 60-day parent pass-through sweep agreement with daily cash reconciliation audits. |
| Customer Invoicing (O2C) | Issue legally compliant customer invoices on Day 1 without revenue disruption. | Amber (In Progress) | Formal novation of top 50 master enterprise commercial customer contracts. | Customer accounts payable portals reject new StandaloneCo vendor registration ID. | ParentCo issues invoices under existing legal entity as billing agent under TSA Schedule 1.2. |
| Payroll & Workforce Continuity | Execute uninterrupted Day-15 payroll run for 850 transferring global employees. | Green (Validated) | Migration of employee direct deposit bank routing and tax withholding data to new PEO. | Payroll test run fails or tax withholding registration rejected by local jurisdiction. | ParentCo executes emergency shadow payroll run via existing corporate ADP account with intercompany chargeback. |
| ERP & Systems Access | Enable uninterrupted core transaction processing across global manufacturing sites. | Amber (In Progress) | Database segregation and role-based data filtering in cloned SAP environment. | Data corruption during migration or system timeout during high-volume transactions. | Grant read-only access to parent SAP production environment via secure Citrix/VDI gateway. |
| Logistics & Warehousing | Maintain daily customer freight dispatches from shared regional logistics hubs. | Green (Validated) | Execution of warehouse services agreement and establishment of separate carrier accounts. | Freight carriers suspend dispatches due to unverified trade credit lines. | Parent carrier freight accounts remain active with 100% daily shipping costs rebilled to buyer escrow. |
| Regulatory Compliance | Preserve valid commercial operating licenses across 12 international markets. | Green (Validated) | Submission of regulatory change-of-control notifications to health and trade authorities. | Customs import officials detain product shipments at international border ports. | ParentCo acts as designated importer of record under TSA Regulatory Schedule 4.1. |
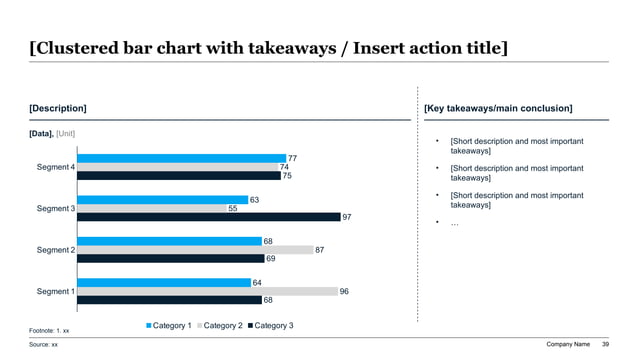
Exhibit 4: Transitional Service Agreement (TSA) Duration Schedule & Cost-Out Runway: IT, HR, Finance, and Supply Chain
Separation Management Office (SMO) Architecture: Workstream Chartering and Executive Reporting
A corporate carve-out cannot be managed using standard, everyday corporate governance frameworks. In typical business operations, project managers facilitate cross-functional collaboration within a unified corporate culture with shared financial goals. In a carve-out, the operational environment is inherently adversarial: two independent corporations—often with diametrically opposed financial incentives regarding TSA billing, asset transfer boundaries, employee retention, and post-closing liabilities—must work together under extreme time pressure to decouple complex enterprise assets. Managing this friction requires the establishment of an empowered, dedicated Separation Management Office (SMO).
The SMO architecture operates on a rigorous three-tiered governance hierarchy. At the apex sits the Executive Steering Committee, comprising the CEO, CFO, Lead Private Equity Deal Sponsor, and Head of Corporate Development. The Steering Committee meets bi-weekly to resolve cross-entity commercial impasses, approve budget variances, and review critical regulatory milestones. Beneath the executive tier sits the Core SMO Program Leadership, led by an experienced Carve-Out Director and supported by external M&A separation advisors. The SMO Program Office owns the integrated master separation schedule, establishes project management standards, and monitors critical path dependencies across all functional areas.
At the operational execution level sit the Functional Workstream Pods, organized across five core business pillars: Commercial & Customer Operations, Technology & Infrastructure, Finance & Treasury, Legal & Regulatory, and Human Resources. Each workstream pod is co-led by a dedicated ParentCo lead and a dedicated StandaloneCo lead operating under a formal Workstream Charter. These workstream leaders meet weekly under the auspices of the Joint Transition Committee (JTC) to review TSA performance metrics, resolve billing discrepancies, track data segregation progress, and sign off on milestone completions required to terminate TSA schedules early.
The primary executive deliverable of the SMO is the Weekly Executive Dashboard Slide. Executive directors and private equity investment committee members do not have the time to review hundreds of individual Jira tickets or Gantt charts. The SMO presentation must distill program status into a single, high-signal dashboard displaying: Overall Separation Health (Red/Amber/Green status by workstream), TSA Service Exit Burndown (tracking active versus terminated TSA schedules against plan), One-Time Separation Budget Variance (actual separation CapEx/OpEx versus underwritten reserves), and the Top 5 Critical Path Risks with named owners and concrete mitigation actions.
Exhibit 5: The Four-Stage Carve-Out Governance Sequence: From Separation Blueprint to Post-TSA Optimization
Carve-Out Deck Narrative Architecture: Tailoring Content for Buyers, Sellers, and Boards
The narrative structure of a carve-out presentation must be calibrated with surgical precision depending on the specific audience commanding the boardroom table. Presenting the exact same generic 60-slide deck to a corporate parent Board of Directors, a private equity Investment Committee, and a syndicate of credit rating agency analysts is a guaranteed recipe for failure. Each of these executive stakeholders approaches the transaction through a fundamentally different risk-return aperture and requires a tailored sequence of financial and operational proof points.
When presenting to the Seller's Board of Directors and M&A Committee, the deck narrative must focus on Net Value Realization, Corporate Perimeter Defense, and RemainingCo Protection. Board directors need answers to three macro questions: First, what is the net after-tax cash proceeds from the divestiture after subtracting one-time separation costs, debt defeasance, and tax friction? Second, does the perimeter definition definitively protect RemainingCo's crown-jewel intellectual property, proprietary customer relationships, and core manufacturing capabilities? And third, is there an airtight, board-approved Stranded Cost Culling Plan that guarantees corporate overhead will be reduced fast enough to prevent post-close margin dilution? The seller deck must lead with valuation certainty and risk ring-fencing.
When presenting to a Private Equity Investment Committee (IC), the narrative shifts entirely to Standalone Value Creation, Downside Stress-Testing, and Operational Execution Velocity. Private equity partners focus intensely on the underwritten standalone margin: What happens to deal returns if standalone IT costs exceed budget by 25%? What is the impact on cash flow if TSA durations slip from 12 months to 18 months? How defensible are the company's gross margins without parent purchasing scale? The buyer deck must open with the strategic investment thesis, followed immediately by the bottoms-up standalone EBITDA bridge, the Day-1 cutover risk scorecard, and the 100-day value creation plan detailing post-TSA margin expansion initiatives.
Across all audiences, elite carve-out presentations adhere to uncompromising visual and analytical standards. Every slide must feature a decisive, data-backed Action Title that articulates the core strategic insight rather than a passive label (e.g., 'Pro Forma Standalone SG&A Delivers $3.0M Net Efficiency via Cloud Architecture' rather than 'SG&A Expenses'). Quantitative tables must include explicit deal underwriting rationale notes; visual diagrams must clearly distinguish between ParentCo, StandaloneCo, and Transitional entities through consistent corporate color-coding; and every non-GAAP financial adjustment must be fully cross-referenced to audited diligence files. By embodying this level of rigor, the carve-out deck builds undeniable credibility, eliminates diligence roadblocks, and drives high-conviction transaction closures.
Checklist 2: Seller Stranded Cost Elimination & TSA Exit Execution Checklist
Production Prompt Recipe: Generating an Institutional Divestiture & Carve-Out Deck in XLSlides
Role: Senior Corporate Development Director & Carve-Out Advisory Lead (McKinsey / Alvarez & Marsal / Bain M&A Practice) Context: A Fortune 500 industrial conglomerate ($4.2B revenue) is executing the carve-out divestiture of its Specialty Precision Sensor division ($320M revenue, $52M reported division EBITDA) to a tier-1 private equity sponsor for $520M enterprise value (10.0x multiple). The transaction involves extensive shared corporate infrastructure, a 12-month SAP S/4HANA transitional service agreement (TSA), 850 transferring employees across 8 global facilities, and $18M in parent stranded overhead that must be eliminated post-close. Task: Generate an institutional, decision-ready 12-slide executive divestiture and carve-out presentation tailored for the Board of Directors, Private Equity Investment Committee, and Separation Management Office (SMO). Instructions: 1. Slide 1 (Executive Summary): Synthesize transaction rationale, perimeter scope, headline financial terms ($520M EV), standalone run-rate EBITDA ($57.0M), and 12-month TSA flight plan into a high-impact consulting-style dashboard. 2. Slide 2 (Perimeter & Separation Boundary): Present an exhaustive 9-panel perimeter architecture classifying assets, contracts, IP, people, and facilities into Included, Shared (TSA), and Excluded categories. 3. Slide 3 (Audited to Standalone EBITDA Bridge): Build a rigorous 5-step financial waterfall bridging $52M reported division EBITDA to $57M standalone run-rate EBITDA, explicitly detailing the $28M parent allocation add-back and $25M bottoms-up standalone cost burden. 4. Slide 4 (Standalone Corporate Overhead Benchmark): Compare parent corporate allocations vs. bottoms-up standalone budgets vs. peer median benchmarks across IT, Finance, HR, Legal, and Procurement in a clustered comparison layout. 5. Slide 5 (Transitional Service Agreement Master Schedule): Detail 6 TSA functional modules across duration windows (3 to 18 months), cost-plus pricing structures (Cost + 5% to 10%), SLA metrics, and extension penalties. 6. Slide 6 (TSA Duration & Cost-Out Runway): Map the monthly TSA fee burn and parallel stranded cost culling curve over a 24-month horizon, highlighting break-even cutover gates. 7. Slide 7 (Day-1 Operational Readiness Scorecard): Display a red/amber/green readiness matrix across Treasury, Invoicing, Payroll, ERP Access, and Logistics with explicit contingency workarounds. 8. Slide 8 (Separation Management Office Governance Architecture): Detail the 3-tiered SMO organizational hierarchy linking the Executive Steering Committee, Joint Transition Committee, and 5 functional workstream pods. 9. Slide 9 (Technology & ERP Separation Strategy): Contrast the clone-and-go vs. greenfield ERP implementation options, presenting cost, timeline, and risk profiles for the SAP S/4HANA migration. 10. Slide 10 (Seller Stranded Cost Elimination Roadmap): Present an aggressive 100-day restructuring roadmap detailing how the corporate parent will eliminate $18M in stranded overhead across headcount, software, and real estate. 11. Slide 11 (Critical Path Separation Milestones & Downside Risks): Map sequential milestones from Sign to Day-1 to TSA Exit, detailing top 5 operational risks, financial impact, and mitigation protocols. 12. Slide 12 (Decision Matrix & Board Recommendation): Deliver a definitive, quantified closing synthesis with explicit board resolution language, approvals required, and immediate 30-day next steps. Output Format: Structured executive slide deck outline with distinct action titles, quantified key takeaway callout boxes, MECE bullet hierarchies, data tables, and slide reference layout annotations.
Frequently Asked Questions: Executive Divestitures, Carve-Outs, and Corporate Spinoffs
What is the fundamental difference between a carve-out financial statement and a standalone budget?
A carve-out financial statement reflects historical GAAP financials prepared under SEC Staff Accounting Bulletin (SAB) Topic 1-B, which uses formulaic corporate allocations (such as percentage of parent revenue or headcount) to assign shared overhead to the divesting unit. A standalone budget, in contrast, is a bottoms-up operational cost model created by the buyer or management team that quantifies the actual cash required to operate the business independently—including dedicated C-suite salaries, independent ERP licensing, standalone insurance, and separate legal and accounting retainers. In most transactions, standalone G&A costs differ from historical parent allocations by 15% to 40%.
Why do private equity buyers apply a valuation haircut to carve-out transactions?
Private equity buyers discount carve-out valuations due to execution complexity and operational uncertainty. Unlike standalone acquisitions where systems and management teams are proven, carve-outs introduce friction: risk of customer attrition during contract novation, unproven standalone margins, reliance on the seller during the TSA period, technology migration delays, and the upfront cash requirement for one-time separation costs (CapEx and OpEx). Sellers can preserve valuation by presenting granular perimeter definitions, pre-negotiated TSA terms, and audited standalone cost models that eliminate buyer uncertainty.
How long should a Transitional Service Agreement (TSA) typically last?
Best-practice TSAs are structured to terminate as quickly as possible, typically between 6 and 12 months. Routine back-office services such as cash management and basic payroll can often be exited within 3 to 6 months. Complex enterprise systems—such as SAP or Oracle ERP hosting, shared manufacturing supply chains, or international regulatory marketing authorizations—frequently require 12 to 18 months. Contracts should always include financial escalation clauses (e.g., a 25% to 50% price markup after Month 12) to incentivize the buyer to complete standalone migrations on schedule.
What are stranded costs, and how should a corporate seller present them to its board?
Stranded costs represent corporate parent overhead that previously supported the divested division but remains with the parent company after closing. For example, if a parent company's legal and IT departments supported four business units and one is sold, the corporate legal and IT costs do not automatically drop by 25%. Sellers must present their board with an explicit 'Stranded Cost Culling Plan' showing how redundant headcount, excess office leases, and oversized enterprise software licenses will be eliminated within 100 to 180 days post-close, utilizing temporary TSA revenue to offset restructuring cash flow.
What is the difference between a 'Clone-and-Go' and a 'Greenfield' IT separation strategy?
In a 'Clone-and-Go' strategy, the seller's existing enterprise ERP and IT environment is duplicated and isolated for the carved-out business, with non-relevant parent company data subsequently purged. This approach minimizes Day-1 operational risk and accelerates time-to-close, but can saddle the new entity with legacy technical debt and expensive enterprise software licensing. In a 'Greenfield' approach, the buyer builds a brand-new, modern cloud IT architecture from scratch. Greenfield takes longer and requires extensive interim TSA coverage, but delivers a leaner, lower-cost, and more agile standalone technology footprint.
How should executive teams handle customer and vendor contract novation in carve-out decks?
Customer and supplier contracts are frequently held at the corporate parent entity level rather than by the specific operating division being divested. Contract novation requires formal written consent from each third party to transfer rights and obligations to the new legal entity. In carve-out decks, deal teams should present a contract novation waterfall categorizing agreements into Tier-1 (top 80% of revenue/spend, requiring pre-closing bilateral novation), Tier-2 (interim assignment under parental agency), and Tier-3 (post-closing standard cutover). Having pre-drafted novation notices and customer communication playbooks prevents commercial disruption on Day 1.
What governance role does the Separation Management Office (SMO) play versus business-as-usual management?
The Separation Management Office (SMO) operates as an independent, executive-led project governance engine dedicated exclusively to executing the separation. While division operational managers must focus on driving core revenue, customer satisfaction, and daily operations, the SMO manages cross-functional disentanglement: legal entity creation, banking setup, IT migrations, TSA tracking, and regulatory filings. Blending separation duties with daily operational management inevitably leads to either operational performance drops or severe separation milestone delays.
Generate Executive Carve-Out & Divestiture Decks with XLSlides
Stop spending hundreds of manual hours building complex standalone EBITDA bridges, perimeter diagrams, and TSA schedules in generic presentation software. XLSlides automatically synthesizes your financial models, operational workstreams, and separation roadmaps into executive-ready, editable PowerPoint presentations built to institutional consulting standards.
Methodology And Sources
- Deals That Create Value: Carve-Out Strategies(Harvard Business Review • 2016)
Authoritative research on corporate separation strategy, perimeter definition, and value creation in carve-outs.
- How to Master the Art of the Carve-Out(McKinsey & Company • 2023)
Best-practice methodology for separation management offices, standalone cost modeling, and stranded cost elimination.
- Divestitures and Spin-offs: Winning the Carve-Out Deal(Bain & Company • 2024)
Global M&A report on private equity carve-out deal performance, negative synergies, and Day-1 operational readiness.
- Separation Management: Delivering Carve-Out Value(Boston Consulting Group • 2022)
Operational governance framework for transitional service agreements (TSAs) and technology clone-and-go separation.
- Staff Accounting Bulletin (SAB) Topic 1-B: Allocation of Expenses and Related Disclosures in Carve-Out Financial Statements(U.S. Securities and Exchange Commission (SEC) • 2021)
Statutory accounting guidance governing corporate overhead allocations and pro forma financial disclosures in carve-out transactions.