Executive Context: Moving Cloud Modernization from an Engineering Sandbox to a Board-Level Strategic Investment
Key Institutional Takeaways for CIOs, CTOs, and Board Technology Committees
- Position Cloud as a Business Capability Engine, Not an Infrastructure Exercise: Reframe the executive narrative away from server migrations and datacenter floor space toward revenue acceleration, operational resilience, and rapid product development cycles. Datacenter exit is an operational milestone; business agility and customer experience velocity are the real strategic returns on invested capital.
- Enforce Disciplined 6R Portfolio Rationalization: Reject one-size-fits-all migration mandates. Categorize the entire enterprise application estate across the established 6R framework (Rehost, Replatform, Refactor, Repurchase, Retain, Retire). Prioritize retiring redundant legacy software (typically 10%–18% of the application catalog) and repurchasing commodity workflows as SaaS before migrating complex custom systems.
- Frankly Model and Defend the 'Dual-Run Cost Bubble' to the CFO: Never present an overly optimistic hockey-stick cost reduction curve. Publicly model the 12-to-24 month transition window where on-premises datacenter fixed costs and escalating cloud consumption run simultaneously. Establish explicit financial milestones for hardware lease expirations and co-location contract terminations to guarantee the bubble collapses as planned.
- Sequence Workloads into Structured Risk-Calibrated Waves: Avoid the catastrophic 'big bang' datacenter migration approach. Structure workloads across four discrete migration waves: Wave 0 (Cloud Foundation & Security Landing Zone), Wave 1 (Low-Risk Edge & Non-Production Systems), Wave 2 (Core Business Processing & Operational Databases), and Wave 3 (Mission-Critical Transaction Engines & Legacy Datacenter Shutdown).
- Institutionalize Cloud FinOps Governance Before Migrating Production Workloads: Cost governance cannot be an afterthought retrofitted twelve months post-cutover. Establish a cross-functional FinOps practice bridging engineering, finance, and procurement on Day 1. Enforce mandatory resource tagging (minimum 98% compliance), automated compute rightsizing, and committed use discounts (Reserved Instances / Savings Plans) to maintain unit costs within strict budget corridors.
- Establish Quantitative Go/No-Go Cutover Gates with Rehearsed Rollback Protocols: Executive and audit committees require absolute certainty regarding business continuity. Mandate pilot cutovers, synthetic user load testing, and bidirectional database synchronization with zero data loss tolerance (RPO = 0, RTO < 30 minutes) before authorizing permanent DNS cutover and datacenter server decommissioning.
Simulate & Prototype: Cloud Migration & Infrastructure Modernization Presentation Guide: Structuring Executive Decks for Datacenter Exit, 6R Application Rationalization, TCO Reduction, and FinOps Governance
Drag to draw custom components, test consulting layout presets, and preview presentation architecture live before generating with AI.
Exhibit 1: Executive Summary & Enterprise Cloud Modernization Dashboard
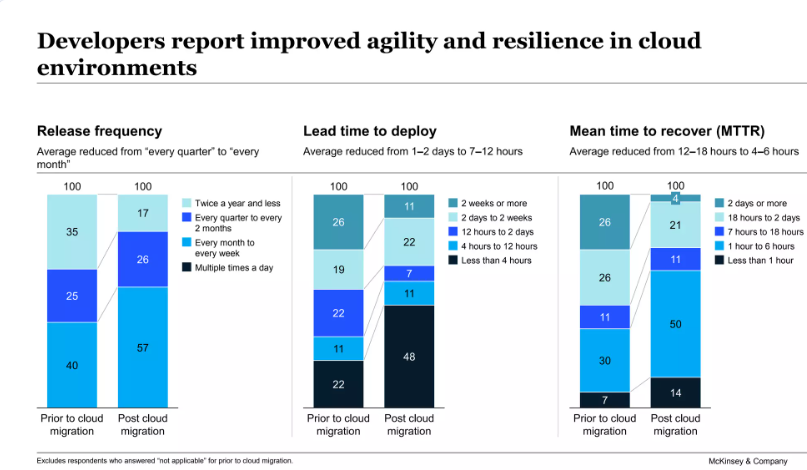
The 6R Application Portfolio Rationalization Methodology: Workload Disposition Architecture
Table 1: The 6R Application Rationalization Decision Matrix
Exhibit 2: 3-Year Total Cost of Ownership (TCO) & Cost-Out Trajectory
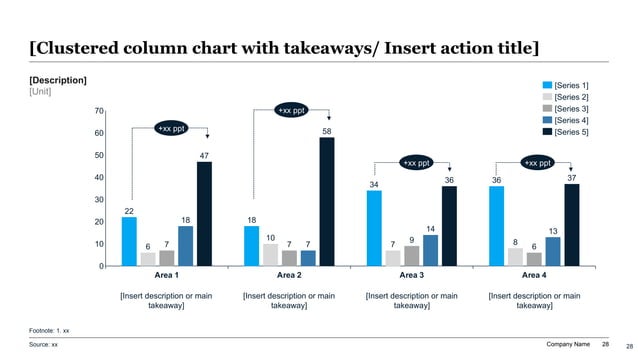
Total Cost of Ownership (TCO) Modeling: Deconstructing Capex-to-Opex Financial Dynamics
Table 2: Datacenter Baseline vs. Dual-Run vs. Cloud Steady-State Financial Bridge ($M)
Exhibit 3: The 6R Application Portfolio Rationalization Matrix
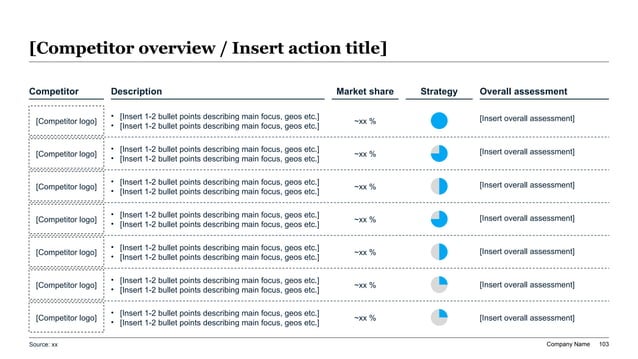
Multi-Wave Migration Architecture: Workload Grouping, Dependency Mapping & Governance Sequencing
Table 3: The 4-Wave Cloud Migration Execution Framework
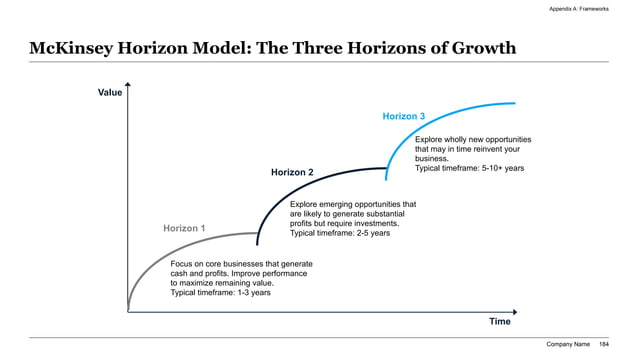
Exhibit 4: Multi-Wave Migration Roadmap & Infrastructure Horizon Sequencing
Cloud FinOps Governance, Unit Economics & Post-Cutover Cost Containment
Table 4: Enterprise Cloud FinOps Maturity Framework: Inform, Optimize, Operate Dimensions & KPI Baselines
Exhibit 5: Cloud FinOps Governance & Cost Optimization Operating Model Architecture
Cutover Governance, Downtime Windows & Rehearsed Rollback Protocols
Checklist 1: The Pre-Migration Architecture & Security Landing Zone Gate: 10 Mandatory Technical & Governance Audits
The Master Cloud Modernization Board Deck Architecture: The 9-Slide Decision-Ready Blueprint
Table 5: The Master Cloud Modernization Board Deck Blueprint: The 9-Slide Decision-Ready Architecture
Checklist 2: The Production Cutover, Rollback Protocol & Datacenter Decommissioning Gate: 10 Operational Milestones
XLSlides Enterprise Cloud Migration & FinOps Board Deck Prompt Recipe
Act as an Enterprise Chief Information Officer (CIO) and former McKinsey Technology Practice Partner advising a Fortune 500 Executive Committee and Board of Directors. Generate an institutional, decision-ready 9-slide presentation blueprint for an Enterprise Cloud Migration and Infrastructure Modernization business case. Context & Strategic Parameters: - Enterprise Profile: Global multi-division enterprise currently operating two legacy co-location datacenters supporting 350 enterprise application workloads and 2,400 physical/virtual server instances. - Burning Platform: Primary datacenter lease expires in 22 months with an unavoidable $14.6M server/SAN storage hardware refresh wall looming within 18 months. - Transformation Scope: Full datacenter exit executing the 6R Application Portfolio Rationalization framework across AWS, Azure, and modern SaaS platforms. - Financial Envelope: Current on-premises baseline of $48.2M/year. Modeling an 18-month dual-run cost bubble peaking at $54.6M in Year 1, stabilizing into a permanent steady-state cloud run-rate of $32.8M/year by Year 3 (32% net TCO savings, $15.4M annual recurring cash liberation, 28-month payback). - Governance & FinOps: Cross-functional Cloud Center of Excellence (CCoE) and FinOps practice targeting >98% resource tagging, 85% Savings Plan commitment coverage, automated compute rightsizing, and cloud unit cost reductions. Presentation Blueprint Requirements: 1. Slide 1 (Executive Summary): Craft a high-impact action title, 3-pillar strategic choice canvas (Business Velocity, Operational Resilience, TCO Reduction), core financial return badges, and executive briefing. 2. Slide 2 (The Burning Platform): Quantify aging on-premises infrastructure risks, server hardware warranty expiration cliffs, co-location lease penalties, and virtualization licensing overhead. 3. Slide 3 (6R Rationalization Matrix): Provide a comprehensive breakdown of the 350 workloads across Retire (16%), Retain (10%), Repurchase SaaS (20%), Rehost (28%), Replatform (22%), and Refactor (12%), with explicit dollar savings from early retirements. 4. Slide 4 (3-Year TCO Financial Bridge): Construct a detailed financial waterfall contrasting on-prem baseline, Year 1 transition bubble, Year 2 optimization, and Year 3 steady-state, explicitly explaining Capex-to-Opex EBITDA dynamics. 5. Slide 5 (Multi-Wave Execution Roadmap): Sequence execution across Wave 0 (Landing Zone & Foundations), Wave 1 (Pilot & Dev/Test), Wave 2 (Core Business Apps), and Wave 3 (Mission-Critical ERP & Datacenter Exit), with dependency mapping logic. 6. Slide 6 (Security & Compliance): Detail zero-trust landing zone architecture, KMS customer-managed encryption, IAM least-privilege, and SOC 2 / ISO 27001 audit validation. 7. Slide 7 (Cloud FinOps Operating Model): Outline the Inform, Optimize, and Operate framework, resource tagging policies, commitment discount modeling, and unit cost per transaction KPIs. 8. Slide 8 (Production Cutover & Rollback): Define cutover choreography, zero-loss database replication (RPO=0, RTO<30m), Point of No Return milestones, and rehearsed rollback safety nets. 9. Slide 9 (Governance & Capital Request): Detail program steering cadence, phase-gate funding tranches, and formal Board capital authorization request. Formatting Standards: Enforce strict consulting-style action titles (not topic labels), data-dense analytical bullet points, quantitative takeaways on every slide, and structured visual exhibit layouts.
Executive & Technical FAQ: Frequently Asked Questions on Board-Ready Cloud Decks
How should a CIO address recent corporate discussions around 'cloud repatriation' when presenting to the Board?
Acknowledge the repatriation debate directly rather than ignoring it. High-profile repatriation stories (e.g., Basecamp/37signals) occurred because organizations with static, predictable computing loads ran standard virtual machines on retail on-demand cloud pricing without utilizing elastic scaling, managed cloud databases, or FinOps commitment discounts. Clarify to the Board that cloud repatriation is economically viable only for a tiny fraction of companies with predictable 24/7 compute loads, highly specialized in-house infrastructure teams, and minimal need for rapid geographic expansion. For 95% of diversified enterprises, cloud modernization provides superior security posture, access to continuous AI and analytics innovation, elastic scalability for fluctuating demand, and avoids multi-million dollar physical datacenter capital reinvestment cycles.
How can technology leaders explain the 'dual-run cost bubble' without causing panic in FP&A and the CFO's office?
Transparency and contractual rigor are essential. Frame the dual-run cost bubble not as a cost overrun, but as a deliberate capital investment required to de-risk migration and guarantee business continuity. Present the bubble as a finite 12-to-18 month bridge in the TCO financial waterfall. Critically, tie the reduction of the bubble directly to hard operational milestones: datacenter lease notification deadlines, physical server lease expirations, and software license termination dates. By demonstrating that the organization has mapped exactly when co-location contracts expire and when third-party software agreements lapse, the CFO gains confidence that the bubble will collapse on schedule into the projected 30%+ run-rate savings.
How does shifting from Capital Expenditure (CapEx) to Operating Expenditure (OpEx) affect corporate EBITDA, and how should it be defended?
In traditional accounting, on-premises hardware purchases are capitalized on the balance sheet and depreciated below the line (depreciation expense does not reduce EBITDA). When transitioning to the cloud, monthly consumption bills hit operating expenses directly, which can mechanically reduce reported EBITDA unless the business proactively plans for it. To defend this to the CFO and Board, emphasize three financial truths: First, total net cash outflow decreases by 30%+ over the multi-year cycle (Free Cash Flow increases). Second, capital previously locked in non-revenue-generating server hardware is liberated to fund organic growth initiatives or debt reduction. Third, work with corporate finance to capitalize allowable cloud implementation and application refactoring expenses under modern accounting standards (such as ASC 350-40, Customer's Accounting for Implementation Costs Incurred in a Cloud Computing Arrangement).
What is the biggest operational mistake enterprises make when executing the 6R Application Rationalization framework?
The most common operational mistake is failing to aggressively 'Retire' and 'Repurchase' applications before initiating migrations. Engineering teams often default to lifting and shifting everything that currently exists in the datacenter, including zombie servers, obsolete staging databases, and redundant commercial tools. In an institutional review, 10% to 18% of the application inventory should be retired immediately. Failing to decommission these workloads forces the enterprise to waste time, security testing, and cloud hosting spend on applications that provide zero commercial value. A disciplined rationalization phase pays for itself by eliminating legacy software maintenance fees before migration execution begins.
How should a CIO present multi-cloud strategy versus single-cloud provider commitment to the Board?
Avoid theoretical academic discussions about avoiding vendor lock-in. While running workloads across multiple public clouds (e.g., AWS and Azure simultaneously) sounds appealing in theory, in practice it introduces severe architectural complexity, duplicates network security overhead, fragments engineering talent, and dilutes procurement volume discounts. The recommended executive positioning is 'Primary Cloud with Strategic SaaS/PaaS Adjacencies.' Select one primary cloud partner (AWS, Azure, or GCP) where 75%–85% of core infrastructure resides to maximize commitment tier discounts (Savings Plans / EDP contracts), while maintaining portable containerized application architectures and using secondary cloud providers only where distinct best-of-breed capabilities (e.g., specialized AI/ML tools or enterprise Microsoft integration) clearly justify the overhead.
How does a Cloud Center of Excellence (CCoE) differ from traditional central IT infrastructure teams?
Traditional central IT operated as a command-and-control gatekeeper: developers submitted tickets requesting virtual machines or firewall port changes, and infrastructure teams manually provisioned resources over weeks or months. A Cloud Center of Excellence (CCoE) operates as a product and enablement platform. Rather than manually configuring servers, the CCoE engineers reusable, compliant Infrastructure-as-Code modules (Terraform landing zones, automated CI/CD pipelines, pre-approved security architectures) that allow distributed engineering teams to self-service cloud resources within strict, automated security and FinOps guardrails.
What specific metrics should the Board Technology Committee review on a quarterly basis post-migration?
The Board should not review technical server logs or CPU utilization percentages. They should monitor five strategic governance KPIs: 1) FinOps Unit Cost Velocity (cloud spend normalized per business transaction, active user, or order), 2) FinOps Allocation Hygiene (% of cloud spend untagged, targeting <1.5%), 3) Commitment Coverage Ratio (% of baseline compute covered by Reserved Instances/Savings Plans, targeting 80%–88%), 4) Deployment Velocity (lead time from code commit to production release), and 5) Disaster Recovery Resilience (mean time to recovery MTTR and verified RPO/RTO audit results).
Internal Resources: Enterprise IT Strategy, Board Governance & Financial Modernization Toolkits
Equip Your Technology Leadership with Institutional, Board-Ready Cloud Presentation Decks
Eliminate Visio network diagrams and confusing server tallies. XLSlides equips CIOs, CTOs, Enterprise Cloud Architects, and Technology Consultants with professional, editable PowerPoint presentations that communicate 6R portfolio rationalization, multi-year TCO economics, and FinOps unit cost governance with boardroom precision.