Executive Overview: The Anatomy of a High-Conviction Strategic Planning Presentation
Every year, thousands of executive leadership teams dedicate months of analytical labor to corporate strategic planning, only to produce presentation decks that are discarded within weeks of board review. The failure mode is almost always structural: the presentation reads like a compendium of disjointed departmental wish-lists, padded with generic corporate vision statements, decorative stock icons, and unquantified growth ambitions. A strategic planning presentation is not an annual budget review, nor is it an inspirational town hall speech. At its core, an executive strategic planning presentation is a rigorous, decision-oriented instrument designed to establish clear corporate boundaries, articulate where the enterprise will play and how it will win, reallocate scarce capital and talent across business units, and define an accountable multi-year execution roadmap.
In senior corporate governance and strategy consulting (McKinsey, BCG, Bain, Strategy&), a board-level strategic plan serves three indispensable functions. First, it forces strategic clarity through explicit trade-offs. As Michael Porter famously observed, the essence of strategy is deciding what not to do; a presentation that promises to pursue every available market adjacency, customer segment, and technology trend is not a strategy—it is an abdication of leadership. Second, it establishes an economic contract between the Board of Directors, the Chief Executive Officer, the Chief Strategy Officer (CSO), and business unit presidents. It links multi-year capital expenditure (CapEx), operating expenses (OpEx), and balance sheet allocations to targeted Return on Invested Capital (ROIC) spreads and market share expansion. Third, it provides the operational bridge from high-level ambition to quarterly execution, establishing a Strategy Realization Office (SRO) governance cadence, lead indicators, and milestone stage-gates that ensure the organization delivers its underwritten value creation targets.
To command the conviction of seasoned directors, institutional investors, and operating executives, a strategic plan must be structured around answer-first logic (the Minto Pyramid Principle), MECE (Mutually Exclusive, Collectively Exhaustive) problem categorization, and empirical market evidence. This comprehensive guide details the six-phase enterprise strategic planning methodology, provides institutional slide architectures, dissects five bespoke visual exhibits from the XLSlides reference library, outlines concrete trade-off matrices, and shares an advanced AI prompt recipe to accelerate deck authoring while maintaining peerless executive rigor.
The 10-Point Pre-Planning Readiness & Data Integrity Audit
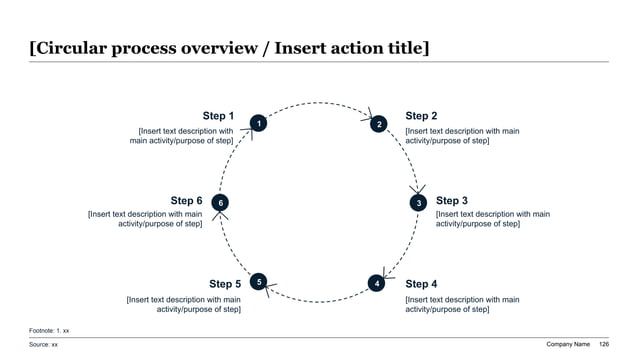
Exhibit 1: The Enterprise Strategic Planning Cycle: A 6-Stage Continuous Governance Loop
Phase 1 & 2: Macro Environmental Scanning, Industry Disruption & Competitive Dynamics
The foundation of every defensible strategic plan is an objective, unsentimental assessment of the external operating environment. Too many corporate presentations commit the fatal error of beginning with internal capabilities, organizational charts, or budgetary requests before establishing whether the market winds are at their back or in their face. In an executive presentation, the Environmental Scan must accomplish three specific objectives: isolate high-impact structural macro shifts, quantify changes in industry profit pools, and expose the underlying competitive forces that threaten enterprise economic rents.
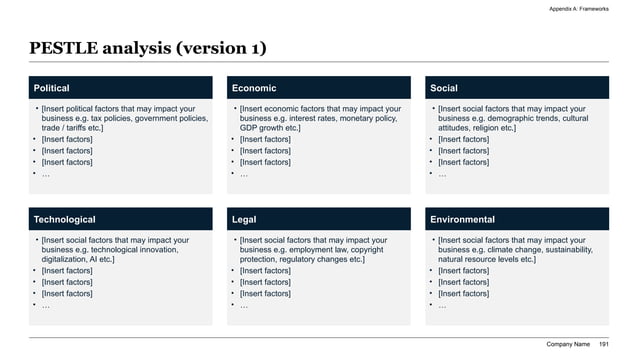
To avoid the dreaded 'laundry list' trap—where presenters fill slides with twenty bullet points of generic news clippings—strategy practitioners utilize structured frameworks like the 2x3 PESTLE Matrix (Political, Economic, Social, Technological, Legal, Environmental) and Michael Porter's Five Forces. However, in an executive board deck, each quadrant must be ruthlessly filtered through the lens of strategic materiality. It is not enough to state that 'artificial intelligence is accelerating' or 'interest rates remain elevated.' A consultant-grade presentation quantifies the exact mechanism of impact: for instance, 'Generative AI adoption in our core customer segment reduces custom software development cycles by 40%, threatening our professional services margin profile while creating a $180M software-as-a-service expansion window.'
Furthermore, competitive analysis must move beyond superficial 2x2 bubble charts that conveniently place the presenter's company in the top-right quadrant. Sophisticated directors expect a dynamic game-theoretic view of the competitive landscape. This includes mapping competitor cost curves, capacity utilization rates, capital structures, and historical investment behaviors. If your strategic plan calls for capturing 300 basis points of market share in an adjacent category, the deck must explicitly demonstrate whose revenue will be taken, how those incumbents are likely to respond (e.g., predatory discounting, litigation, proprietary bundling), and why your cost or capability advantage is durable enough to withstand their retaliation.
Exhibit 2: Macro Environmental Scan: 2x3 PESTLE Assessment Matrix
Comparative Framework: Strategic Planning Presentation vs. Annual Operating Plan vs. Strategy Recommendation Deck
| Strategic Dimension | Strategic Planning Presentation (3–5 Year Horizon) | Annual Operating Plan / Budget (1-Year Horizon) | Strategy Recommendation Deck (Discrete Decision) |
|---|---|---|---|
| Primary Executive Purpose | Establish corporate direction, define where-to-play choices, allocate capital across portfolio units, and build economic moats. | Operationalize the upcoming fiscal year into detailed departmental budgets, hiring plans, revenue targets, and cost quotas. | Secure board or investment committee approval for a single high-stakes strategic transaction, market entry, or capital commitment. |
| Time Horizon & Scope | 3 to 5 years; enterprise-wide corporate portfolio spanning all business units, shared services, and strategic horizons. | 12 months (broken into quarters); functional departmental budgets (Sales, Marketing, R&D, G&A, Operations). | Discrete project timeline (e.g., 6–18 months for execution; 3–5 year return underwrite); focused on a single initiative. |
| Financial Modeling Depth | Macro financial ambition, portfolio revenue CAGR, gross margin expansion targets, CapEx envelope, and ROIC spread over WACC. | Micro line-item P&L, monthly cash flow forecasts, headcount rosters, vendor expense line items, and department variance thresholds. | Detailed standalone pro-forma financial model, DCF valuation, IRR/MOIC sensitivity curves, synergy bridge, and payback period. |
| Governance & Approval Forum | Full Board of Directors, Board Strategy Committee, Chief Executive Officer, Chief Strategy Officer, and Business Unit Heads. | Chief Financial Officer, Board Audit & Finance Committee, Executive Leadership Team, and FP&A Directors. | Board Investment Committee, Executive Committee, Corporate Development M&A Committee, or Specialized Steering Committee. |
| Decision Mechanism & Output | Strategic Choice Cascade ratification, multi-year capital rationing mandates, and enterprise strategic initiative chartering. | Fiscal year financial budget baseline authorization, executive compensation target setting, and operational quota lock. | Binding Go / No-Go vote, capital disbursement authorization, or deal execution contract signing. |
| Typical Slide Architecture | 12–15 core slides: Executive summary, macro scan, portfolio evaluation, 3 strategic pillars, initiative scorecard, roadmap, governance. | 20–30 slides: Financial walk, revenue bridge by product line, headcount growth, OpEx breakdown, quarterly milestones, contingency plans. | 10–14 slides: Executive answer-first memo, strategic rationale, financial valuation, operational execution plan, downside risks, decision request. |
Phase 3: Corporate Portfolio Evaluation, Growth Pools & Dynamic Resource Reallocation
One of the most consequential discoveries in corporate strategy research—validated across multi-decade empirical studies by McKinsey & Company—is that dynamic capital reallocation is the single greatest driver of long-term Total Shareholder Return (TSR). Companies that actively and aggressively reallocate capital away from declining or mature legacy lines toward high-potential growth pools outperform static budgeters by over 30% across economic cycles. Yet, in most organizations, corporate inertia results in 'peanut butter budgeting,' where each business unit receives roughly the same annual budget increase or decrease regardless of its underlying ROIC or market growth velocity.
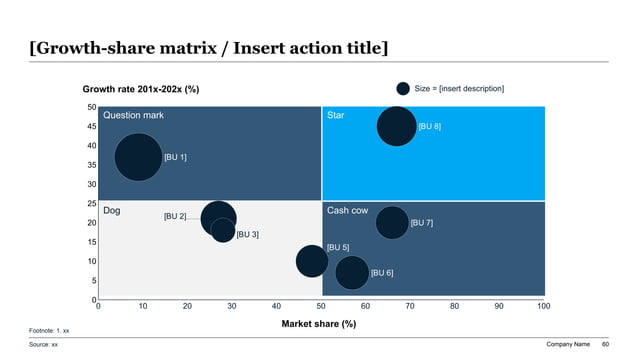
A high-impact strategic planning presentation breaks this inertia by submitting every business unit and product line to rigorous portfolio evaluation. Traditional tools like the Boston Consulting Group (BCG) Growth-Share Matrix (Exhibit 3) and the GE-McKinsey 9-Box Matrix remain indispensable in boardroom settings because they force clear, unambiguous categorization. Each business unit must be assigned a deliberate corporate role: Cash Cow, Star, Question Mark, or Legacy Harvest.
Crucially, assigning a portfolio role is not an academic labeling exercise; it dictates the exact capital allocation and financial hurdle rates that govern each unit. Cash Cows (mature, highly cash-generative businesses with dominant market share in slowing markets) must be managed for cash extraction, high dividend return, and tight operational cost controls, with their liberated free cash flow channeled into corporate treasury rather than local empire-building. Stars (high-growth market leaders) must receive aggressive CapEx and talent priority to solidify structural network effects and economies of scale before competitive moats erode. Question Marks (businesses in hyper-growth markets where the enterprise currently lacks dominant share) must be subjected to strict phase-gated milestone reviews: either fund them with sufficient capital to achieve top-two market positioning within 24 months, or execute a disciplined divestiture or partnership. Presenting these distinctions visually in a BCG bubble chart forces executive leadership and the board to confront portfolio realities with quantitative clarity.
Exhibit 3: Business Unit Portfolio Mapping: BCG Growth-Share Matrix
Corporate Portfolio Strategic Roles: Growth Mandate, CapEx Envelope & Hurdle Rates
| Portfolio Tier & Strategic Role | Representative Business Units | Growth Mandate (3-Yr Revenue CAGR) | CapEx Allocation (% of Annual Pool) | Target ROIC Hurdle Rate vs. WACC | Underwritten Corporate Governance Mandate |
|---|---|---|---|---|---|
| Tier 1: Core Cash Engines (Cash Cows) | Enterprise Core Licensing & Legacy On-Premise Maintenance Contracts | 2% to 4% CAGR | 15% of total CapEx | ROIC > WACC + 12.0% | Maximize free cash flow conversion (>85%); implement automated cost-out programs; reallocate liberated cash flow to corporate growth engines. |
| Tier 2: High-Growth Flagships (Stars) | Cloud-Native Enterprise SaaS Platform & Unified Data Intelligence Suite | 22% to 28% CAGR | 55% of total CapEx | ROIC > WACC + 6.0% (Scaling to +15% at maturity) | Aggressive market share capture; front-load R&D and enterprise go-to-market capacity; build structural enterprise switching moats. |
| Tier 3: Scaled Adjacencies (Question Marks) | Automated Workflow AI Copilot & Embedded FinTech Payment Orchestration | 40% to 65% CAGR | 25% of total CapEx | ROIC Hurdle evaluated at Year 3 milestone gate | Subject to strict 18-month stage-gate milestones; must achieve Top-3 competitive ranking or trigger strategic spin-out / divestiture. |
| Tier 4: Non-Core Legacy / Harvest (Dogs) | Custom Professional Services Division & Legacy Hardware Appliance Line | Negative (-5% to -10% CAGR) | 5% of total CapEx (Sustaining maintenance only) | ROIC < WACC | Execute managed wind-down or formal corporate carve-out; monetize customer base via migration pathways to Tier 2 platform. |
Phase 4: Defining the Strategic Choices—Where to Play, How to Win & The 3 Strategic Pillars
Having analyzed the macro landscape and evaluated the corporate portfolio, the strategic planning presentation enters its most critical chapter: defining the enterprise strategy. In modern management theory, the gold standard for strategic formulation is the Strategic Choice Cascade pioneered by A.G. Lafley and Roger L. Martin in 'Playing to Win.' Strategy is not a collection of aspirational goals; it is an integrated set of five mutually reinforcing choices: (1) What is our winning aspiration? (2) Where will we play? (3) How will we win where we play? (4) What core capabilities must be in place? (5) What management systems are required to support those choices?
In an executive slide deck, the 'Where to Play' choices must be specified with surgical precision. It is unacceptable to define Where to Play as 'global enterprise software.' Directors need to see exact vertical boundaries: which customer segments (e.g., Fortune 500 financial institutions with >$2B in assets), which geographic corridors (e.g., North America and Western Europe, pausing Asia-Pacific expansion), which delivery channels (direct enterprise sales force supported by Tier-1 systems integrators), and which product tiers (subscription software with usage-based API metering). Every inclusion in Where to Play implies a conscious, explicit exclusion of other markets.
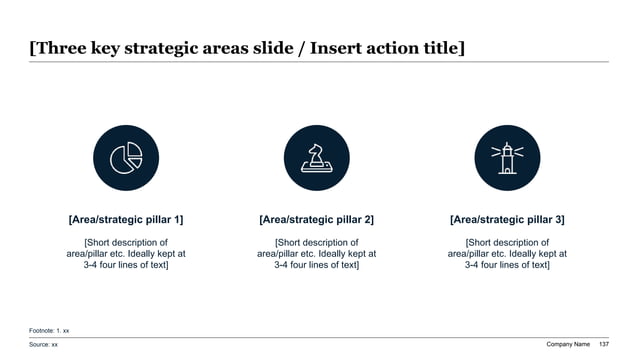
Similarly, 'How to Win' defines the sustainable economic moat that enables the firm to generate superior economic returns compared to competitors. Will you win through proprietary technological performance, massive cost advantage via operational automation, deep domain workflow specialization, or bilateral platform network effects? Once How to Win is articulated, the presentation synthesizes the entire corporate strategy into three core Strategic Pillars (Exhibit 4). Three pillars represent the cognitive sweet spot for executive boards and frontline organizations alike. More than four pillars dilutes focus, creates organizational turf wars, and confuses capital rationing. Each pillar must be anchored by a quantified multi-year value creation ambition, clear functional enablers, and unambiguous leadership accountability.
Exhibit 4: The 3 Core Strategic Pillars & Value Creation Engine
Phase 5: Strategic Initiative Prioritization, Trade-offs & Capital Rationing
The graveyard of corporate strategy is filled with presentations that featured brilliant vision statements but failed to establish capital rationing and initiative prioritization. When strategic planning cycles conclude, corporate strategy teams are typically besieged by dozens of competing proposals from business unit presidents, regional directors, and functional leaders. If an executive committee approves forty initiatives, they have effectively chosen zero, because enterprise focus, management bandwidth, and capital are finite resources.
An institutional strategic planning presentation solves this challenge through a rigorous Two-Tier Initiative Gating Matrix. Every proposed initiative must be plotted on an Impact vs. Feasibility grid, evaluating both net value potential (run-rate EBITDA expansion, revenue accretion, customer retention impact) and implementation feasibility (capital expenditure, software architecture complexity, regulatory hurdles, organizational change management friction). From this pipeline, only the top seven initiatives are elevated to the Enterprise Strategic Scorecard (Exhibit 5).
Equally important is the formal articulation of deliberate trade-offs: 'What We Deliberately Will NOT Do.' Boards of directors frequently express skepticism when management teams present only upside scenarios. Presenting a formal Strategic Trade-off Matrix demonstrates managerial maturity and strategic discipline. It signals to the board that executive leadership has calculated the opportunity cost of its decisions, actively rejected distracting projects, and fortified the enterprise against scope creep.
Exhibit 5: Strategic Initiative Prioritization & Accountability Scorecard
Strategic Trade-off Matrix: Explicit Strategic Commitments vs. What We Deliberately Will NOT Do
| Strategic Domain | What We WILL Do (Funded Strategic Priorities) | What We Deliberately Will NOT Do (Strategic Exclusions) | Strategic Rationale & Organizational Resource Defense |
|---|---|---|---|
| Customer Segmentation & Target Accounts | Focus 80% of direct enterprise sales capacity on Upper Mid-Market and Tier-1 Enterprise clients ($500M+ revenue) with multi-product expansion potential. | Will NOT chase small-business (SMB) or low-ACV (<$25K) transactional customer accounts, despite inbound lead volume. | SMB customer acquisition costs (CAC) and high churn rates (2.5%/mo) erode gross margin profile; large enterprise accounts deliver 125% Net Revenue Retention (NRR). |
| Product Architecture & Custom Engineering | Invest exclusively in multi-tenant cloud-native software features that serve the broad platform base and drive recurring software margins (>82%). | Will NOT build one-off custom code, proprietary on-premise connectors, or bespoke client-specific features for individual deals. | Custom engineering creates catastrophic technical debt, balloons ongoing support overhead, and transforms high-margin SaaS into low-margin systems integration. |
| Geographic Market Expansion | Deepen penetration in core North American enterprise corridors and expand into English-speaking Tier-1 European markets (UK, Nordics, DACH). | Will NOT enter Asia-Pacific or Latin American jurisdictions during the current 3-year strategic cycle. | Expanding into fragmented, multi-lingual markets requires disproportionate compliance, localization, and legal overhead, diluting focus from dominant domestic positions. |
| Mergers & Acquisitions (M&A) Strategy | Pursue targeted bolt-on acquisitions (<$75M enterprise value) that bring proprietary intellectual property, patented AI models, or specialized engineering teams. | Will NOT execute large, transformational scale M&A that requires massive debt leverage or multi-year systems integration programs. | Historical industry data demonstrates that 70% of large transformational mergers fail to achieve projected synergy targets and derail core organic execution. |
| Pricing & Commercial Contracting | Enforce standardized multi-year enterprise contracts with contractual 5% annual CPI escalators and value-based consumption tiers. | Will NOT grant non-standard uncapped indemnifications, perpetual license buyout options, or predatory discounting exceeding 15%. | Protecting long-term enterprise pricing power and contract predictability is paramount for sustaining premium EBITDA valuation multiples. |
Phase 6: Multi-Year Transformation Roadmaps & Strategic Stage-Gate Governance
The final section of the strategic planning presentation transitions from conceptual strategy to operational execution. In executive governance, a strategy without a phase-gated execution roadmap is merely an aspiration. The boardroom presentation must outline a 3-Year Strategic Roadmap structured across Three Horizons of Growth: Horizon 1 focuses on defending and optimizing core profitability (Months 1–12); Horizon 2 scales validated high-growth adjacencies into primary revenue engines (Months 13–24); and Horizon 3 establishes speculative options and seed investments in emerging disruptive technologies (Months 25–36).
To ensure execution fidelity, the presentation must define the organizational governance machinery that will manage delivery: the Strategy Realization Office (SRO) or Enterprise PMO. The SRO is not a passive tracking group; it is empowered by the CEO and CSO to conduct bi-weekly initiative health checks, monitor leading Key Risk Indicators (KRIs), manage cross-functional resource bottlenecks, and report quarterly progress directly to the Board Strategy Committee.
Finally, the deck must establish the Trigger-Based Strategy Recalibration protocol. While the strategic plan outlines a 3-year trajectory, external market realities change rapidly. The presentation must pre-identify the macroeconomic, regulatory, or competitive triggers that would automatically initiate a formal strategy review (e.g., competitor price reductions exceeding 20%, regulatory restrictions on core data transmission, or customer churn exceeding established tolerance bounds). By defining these guardrails upfront, management reassures directors that the organization possesses both strategic clarity and operational agility.
Boardroom Readiness & Strategic Presentation Quality Audit
AI-Powered Strategic Planning Workflow: Combining Algorithmic Speed with C-Suite Judgment
The authoring of an executive-grade strategic planning presentation has historically required hundreds of hours of manual slide drafting, data table formatting, and layout revisions by corporate development managers and external strategy consultants. Today, generative AI platforms like XLSlides are fundamentally transforming this workflow. By automating the labor-intensive mechanics of slide production—converting raw spreadsheets into structured financial exhibits, generating clean MECE layout architectures, and drafting precise action titles—AI enables corporate strategy teams to compress deck preparation timelines from four weeks to forty-eight hours.
However, deploying AI in board-level strategic planning requires a sophisticated understanding of where automation adds leverage and where senior executive judgment must remain paramount. AI excels at rapid synthesis: ingesting annual operating data, identifying historical growth patterns, generating alternative competitive scenario frameworks, and formatting standardized consulting templates. What AI cannot do is make strategic choices. An algorithm cannot determine an enterprise's risk appetite, balance competing political priorities among business unit leaders, assess the cultural resilience of an organization undergoing restructuring, or assume fiduciary accountability before a Board of Directors.
The most effective strategy teams utilize a collaborative workflow: human strategists define the core strategic choices, trade-offs, and economic assumptions; XLSlides translates those decisions into executive-ready slide decks with pristine visual hierarchy; and leadership reviews, refines, and stress-tests the output. The prompt recipe below illustrates how to structure complex strategic inputs into XLSlides to generate an institutional corporate strategy deck ready for boardroom presentation.
Institutional Strategic Planning Deck Prompt Recipe for XLSlides
Act as a Senior Partner in McKinsey & Company's Corporate Strategy & Governance Practice advising the CEO, Chief Strategy Officer (CSO), and Board of Directors of an enterprise corporation ($1.2B revenue, 18% adjusted EBITDA margin). Generate an executive-grade, decision-ready 12-slide Strategic Planning Presentation for the upcoming Board of Directors strategy offsite. The deck must establish the 3-to-5 year strategic plan, allocate capital across three business units, and authorize seven enterprise-defining strategic initiatives. Follow these structural, analytical, and formatting requirements strictly: 1. GOVERNING PRINCIPLES: - Apply Barbara Minto's Pyramid Principle: answer-first logic with every slide featuring a complete, declarative Action Title summarizing the strategic takeaway. - Maintain strict MECE (Mutually Exclusive, Collectively Exhaustive) structuring across all portfolio and initiative categorizations. - Incorporate Roger Martin's 'Playing to Win' framework (Winning Aspiration, Where to Play, How to Win, Core Capabilities, Management Systems). - Use precise financial terminology: ROIC vs. WACC spread, Free Cash Flow Conversion, 3-Year Revenue CAGR, Run-Rate EBITDA impact, and Capital Allocation Envelope. 2. MANDATORY SLIDE ARCHITECTURE (12-SLIDE MASTER FLOW): - Slide 1: Executive Summary & Governing Strategic Ambition (Pyramid principle synthesis; 3-year revenue ambition from $1.2B to $1.85B; target EBITDA margin expansion from 18% to 24%). - Slide 2: Macro Environmental Scan & Industry Disruption (2x3 PESTLE framework highlighting top 3 structural shocks and profit pool migrations). - Slide 3: Five Forces Competitive Dynamics & Incumbent Moat Erosion (Mapping changing supplier power, customer consolidation, and threat of software disruption). - Slide 4: Corporate Portfolio Evaluation (BCG Growth-Share Matrix classifying Business Unit A as Cash Cow, Unit B as Star, and Unit C as Question Mark with capital reallocation mandates). - Slide 5: Strategic Choice Cascade: Where to Play (Specific customer segments, geographic focus, and delivery channels, paired with explicit exclusion zones). - Slide 6: Strategic Choice Cascade: How to Win (Articulating core competitive advantage, proprietary technology moat, and customer switching cost dynamics). - Slide 7: The 3 Core Strategic Pillars (Pillar 1: Enterprise Core Expansion; Pillar 2: AI-Powered Operational Velocity; Pillar 3: Embedded Platform Adjacencies). - Slide 8: Strategic Trade-offs & What We Deliberately Will NOT Do (Structured matrix detailing rejected market segments, custom code requests, and unviable M&A). - Slide 9: Strategic Initiative Prioritization Scorecard (7-row detail list with executive sponsors, CapEx/OpEx funding, milestone stage-gates, and EBITDA impact). - Slide 10: Multi-Year Transformation Roadmap across Three Horizons (Horizon 1 Core Optimization, Horizon 2 Adjacent Scaling, Horizon 3 Disruption Bets). - Slide 11: Strategy Realization Office (SRO) & Board Governance Cadence (SRO organization, leading KRIs, bi-weekly health checks, quarterly board reporting). - Slide 12: Board Resolution & Capital Allocation Authorization Request (Formal board approval request for multi-year strategy and initial $65M CapEx commitment). 3. FINANCIAL & DATA ASSUMPTIONS: - Current Revenue: $1,200M | FY+3 Target Revenue: $1,850M (15.6% CAGR). - Current EBITDA: $216M (18.0%) | FY+3 Target EBITDA: $444M (24.0%). - 3-Year Capital Allocation Envelope: $180M total CapEx ($27M Cash Cow sustaining, $99M Star expansion, $45M Question Mark milestone, $9M Non-core). - Cost of Capital (WACC): 8.5% | Target Enterprise ROIC: 16.5% (+800 bps spread). Output the entire deck structure with slide-by-slide action titles, visual layout specifications, executive bullet commentary, data exhibits, and source footnotes.
Curated Strategic Planning & Executive Governance Cluster Resources
Frequently Asked Questions: Executive Strategic Planning Presentations
How long should an executive strategic planning presentation be for a Board of Directors meeting?
For a formal Board of Directors strategy offsite or review meeting, the core presentation deck should strictly contain between 10 and 15 slides. Executive directors evaluate strategic direction, capital allocation, and risk management—they do not need granular departmental task lists. A disciplined 12-slide deck enables leadership to spend 20 minutes presenting and 40 minutes engaging in substantive strategic debate. Supplementary materials—such as detailed segment financial walks, competitor profiles, technology roadmaps, and sensitivity tables—should be housed in an organized appendix of 15–25 slides ready for immediate retrieval during Q&A.
What is the difference between a Strategic Plan and an Annual Operating Plan (AOP)?
A Strategic Plan establishes the 3-to-5 year enterprise direction, articulates where the company will compete, defines sustainable competitive advantages (How to Win), categorizes business units in the corporate portfolio, and sets high-level capital allocation envelopes. An Annual Operating Plan (AOP) is a 1-year tactical execution budget that translates the upcoming 12 months of that multi-year strategy into departmental revenue quotas, hiring plans, line-item OpEx, and quarterly operational milestones. Strategy defines the destination and capital boundaries; the AOP allocates the near-term operational fuel.
Why do so many executive strategic plans fail during implementation?
Strategic plans fail primarily due to three systemic breakdown points: (1) Absence of real trade-offs: leadership fails to decide what NOT to do, spreading capital and talent across too many competing projects; (2) Lack of capital reallocation: corporate inertia results in static budgeting, leaving new strategic priorities underfunded while legacy units consume excess capital; and (3) Broken governance: the strategy deck is shelved after board approval because the enterprise lacks an empowered Strategy Realization Office (SRO) to track milestone stage-gates and hold executive sponsors accountable.
How should an executive leadership team handle divergent strategic opinions before presenting to the board?
Divergent strategic opinions must be surfaced, rigorously debated, and resolved during pre-planning executive workshops before setting foot in the boardroom. A divided management team presenting conflicting strategic priorities to a board destroys executive credibility. The CSO should conduct pre-meeting alignment sessions using Roger Martin's 'What would have to be true?' technique to objectively evaluate competing assumptions against empirical data. If genuine strategic options remain, the deck should explicitly present them as discrete scenarios with comparative financial trade-offs for board input.
What makes an action title effective on a strategic planning slide?
An effective action title is a complete, declarative sentence that summarizes the governing takeaway of the slide, explains the 'so what,' and leads directly to the strategic conclusion. For example, instead of a passive label like 'Market Sizing Analysis,' an institutional action title states: 'Enterprise Cloud Transition Expands Our Serviceable Market to $4.2B, Creating a 24-Month Window to Capture Market Leadership.' A senior director reading only the action titles from Slide 1 to Slide 12 should absorb the entire strategic argument without reading a single bullet point.
How often should a corporate strategic plan be formally updated?
Best-practice corporate governance operates on a three-tier cadence: (1) Annual Full Strategic Refresh: a comprehensive review of macro trends, portfolio roles, and 3-year financial ambition conducted ahead of the annual budgeting cycle; (2) Quarterly SRO Milestone Reviews: an executive committee and board committee check on strategic initiative delivery, leading KRIs, and resource reallocation; and (3) Trigger-Based Strategy Recalibration: immediate ad-hoc review triggered when pre-defined external events occur (e.g., disruptive M&A by a competitor, regulatory prohibition, or severe macroeconomic downturns).
Can AI presentation software generate consulting-grade strategic planning decks?
Yes, provided the AI tool is specifically built for executive slide mechanics rather than consumer marketing slides. Standard consumer AI slide generators produce generic text cards and decorative stock visuals that lack credibility in a boardroom. Purpose-built platforms like XLSlides allow strategy teams to input complex spreadsheets, market models, and strategic parameters, generating structured slides with Minto Pyramid action titles, MECE layouts, data-dense financial exhibits, and editable PowerPoint (PPTX) exports that meet the rigorous visual standards of top management consulting firms.
Generate Your Executive Strategic Planning Deck with XLSlides
Stop spending hundreds of manual hours formatting PowerPoint tables and drafting bullet points. XLSlides empowers Chief Strategy Officers, management consultants, and executive leadership teams to turn complex 3-to-5 year strategic plans into pristine, boardroom-ready presentations in minutes.
Final Executive Synthesis: 5 Non-Negotiable Principles of High-Conviction Strategic Decks
- Strategy Is Choosing What NOT to Do: A presentation that attempts to pursue every growth opportunity is not a strategy; high-conviction decks explicitly articulate rejected markets, custom engineering exclusions, and disciplined capital boundaries.
- Dynamic Capital Reallocation Drives Shareholder Value: The single greatest empirical predictor of superior Total Shareholder Return (TSR) is the courage to reallocate 15–20% of corporate capital away from mature legacy units toward high-return strategic flagships.
- Lead with Answer-First Pyramid Discipline: Every slide must feature a complete declarative action title summarizing the core strategic takeaway; directors should be able to grasp the entire 3-year narrative simply by skimming the slide headers.
- Ground Choices in Quantified Economic Moats: Avoid superficial qualitative claims; define exactly How to Win through proprietary software architecture, bilateral network effects, scale cost advantages, or high switching costs.
- Establish an Accountable Strategy Realization Office: Bridge the gap between boardroom approval and quarterly execution with an empowered SRO, Single-Threaded Executive Owners, and stage-gated capital release triggers.
Methodology And Sources
- What Is Strategy? & The Five Competitive Forces That Shape Strategy(Harvard Business Review • 1996)
Foundational academic methodology establishing strategy as deliberate choice, operational trade-offs, and sustainable competitive positioning rather than mere operational effectiveness.
- Playing to Win: How Strategy Really Works(Harvard Business Review Press • 2013)
Authoritative strategic choice cascade framework by A.G. Lafley and Roger L. Martin detailing Winning Aspiration, Where to Play, How to Win, Core Capabilities, and Management Systems.
- The Strategy and Corporate Finance Practice: Managing the Strategic Planning Process(McKinsey & Company • 2024)
Empirical corporate strategy research demonstrating that companies actively reallocating capital and dynamic resources across strategic horizons outperform peers by 30% in total shareholder returns.
- Corporate Strategy and Business Portfolio Management: The Growth-Share Matrix Revisited(Boston Consulting Group (BCG) • 2023)
Modern portfolio guidance on balancing cash generative core business units with accelerated growth bets and disciplined phase-gate divestitures.
- Enterprise Strategy Governance & The Balanced Scorecard: Translating Strategy into Action(Harvard Business Review • 1996)
Seminal framework by Robert S. Kaplan and David P. Norton connecting multi-year strategic vision to balanced financial, customer, internal operational, and organizational capability KPIs.