Executive Context: Why 70% of Enterprise Digital Transformations Stall and How Decision-Ready Decks Secure Alignment
Global enterprise investment in digital transformation, cloud replatforming, and core modernization now exceeds $5 trillion annually. Yet rigorous empirical research conducted by McKinsey & Company, Boston Consulting Group (BCG), and Gartner reveals an alarming reality: over 70% of large-scale enterprise digital transformations fail to achieve their stated objectives, exceed their budgets by an average of 45%, or stall prematurely in execution.
In executive boardrooms and Investment Committees, the primary driver of this failure rate is rarely deficient software code or substandard cloud infrastructure. Instead, the failure is almost universally structural and communicative: a catastrophic disconnect between how technology leaders present their vision and how executive committees make capital allocation decisions.
When Chief Information Officers (CIOs), Chief Digital Officers (CDOs), and enterprise architects approach corporate boards, they frequently commit the classic "technical tour de force" antipattern. They arrive with 80-slide presentation decks saturated with low-level microservices topologies, Kubernetes orchestration diagrams, continuous integration and continuous deployment (CI/CD) pipeline metrics, and vendor-centric feature matrixes. To an executive board composed of business unit heads, private equity operating partners, and independent directors, these technical artifacts communicate effort and complexity rather than economic value. The board hears requests for $50M to $200M in multi-year capital expenditure without understanding which specific customer journeys will improve, which core operating costs will permanently disappear, or how technical debt retirement will expand gross margins.
Conversely, generic corporate communications that rely on marketing platitudes—promising "omnichannel synergy," "seamless AI-enabled agility," and "customer-centric ecosystem paradigms"—alienate the Chief Financial Officer (CFO) and the Board Audit Committee. Sophisticated capital allocators recognize that vague strategic aspirations mask unquantified integration risks, uncontrolled System Integrator (SI) billable hours, and inevitable dual-running cost friction.
To win board authorization, secure enterprise-wide co-sponsorship, and maintain steering committee momentum over a 36-month journey, technology leaders must master an institutional slide craft. A decision-ready digital transformation strategy deck must bridge the gap between technology architecture and commercial P&L reality. It must clearly articulate four fundamental truths:
1. **Strategic Imperative & Cost of Inaction**: Why maintaining the legacy operational status quo is mathematically riskier and more expensive than undertaking the modernization program, proven through technical debt carrying costs, outage frequency, and competitive market share attrition. 2. **Modular 4-Layer Architecture**: A clear, de-jargonized abstraction that connects frontline customer touchpoints through an event-driven API integration layer down to modernized core ERP systems and resilient cloud infrastructure. 3. **Rigorous Value Realization Financial Bridge**: An auditable waterfall model bridging upfront CapEx and OpEx investments through legacy decommissioning, operational efficiency, and digital revenue growth down to net bankable EBITDA and IRR. 4. **Phased Multi-Horizon Delivery Roadmap**: A disciplined stage-gate execution schedule that completely rejects risky "Big Bang" cutovers in favor of incremental value releases (Horizon 1 Quick Hits -> Horizon 2 Core Modernization -> Horizon 3 Autonomous Scale), backed by an empowered Transformation Management Office (TMO).
This guide provides the complete, practitioner-grade blueprint for engineering an executive-ready digital transformation strategy presentation. Designed for CIOs, CDOs, consulting partners (McKinsey Digital, BCG Platinion, Bain Vector, Strategy&, Accenture), and enterprise transformation directors, it provides battle-tested frameworks, slide layouts, financial matrices, governance tollgates, and prompt recipes to transform complex technical modernizations into irresistible board decisions.
Executive Summary: Core Principles for Structuring Board-Ready Digital Transformation Decks
- Anchor Technology to P&L Outcomes, Not Technical Architecture: Executive boards do not fund technology for its own sake; they fund measurable operating leverage, customer retention, risk mitigation, and margin expansion. Frame every technical workstream—from API gateways to cloud migration—around specific balance sheet and P&L outcomes, dollarizing legacy maintenance savings, cycle-time reductions, and digital revenue contributions.
- Disaggregate Digital Maturity Across 5 Operational Dimensions: Avoid subjective maturity labels like 'digital beginner' or 'cloud advanced.' Deploy an objective, 5-point maturity heatmap evaluating Customer Experience, Core Operations, Data & AI Architecture, Infrastructure Velocity, and Organizational Agility, anchoring each rating in empirical metrics and competitor benchmarks.
- Apply the 5-R Modernization Filter to Every Legacy Asset: Never pitch a uniform 'rip-and-replace' strategy across the enterprise application portfolio. Categorize every legacy system into Rehost, Refactor, Rearchitect, Rebuild, or Replace (SaaS), proving to the board that capital is allocated with surgical precision based on business criticality and technical debt velocity.
- Build an Auditable Value Realization Waterfall Bridge: Reconcile total transformation investment ($180M across 3 years in our baseline model) against run-rate legacy cost takeout (-$42M), operational process automation (-$68M), and incremental digital gross margin (+$115M), explicitly budgeting for dual-running operational friction and change management buffers.
- Sequence Execution Across 3 Distinct Multi-Horizon Waves: Eliminate the systemic risk of multi-year 'Big Bang' cutovers. Phase delivery into Horizon 1 (Months 1-6: Foundation & Quick Wins), Horizon 2 (Months 6-18: Core Platform Modernization), and Horizon 3 (Months 18-36: Autonomous Operations), enforcing strict stage-gate capital releases tied to verified milestone achievements.
- Institutionalize SteerCo Decision Rights via a Dedicated TMO: A digital strategy deck must detail the human governance mechanism. Present a clean SteerCo and Transformation Management Office (TMO) hierarchy with explicit decision rights (RACI), active workstream pod owners, and frontline change champions to ensure accountability across business and IT.
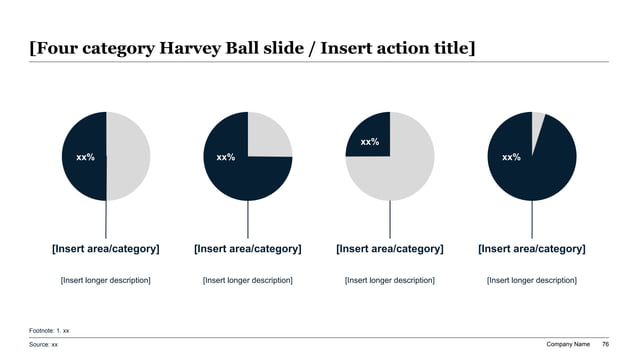
Exhibit 1: Digital Capability & Cloud Maturity Assessment Heatmap across Core Enterprise Operating Dimensions
The 4-Layer Enterprise Digital Architecture Stack: Connecting Board Vision to Systems Reality
The single most challenging slide in any technology leadership presentation is the enterprise architecture overview. In traditional IT presentations, this slide is an impenetrable "wiring diagram" filled with hundreds of overlapping rectangles, database cylinders, network interfaces, and vendor brand logos. When directors see this visual spaghetti, they experience cognitive overload and immediate skepticism: "If the architecture is this convoluted on paper, how will the engineering team possibly execute it without catastrophic downtime?"
To secure executive confidence, top strategy consultants and elite CIOs deploy an abstracted 4-Layer Enterprise Digital Architecture Stack. This model groups the entire technology ecosystem into four logical, decoupled tiers, demonstrating how modern digital interfaces communicate with modernized core transactional ledgers without creating brittle point-to-point dependencies:
### Layer 1: Omnichannel Digital Experience & Presentation Layer (The Customer & Employee Edge) The top layer represents every digital surface where customers, commercial partners, and frontline employees interact with the enterprise. This includes responsive web applications, mobile apps, customer self-service portals, field service technician interfaces, and B2B partner EDI/API portals.
In a modernized digital architecture, Layer 1 is completely "headless"—separated from backend transactional engines. Frontline product teams can iterate user experiences, conduct A/B tests, and deploy weekly interface updates without touching or risking core enterprise transactional databases. When presenting this layer to the board, focus on adoption velocity, digital Net Promoter Scores (NPS), conversion rates, and self-service deflection ratios.
### Layer 2: API Gateway & Event-Driven Integration Fabric (The Decoupling Nervous System) Layer 2 is the most strategically vital architectural investment in any transformation program. Historically, enterprise IT environments grew through point-to-point spaghetti integrations: custom ETL scripts and direct SQL queries linking billing systems to CRM, ERP to warehousing, and inventory to e-commerce. As a result, changing a single field in the billing engine broke seven downstream operational applications.
A modern transformation replaces this brittle maze with an API Gateway and Event-Driven Integration Fabric (powered by tools like Apache Kafka, MuleSoft, AWS EventBridge, or Azure API Management). Instead of direct point-to-point connections, applications publish business events (e.g., "Customer Placed Order," "Payment Cleared," "Inventory Dispatched") to a high-throughput event broker. Downstream systems subscribe to these events asynchronously.
When presenting Layer 2 to the board, emphasize architectural insulation: "By implementing an event-driven integration fabric, we insulate our business operations. We can replace our underlying 20-year-old ERP system in Layer 3 without disrupting a single customer checkout flow in Layer 1."
### Layer 3: Modernized Core Platforms & Composable ERP (The Transactional Engine of Record) Layer 3 houses the core systems of record where the enterprise records revenue, manages supply chain operations, processes payroll, and maintains general ledger balances (e.g., SAP S/4HANA, Workday, Salesforce Core, Microsoft Dynamics).
In traditional legacy IT, these core systems were heavily customized over decades, accumulating millions of lines of bespoke ABAP or COBOL code that made vendor upgrades virtually impossible. The modern transformation imperative is "Clean Core" composability: standardizing on out-of-the-box SaaS capabilities for undifferentiated operational processes (accounts payable, general ledger accounting, fixed assets) and using Layer 2 APIs to extend differentiated proprietary capabilities outside the core.
When presenting Layer 3, highlight maintenance cost deflation and upgrade velocity: moving from multi-million-dollar triennial upgrade fire drills to continuous, automated vendor SaaS release cycles.
### Layer 4: Hybrid Multi-Cloud Infrastructure & Unified Data Lakehouse (The Scalable Foundation) The foundation layer encompasses the physical and virtual computing, storage, network infrastructure, and enterprise data repositories supporting the organization (e.g., AWS, Microsoft Azure, Google Cloud Platform, Snowflake, Databricks).
Historically, enterprise data was trapped in fragmented departmental relational databases, requiring hours of manual CSV extraction and spreadsheet reconciliation. The modernized Layer 4 unifies operational and analytical data into a governed Enterprise Data Lakehouse with standardized semantic layers, automated data pipelines, and embedded governance controls (SOC 2, GDPR, HIPAA, ISO 27001). Furthermore, infrastructure provisioning is codified as code (IaC via Terraform), enabling automated disaster recovery and zero-downtime blue/green deployment models.
When communicating Layer 4 to the CFO and Board Risk Committee, anchor the narrative in elastic cost scaling (FinOps) and cybersecurity resilience: scaling compute capacity during peak seasonal demand and automatically throttling idle capacity during off-peak hours, eliminating the fixed depreciation burden of underutilized on-premise data centers.
Enterprise Digital Maturity Dimension Scoring & Benchmark Assessment
Comprehensive diagnostic framework evaluating seven enterprise technology and operational dimensions across baseline performance, upper-quartile industry benchmarks, and strategic investment levers.
| Operating Dimension | Core Capabilities Assessed | Baseline Score (1-5) | Peer Benchmark | Target Score (Horizon 2) | Primary Bottleneck / Technical Debt | Strategic Investment Lever |
|---|---|---|---|---|---|---|
| 1. Customer Experience & Front-Office | Omnichannel checkout, mobile portal, self-service deflection, real-time inventory visibility | 2.1 / 5.0 | 3.4 / 5.0 | 4.2 / 5.0 | Tightly coupled legacy monolithic frontend; 6-week release cycles for minor UI changes | Headless frontend architecture with automated micro-frontend CI/CD pipelines |
| 2. Core ERP & Transactional Engines | Order-to-cash, inventory ledger, general ledger accounting, fixed asset depreciation | 1.8 / 5.0 | 3.2 / 5.0 | 4.0 / 5.0 | 18-year-old on-premise ERP with 450+ custom modifications; vendor support ending 2027 | Clean Core cloud ERP migration (SAP S/4HANA Cloud / Workday) with standardized workflows |
| 3. Integration Fabric & APIs | Real-time event streaming, RESTful API catalog, partner B2B connectors, legacy adapter layer | 1.4 / 5.0 | 3.6 / 5.0 | 4.5 / 5.0 | 820+ brittle point-to-point batch ETL scripts; single point of failure during peak order volume | Enterprise event-driven message bus (Kafka/MuleSoft) with zero direct database coupling |
| 4. Data Architecture & AI Foundation | Unified data lakehouse, single source of truth, automated data governance, ML model registry | 2.3 / 5.0 | 3.5 / 5.0 | 4.4 / 5.0 | Data siloed across 14 relational data marts; manual spreadsheet reconciliation for financial closes | Centralized cloud data lakehouse (Snowflake/Databricks) with automated dbt data modeling |
| 5. Cloud Infrastructure & FinOps | Compute elasticity, automated IaC provisioning, multi-region disaster recovery, FinOps unit costs | 2.6 / 5.0 | 3.8 / 5.0 | 4.6 / 5.0 | Two aging on-premise data centers operating at 38% utilization with fixed cooling/lease costs | Full cloud migration to hybrid AWS/Azure footprint with automated auto-scaling and spot instances |
| 6. Cybersecurity & Resilience | Zero-Trust network access (ZTNA), automated patch management, vulnerability scanning, SOC monitoring | 2.8 / 5.0 | 3.9 / 5.0 | 4.8 / 5.0 | Legacy perimeter security model with perimeter firewalls; manual OS patching on virtual machines | Zero-Trust identity architecture with micro-segmentation and continuous automated posture assessment |
| 7. Operating Model & Delivery Pods | Cross-functional agile squads, product management discipline, sprint velocity, deployment frequency | 2.0 / 5.0 | 3.3 / 5.0 | 4.1 / 5.0 | Siloed waterfall project management with handoffs between business, dev, QA, and operations | Dedicated value-stream agile product pods with co-located business product managers |
Legacy Application Modernization: The 5-R Architectural Decision Framework for Enterprise Platforms
One of the quickest ways for a CIO to lose board support is to recommend replacing every legacy software application with new custom cloud software. When executive directors hear "we need to replace everything," they immediately visualize infinite budget overruns, operational chaos, and multi-year delays.
Sophisticated technology leaders demonstrate capital discipline by categorizing the entire application portfolio using the Gartner / AWS 5-R Modernization Framework. In a decision-ready presentation, this framework shows the board that every enterprise application has been forensically evaluated across two rigorous dimensions: Business Value Differentiation (does this software create a competitive moat?) and Technical Debt / Modernization Risk (how fragile, expensive, and unsupported is the underlying technology?).
### The 5-R Decision Taxonomy for Enterprise Applications
1. **Rehost ("Lift and Shift")**: - *Definition*: Migrating an application directly from on-premise physical servers or virtual machines into cloud Infrastructure-as-a-Service (IaaS) instances without altering the underlying code architecture. - *Strategic Fit*: Stable, non-differentiated utility applications where the primary business driver is terminating an expensive physical data center lease or hardware renewal deadline. - *Board Positioning*: "Rehosting delivers immediate data center closure and cash savings in Year 1, allowing us to defer deeper modernization until core platform phases are complete."
2. **Refactor ("Repackage / Containerize")**: - *Definition*: Making targeted modifications to the application configuration, containerizing the workload (e.g., Docker / Kubernetes), and connecting to managed cloud databases (e.g., Amazon Aurora or Azure SQL) while preserving the core codebase. - *Strategic Fit*: High-performing legacy applications that suffer from infrastructure scaling bottlenecks or manual deployment processes but possess clean underlying business logic. - *Board Positioning*: "Refactoring unlocks automated elasticity and 99.99% availability with minimal code refactoring investment, avoiding the expense of a full ground-up rewrite."
3. **Rearchitect ("Modular Decomposition")**: - *Definition*: Decomposing a large, monolithic legacy system into a collection of independently deployable microservices linked via REST/gRPC APIs and event streams. - *Strategic Fit*: Mission-critical enterprise engines (e.g., custom underwriting algorithms, proprietary pricing engines, high-frequency logistics dispatch) where the business demands rapid feature innovation and independent workstream velocity. - *Board Positioning*: "Rearchitecting our proprietary dispatch engine allows our product teams to release new customer features daily rather than quarterly, preserving our core commercial differentiation."
4. **Rebuild ("Cloud-Native Greenfield")**: - *Definition*: Scrapping the legacy code entirely and engineering a brand-new cloud-native application from the ground up using modern frameworks, serverless compute, and decoupled data stores. - *Strategic Fit*: Highly differentiated customer-facing applications where the legacy architecture is so decayed, brittle, and undocumented that refactoring would cost more than greenfield development. - *Board Positioning*: "Rebuilding our digital customer acquisition platform eliminates 15 years of technical baggage, cutting transaction latency by 75% and lowering hosting costs by 60%."
5. **Replace ("Standardize on Commercial SaaS")**: - *Definition*: Decommissioning custom legacy in-house applications and migrating business processes to proven, industry-standard commercial Software-as-a-Service platforms. - *Strategic Fit*: Undifferentiated back-office business functions such as human capital management (Workday), customer relationship management (Salesforce), accounts payable automation (Tipalti/Coupa), or enterprise travel and expense (Concur). - *Board Positioning*: "We are eliminating 34 bespoke internal tools that required 18 full-time maintenance engineers, standardizing on proven enterprise SaaS to permanently slash support overhead."
The 10-Point Pre-Board Technology Investment Governance Gate
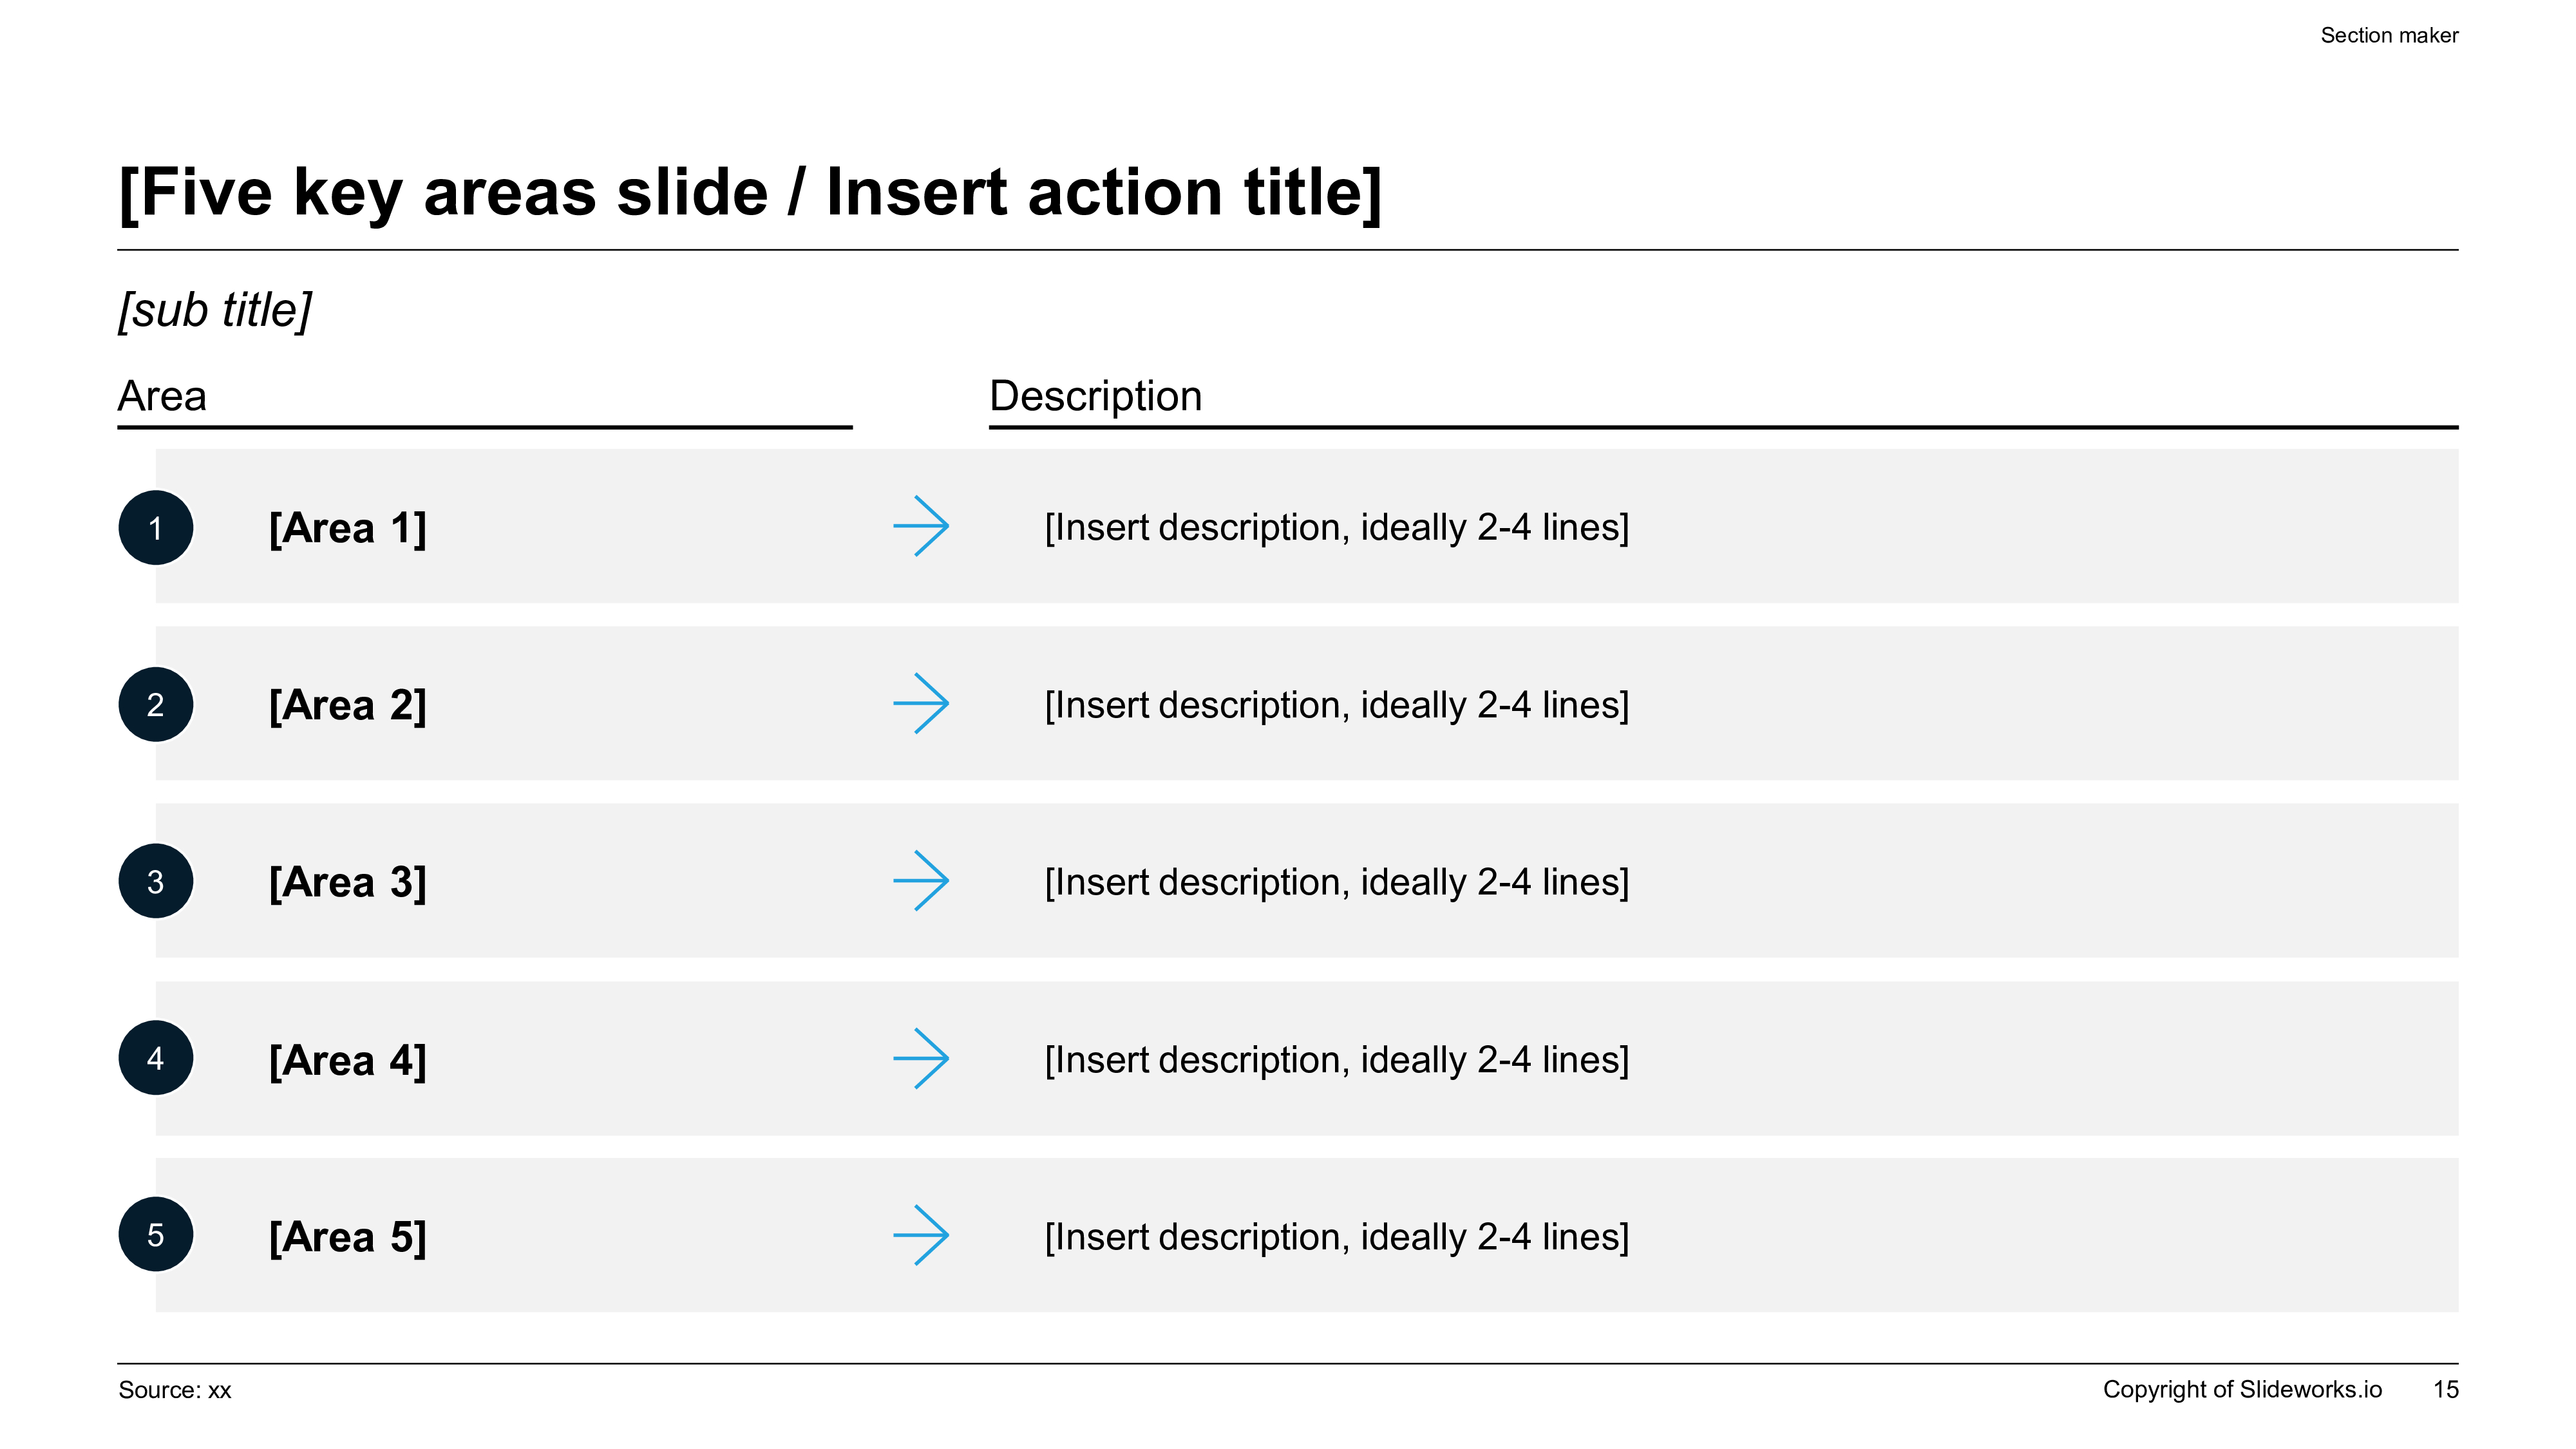
Exhibit 2: Target Enterprise Digital Architecture & API Integration Blueprint
Digital Transformation Economics: Structuring the IT Investment, TCO, and Value Realization Model
The primary reason CFOs veto digital transformation programs is not a lack of vision; it is a lack of financial rigor. Technology leaders often submit business cases built on vague claims of "employee productivity" and "business agility" without tying those claims to auditable General Ledger accounts.
To pass the CFO's scrutiny, a digital transformation strategy presentation must disaggregate program economics into two complementary frameworks: Total Cost of Ownership (TCO) Modernization Sizing and the Net Value Realization Waterfall Bridge.
### The Shift from Capitalized IT Assets to Variable Operating Costs Historically, enterprise technology was financed through massive multi-year capital expenditure (CapEx) cycles: purchasing physical servers, enterprise storage arrays, and perpetual software licenses that depreciated over 5 to 7 years.
Modern digital architecture transforms IT into a variable operating expense (OpEx): cloud compute billed by the second, SaaS applications billed per active seat, and API calls billed per million requests. In a board deck, the CIO must transparently model this structural financial transition: - **Year 1 & 2 Financial Bubble**: Total IT spending temporarily increases during the initial phases due to implementation partner fees, legacy software maintenance renewal overlaps, and cloud environment spin-up. - **Year 3 Structural Deflation**: As legacy data centers are decommissioned, custom software licenses terminated, and manual reconciliation workflows automated, recurring baseline operating costs permanently decline below historical levels. - **Run-Rate Margin Expansion**: Once stabilized, the modernized architecture delivers a permanent 25% to 35% reduction in cost per transaction, accompanied by continuous automated feature releases.
### Deconstructing the 4 Pillars of Value Creation
1. **Legacy IT Maintenance Cost Takeout ($42.0M Run-Rate Benefit)**: Terminating 2 physical data center leases and hardware maintenance contracts, retiring 14 proprietary legacy software maintenance agreements, and eliminating costly external contractors retained specifically to maintain legacy monolithic code. 2. **Core Operational Process Automation ($68.0M Run-Rate Benefit)**: Automating 85% of standard customer order entries via straight-through API processing, reducing month-end close cycle time from 14 business days down to 3 days, and lowering customer support ticket volumes by 45% through intuitive self-service portals. 3. **Digital Revenue Acceleration & Conversion Expansion ($115.0M Gross Margin Contribution)**: Increasing checkout conversion rates by 28% through sub-second transaction latency, reducing B2B partner onboarding time from 90 days down to 4 days, and launching high-margin digital recurring subscription services. 4. **Working Capital & Inventory Carrying Cost Optimization ($40.0M Liberated Cash)**: Real-time inventory visibility across 18 regional distribution hubs, allowing safety stock compression without impacting service level agreements, and reducing Days Sales Outstanding (DSO) by 6.4 days through automated customer electronic invoicing.
Enterprise Core Modernization & Cloud Migration Unit Economics Benchmark
Financial modeling comparing current legacy run-rate costs against modernized cloud operating costs, detailing capital expenditure requirements, net annual run-rate savings, and calculated payback periods across core IT domains.
| Infrastructure / Application Category | Legacy Annual Run-Rate Cost | Modernized Annual Run-Rate Cost | Net Annual Savings | Modernization CapEx / SI Investment | Payback Period | Primary Strategic / Operational Value |
|---|---|---|---|---|---|---|
| Primary Data Centers (2 On-Prem Facilities) | $14.8M / yr | $6.2M / yr (Cloud IaaS/PaaS) | $8.6M / yr (-58%) | $16.4M (Migration & Cloud Setup) | 1.9 Years | Elastic compute scaling; 99.99% multi-region uptime; zero hardware refresh CapEx |
| Core Enterprise ERP (Custom On-Prem Monolith) | $22.4M / yr | $13.8M / yr (Clean Core SaaS) | $8.6M / yr (-38%) | $38.5M (SI Implementation & Data Cleanse) | 4.5 Years | Standardized financial workflows; automated quarterly vendor releases; zero bespoke ABAP |
| Integration Middleware & Point-to-Point Scripts | $8.6M / yr | $2.4M / yr (Managed API Fabric) | $6.2M / yr (-72%) | $9.2M (API Gateway & Kafka Architecture) | 1.5 Years | Zero database coupling; new partner onboarding reduced from 90 days to 4 days |
| Data Warehouses & Fragmented BI Silos | $9.4M / yr | $4.1M / yr (Cloud Lakehouse) | $5.3M / yr (-56%) | $11.8M (Snowflake/dbt Modernization) | 2.2 Years | Single enterprise source of truth; sub-second query response; automated regulatory reporting |
| Customer Commerce & Mobile Portals | $11.2M / yr | $5.8M / yr (Headless Cloud App) | $5.4M / yr (-48%) | $14.2M (Modern Headless Frontend) | 2.6 Years | +28% checkout conversion; sub-second page loads; weekly feature deployment velocity |
| Legacy Cyber Perimeter & Monitoring Tools | $6.5M / yr | $3.9M / yr (Zero-Trust Platform) | $2.6M / yr (-40%) | $5.4M (ZTNA & IAM Modernization) | 2.1 Years | Continuous automated posture assessment; automated micro-segmentation; zero perimeter vulnerabilities |
| Total Enterprise Technology Transformation | $72.9M / yr | $36.2M / yr (-50.3%) | $36.7M / yr | $95.5M (Core Program CapEx/SI) | 2.6 Years | Permanent 50% structural reduction in IT run-rate; platform ready for enterprise AI scale |
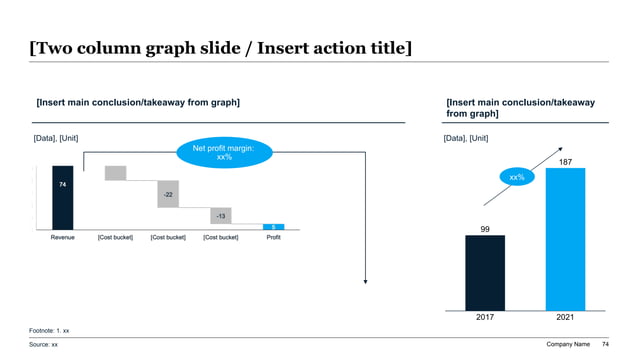
Exhibit 3: Digital Value Realization & CapEx/OpEx Investment Waterfall Bridge
Multi-Horizon Delivery Sequencing: Phasing Execution to De-Risk Cutover and Deliver Compounding Value
In the graveyard of corporate digital transformations, the most common epitaph reads: "We attempted a Big Bang weekend cutover."
A Big Bang delivery model assumes that thousands of interconnected business workflows, data schemas, user permissions, and customer interfaces can be engineered in secret for 24 months, switched on over a single holiday weekend, and run flawlessly on Monday morning. In practice, this approach produces operational catastrophe: order processing halts, general ledgers fail to balance, warehouse pick-lists fail to generate, customer service phone queues explode, and executive leadership is forced into a humiliating and expensive system rollback.
To protect the enterprise and reassure the Board of Directors, a world-class digital transformation strategy deck must champion a Multi-Horizon Delivery Sequencing Architecture. By partitioning the multi-year program into three discrete, value-accretive horizons, the executive leadership team ensures that risk is contained, software is tested under live operating conditions, and value drops begin within the first 180 days:
### Horizon 1: Foundational Modernization & Quick-Win Workflows (Months 1 to 6) - **Primary Objective**: Establish the modern digital foundation, de-risk core technical infrastructure, and deliver rapid, high-visibility business wins to build enterprise momentum and executive trust. - **Core Deliverables**: Deploy the Layer 2 API Gateway and enterprise message bus to begin abstracting legacy monoliths; establish the Cloud Foundation (AWS/Azure landing zones, automated IAM, Zero-Trust network connectivity); launch high-impact digital frontend quick wins (customer self-service mobile tracker, automated invoice ingestion pod); set up the Transformation Management Office (TMO) and align baseline metric telemetry. - **Stage-Gate Exit Criteria**: API fabric successfully handling 15% of peak order traffic with zero latency degradation; cloud landing zone achieving 100% compliance with corporate security audits; verified $4.2M in annualized quick-win operational savings.
### Horizon 2: Core Platform Modernization & Legacy Decommissioning (Months 6 to 18) - **Primary Objective**: Execute the migration of mission-critical transactional platforms (ERP, CRM, Billing) and systematically decommission the first wave of legacy technical debt. - **Core Deliverables**: Deploy Clean Core SaaS ERP (SAP S/4HANA Cloud / Workday) for core financial accounting and procurement; implement the Strangler Fig pattern to migrate high-volume customer transaction modules from legacy mainframes to cloud microservices; unify enterprise data into the centralized Cloud Lakehouse, decommissioning disconnected operational data marts; decommission Data Center 1, returning physical rack space and terminating hardware maintenance contracts. - **Stage-Gate Exit Criteria**: Core ERP processing 100% of North American financial close within 3 business days; Data Center 1 fully powered down with zero active workloads; annualized IT maintenance run-rate cost reduced by $18.5M.
### Horizon 3: Autonomous Scale, Ecosystem APIs & AI Agent Workflows (Months 18 to 36) - **Primary Objective**: Leverage the modernized, decoupled cloud data fabric to deploy autonomous business workflows, algorithmic decision engines, and external monetization APIs. - **Core Deliverables**: Deploy autonomous agentic workflows across supply chain replenishment, customer service escalation routing, and dynamic pricing; open external B2B developer APIs, monetizing proprietary enterprise data and capabilities across commercial partner ecosystems; complete the decommissioning of Data Center 2, achieving a 100% cloud-native and SaaS operating posture; transition the temporary TMO into a permanent, agile Product Operating Model across all business divisions. - **Stage-Gate Exit Criteria**: 85% of standard customer inquiries resolved autonomously via AI agents; 100% cloud footprint with automated FinOps cost optimization; cumulative net program cash flow turns positive, delivering targeted 24.5% IRR.
100-Day Legacy Migration & Cutover De-Risking Protocol
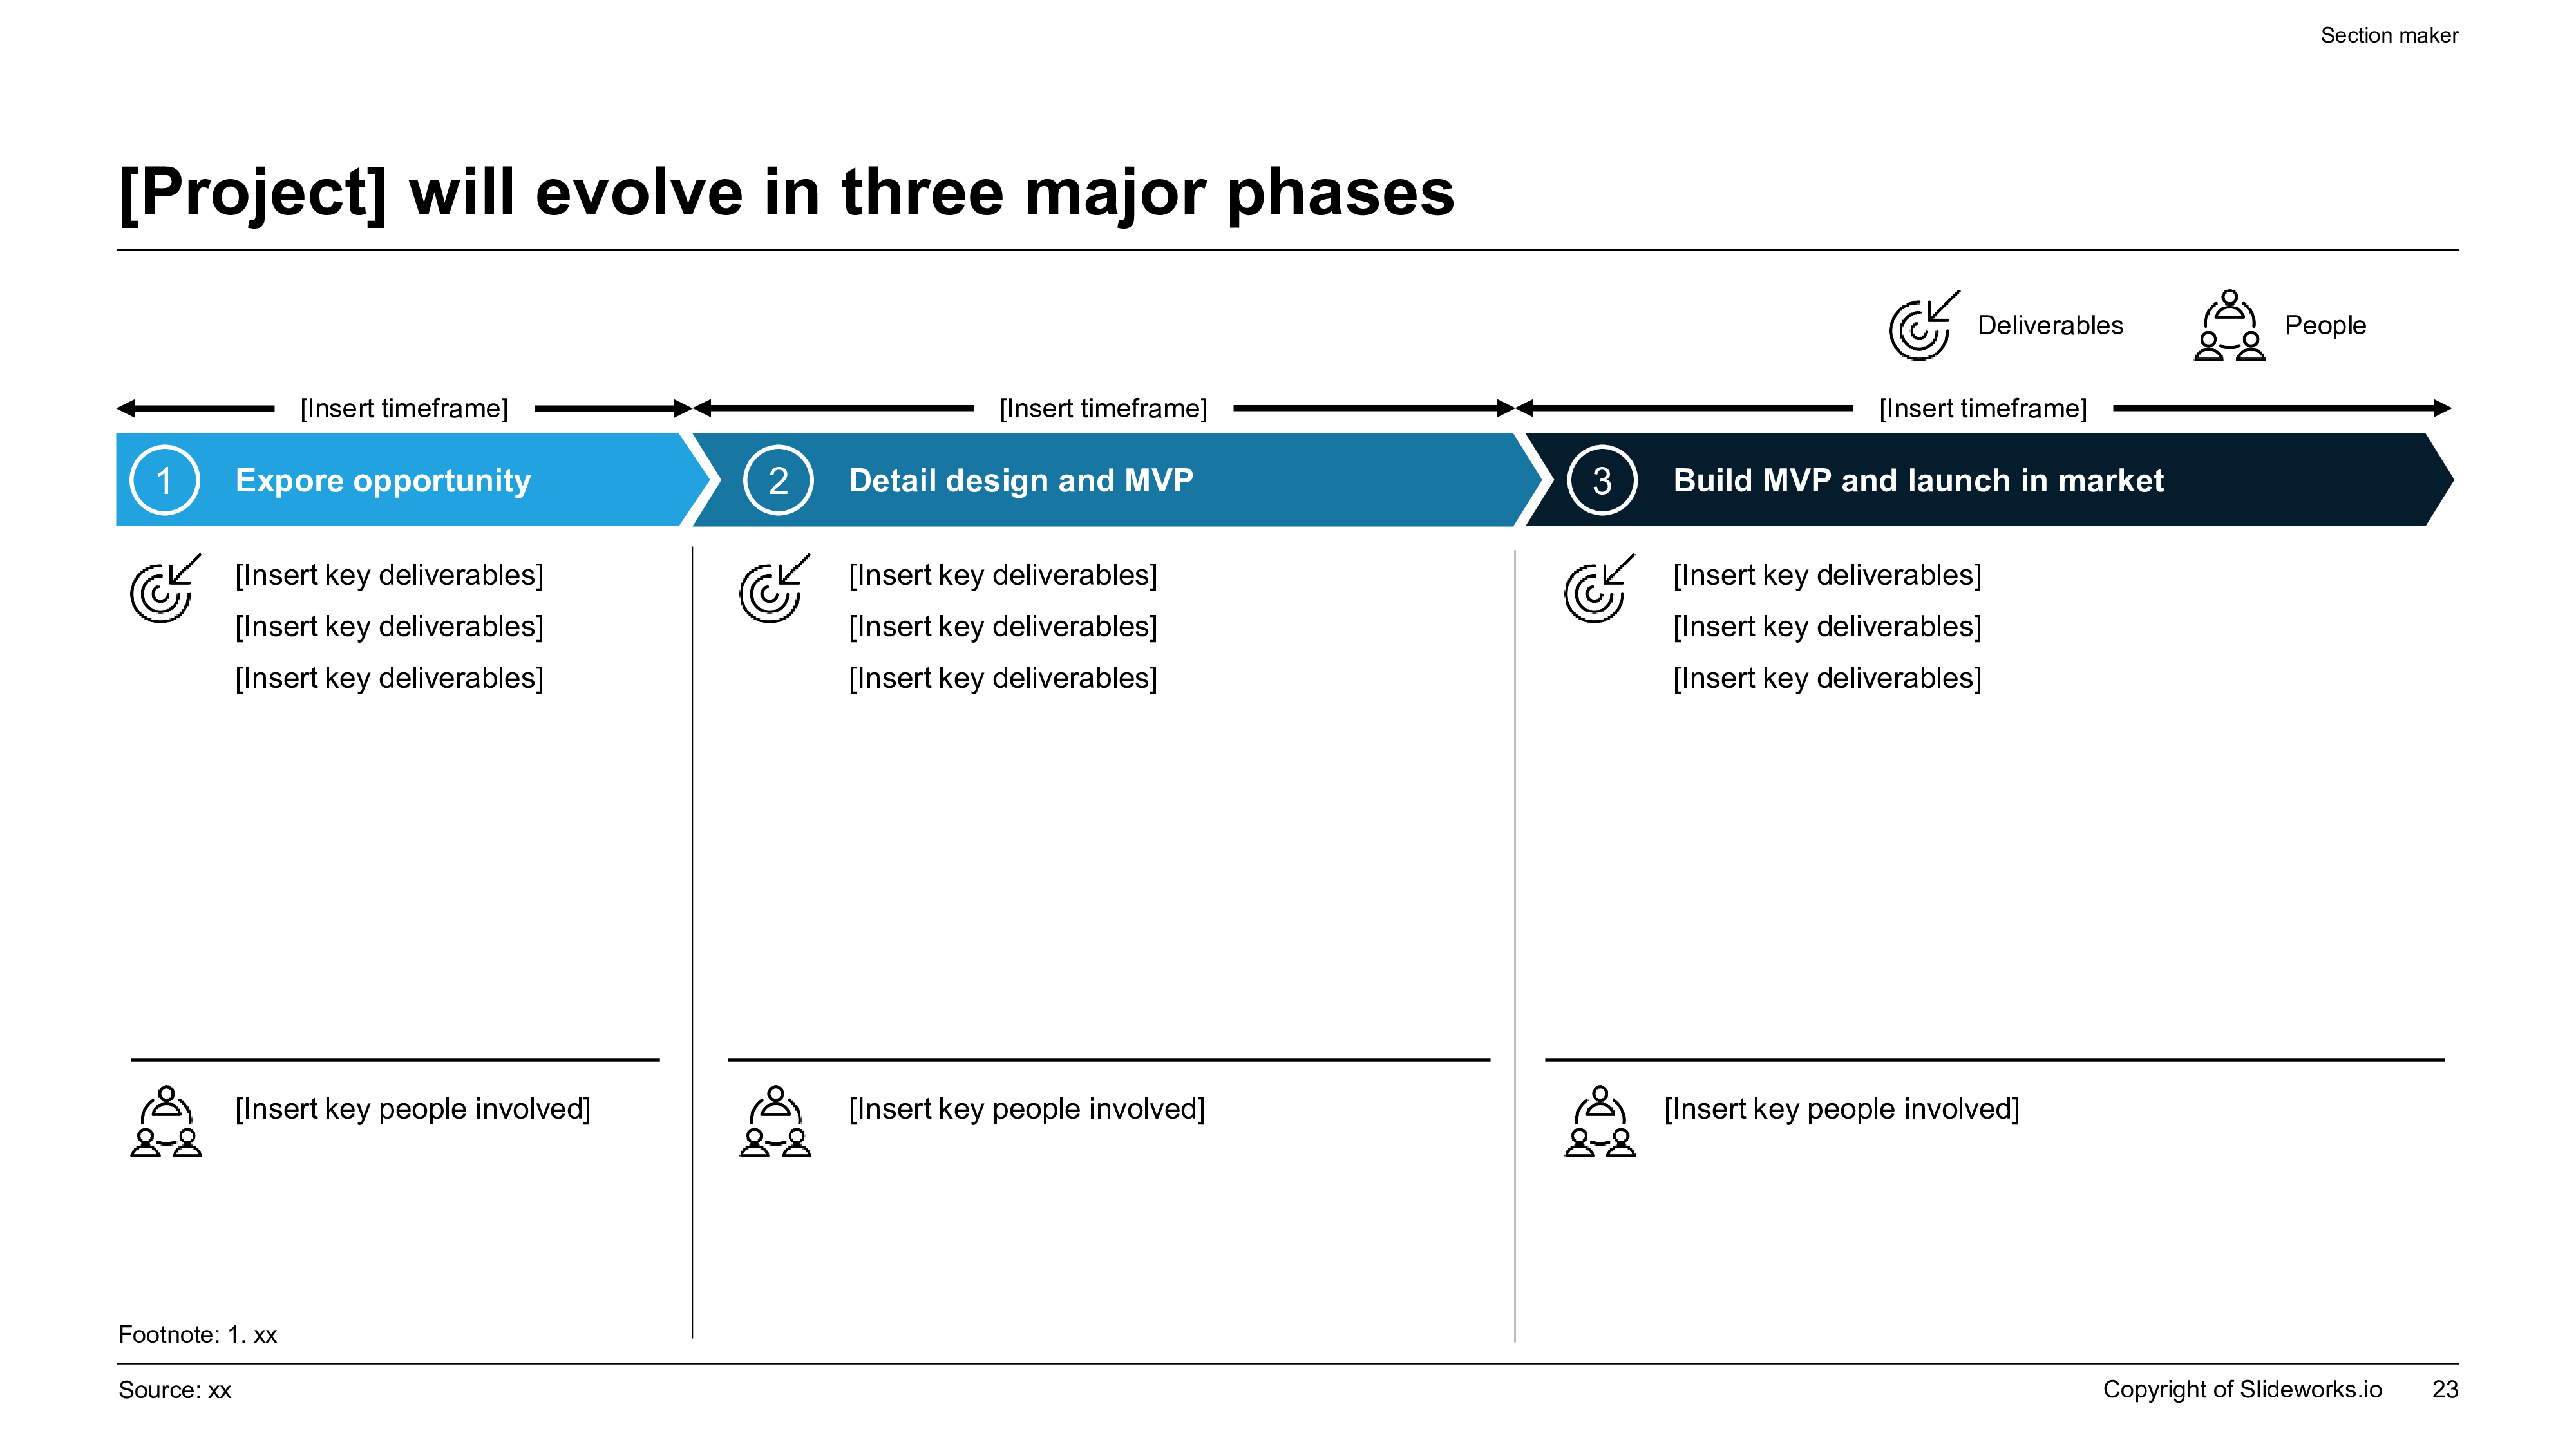
Exhibit 4: Multi-Horizon Digital Transformation Roadmap & Stage-Gate Milestones
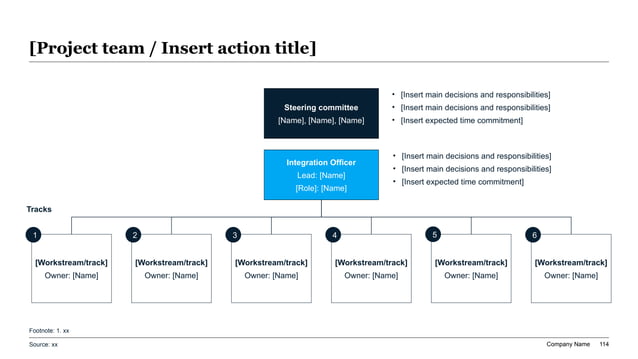
Transformation Governance Architecture: Structuring the SteerCo and Transformation Management Office (TMO)
The ultimate determinant of transformation success is organizational governance. When programs derail, it is almost never because the developers did not know how to write code; it is because the leadership team lacked a structured mechanism to resolve cross-functional disputes, enforce architectural standards, manage vendor contracts, and track dollarized value realization.
A decision-ready transformation presentation must dedicate a pivotal slide to the Transformation Governance Architecture. This slide details how executive oversight connects to daily operational execution through three integrated layers:
### 1. The Executive Steering Committee (SteerCo) The SteerCo is the ultimate governing authority of the transformation. It meets monthly (and during critical cutover gates) to evaluate program health, authorize stage-gate capital releases, resolve cross-business priority conflicts, and hold executive sponsors accountable. - **Composition**: CEO (Chair), CFO, CIO, CDO, Chief Operating Officer (COO), relevant Business Unit Presidents, and the Lead Partner from the primary System Integrator. - **Key Decision Rights**: Approving program charter amendments and multi-year budget reallocations; final Go / No-Go sign-off on major application cutovers and legacy system retirements; resolving cross-functional scope disputes (e.g., whether a custom business unit feature request violates Clean Core ERP standards).
### 2. The Transformation Management Office (TMO / PMO) The TMO is the operational engine that drives daily execution, led by a dedicated, senior Vice President reporting directly to the SteerCo. The TMO is fundamentally different from a traditional bureaucratic PMO that merely tracks Gantt charts and formats status slides. A modern TMO is an empowered Value Realization Office: - **Critical Responsibilities**: Managing program interdependencies across technical engineering, business process redesign, and organizational change; running the weekly Tollgate Review process, ensuring that delivery pods meet strict architectural and security criteria before code moves to production; operating the Value Realization Scorecard, tracking whether deployed digital features are delivering their projected P&L cost takeout and revenue targets; managing vendor and System Integrator performance, holding third-party providers strictly accountable to deliverable-based milestones.
### 3. Cross-Functional Value Stream Delivery Pods Delivery is executed not by siloed IT functional teams, but by Cross-Functional Agile Value Stream Pods. Each pod is organized around an end-to-end business journey (e.g., Order-to-Cash, Digital Customer Onboarding, Warehouse Dispatch Automation, Cloud Data Platform). - **Pod Structure**: A dedicated Business Product Manager (representing commercial interests), a Solution Architect (representing technical integrity), an Engineering Lead, UI/UX designers, developers, and QA engineers. - **Accountability**: Pods are measured not on code lines or story points, but on business outcomes: cycle-time reduction, customer adoption percentage, defect rates, and operational savings.
Transformation Workstream Accountability & Decision Rights RACI Matrix
Governance mapping defining decision rights across the transformation lifecycle for Executive Sponsors, Steering Committee members, technology leadership, the TMO, and business unit heads.
| Major Transformation Decision / Milestone | Executive Sponsor (CEO/CFO) | Steering Committee (SteerCo) | CIO & Chief Digital Officer | TMO Lead (VP Transformation) | Workstream Product Pod Lead | Business Unit Executive (VP Ops/Sales) |
|---|---|---|---|---|---|---|
| 1. Multi-Year Program Scope & Capital Allocation | Accountable (Final Sign-off) | Consulted (Review & Endorse) | Responsible (Develops Proposal) | Consulted (Provides Feasibility) | Informed (Executes Scope) | Consulted (Validates Business ROI) |
| 2. Primary System Integrator (SI) & Vendor Contracts | Accountable (Budget Approval) | Informed (Contract Status) | Responsible (Commercial Negotiations) | Consulted (Defines SOW Milestones) | Informed (Manages Vendor Staff) | Informed (Notified of Terms) |
| 3. Target Enterprise Architecture & Cloud Stack | Informed (Executive Summary) | Informed (Review Architecture) | Accountable (Final Architectural Authority) | Consulted (Ensures Interdependency Fit) | Responsible (Drafts Technical Specs) | Consulted (Validates Operational Needs) |
| 4. Sprint Backlog Prioritization & MVP Feature Scope | Informed (Monthly Status) | Informed (Escalation Point Only) | Consulted (Ensures Standards) | Consulted (Tracks Milestone Schedule) | Accountable (Daily Backlog Priority) | Responsible (Defines Business Needs) |
| 5. Production Cutover & Legacy Decommissioning Go/No-Go | Informed (Notified of Cutover) | Accountable (Formal Gate Authorization) | Responsible (Presents Technical Proof) | Responsible (Validates Readiness Gate) | Consulted (Executes Runbook) | Accountable (Signs Off Business Readiness) |
| 6. Realized P&L Cost Takeout & Value Realization Sign-Off | Accountable (General Ledger Audit) | Informed (Quarterly Review) | Consulted (Validates IT Takeout) | Responsible (Maintains Value Model) | Consulted (Confirms Feature Delivery) | Accountable (Delivers P&L Budget Takeout) |
Exhibit 5: Transformation Management Office (TMO) & Cross-Functional Workstream Governance Hierarchy
Executive Presentation Architecture: Translating Complex Technical Schematics into Board-Level Decisions
Presenting to a corporate board or Executive Leadership Team is fundamentally different from presenting to an engineering architecture review board. Directors are exceptionally time-constrained, highly analytical about risk and capital allocation, and intolerant of technical obfuscation.
To ensure your digital transformation strategy presentation succeeds, adhere to the five signature slide-craft rules developed by elite strategy consulting practices (McKinsey, BCG, Bain):
### Rule 1: The "Action Title" Standard Never use descriptive topic headers like "Architecture Overview," "Cloud Migration Update," or "Financial Plan." A descriptive header forces the director to read 50 data points on the slide to guess what conclusion you want them to draw. Instead, write an Action Title: a complete, assertive sentence across the top of the slide that states the definitive strategic takeaway and economic impact. - Poor Topic Header: "Legacy ERP Modernization Overview" - Executive Action Title: "Decommissioning the 18-Year-Old On-Premise ERP Eliminates $8.6M in Annual Maintenance Overhead while Enabling Clean Core SaaS Upgrades"
### Rule 2: The 1-Slide Executive Briefing Anchor Every board deck must begin with a single, standalone slide that summarizes the entire transformation narrative. If the board chair cuts your 45-minute presentation down to 10 minutes due to an urgent corporate matter, this single slide must be sufficient to win the vote: - Left Panel (The Imperative): The unsustainable operational and financial risk of the legacy status quo (accumulated technical debt, rising outage frequency, ending vendor support). - Center Panel (The Strategic Choice): The recommended 4-layer modernization path, 5-R application rationalization, and 3-horizon phased delivery schedule. - Right Panel (The Economic Return & Ask): The total capital required ($180M), net annual savings ($36.7M/yr), 24.5% IRR, and the specific board resolution requested today (authorization of Horizon 1 funding of $28.5M).
### Rule 3: Visual Decoupling Over Monolithic Schematics Never display a raw Visio or Lucidchart architectural diagram containing more than 20 interconnected elements on a single executive slide. Abstract the complexity into clean, structured card containers, horizontal layer tiers, or chevron process roadmaps. If deep technical proof is required, place detailed schematics in the presentation appendix and reference them only during specific Q&A challenges.
### Rule 4: Explicit Identification of Strategic Trade-Offs Boards immediately distrust presentations that promise 100% upside with zero operational risk. A credible presentation explicitly states what the organization will NOT do: - "We are deliberately choosing NOT to build custom CRM capabilities; we are standardizing on commercial off-the-shelf SaaS to avoid technical debt." - "We are deliberately deferring the migration of the secondary European warehouse system until Horizon 2 to eliminate multi-region execution strain."
### Rule 5: Reconciling Every Metric to the General Ledger Ensure that every operational metric cited on a slide (e.g., "reducing order processing time by 60%") is directly linked to an auditable financial benefit (e.g., "redeploying 45 FTEs into proactive commercial sales accounts, delivering $4.2M in annual payroll productivity"). When the CFO asks how a technical metric translates into cash flow, your slide footnote must reference the exact General Ledger line item.
Production Prompt Recipe: Generating Board-Ready Digital Transformation Presentations with XLSlides
Act as a Senior Partner at McKinsey Digital and Chief Technology Advisor to a Global Fortune 500 Board of Directors. Generate a comprehensive, decision-ready 12-slide Digital Transformation Strategy Presentation deck based on the enterprise profile and inputs below. ### INPUT ENTERPRISE PARAMETERS: - Company Name: [Enter Enterprise Name, e.g., Apex Global Manufacturing & Logistics] - Annual Revenue: [Enter Revenue, e.g., $3.8 Billion] - Current IT Budget: [Enter Annual IT Budget, e.g., $185 Million (4.8% of Revenue)] - Core Legacy Challenges: [e.g., 18-year-old on-premise ERP with 450 custom modifications; 2 aging data centers; 800+ point-to-point batch ETL integrations; vendor support ending 2027] - Proposed Modernization Program: [e.g., Cloud replatforming, Clean Core SaaS ERP migration, Event-driven API Gateway (Kafka), and Cloud Data Lakehouse] - Total Capital Investment Requested: [e.g., $145 Million across 36 Months] - Target Economic Outcomes: [e.g., $32M annual IT run-rate reduction; 35% improvement in order cycle time; 24% projected IRR] ### MANDATORY PRESENTATION ARCHITECTURE & SLIDE CRITERIA: 1. Executive Slide Writing Craft: Every slide MUST feature a crisp, single-sentence Action Title across the top that states the core strategic takeaway and dollarized business impact. Avoid generic topic titles like "Overview" or "Next Steps." 2. Structured 12-Slide Outline: - Slide 1: Executive Title Slide (Formal institutional metadata, transaction confidentiality, SteerCo review date). - Slide 2: 1-Slide Executive Briefing Anchor (Imperative, Proposed Modernization, Financial ROI, Specific Board Ask). - Slide 3: The Cost of Inaction & Legacy Operational Risk Baseline (Quantified technical debt carrying costs, outage risks, talent shortages). - Slide 4: Enterprise Digital Maturity Heatmap (5 operational dimensions benchmarked against industry peers using Harvey Balls). - Slide 5: The 4-Layer Modernized Enterprise Architecture Blueprint (Presentation Edge, API Integration Fabric, Clean Core ERP, Hybrid Cloud). - Slide 6: Legacy Application Modernization 5-R Portfolio Rationalization (Rehost, Refactor, Rearchitect, Rebuild, Replace matrix). - Slide 7: Program Financial Sizing & CapEx/OpEx Shift (5-year TCO comparison: Legacy Run-Rate vs. Modernized Cloud Architecture). - Slide 8: Value Realization Waterfall Bridge (Reconciling $145M investment through IT savings, automation, and digital growth to net P&L). - Slide 9: Multi-Horizon Delivery Roadmap (Horizon 1 Foundation, Horizon 2 Core Modernization, Horizon 3 Autonomous Scale). - Slide 10: Cutover De-Risking & Strangler Fig Migration Protocol (Safeguards, dual-write CDC, shadow traffic, automated circuit breakers). - Slide 11: Transformation Governance & TMO Operating Model (SteerCo charter, Value Realization PMO, delivery pod RACI matrix). - Slide 12: Board Resolution & Tranche 1 Capital Authorization (Immediate governance decisions and milestone release conditions). 3. Design & Visual Guidelines: Professional, institutional corporate layout. Use clear tabular comparison cards, structured process chevrons, and balanced metric dashboards. Do not include childish cartoon illustrations or decorative stock fluff. Ensure all financial figures reconcile perfectly across slides.
Critical Board Presentation Antipatterns: Why CIO Decks Lose Executive Credibility and How to Fix Them
When analyzing failed digital transformation proposals across enterprise boardrooms, the same communicative and strategic antipatterns appear with remarkable consistency. Technology leaders who recognize and remediate these flaws dramatically increase their funding approval rates:
### Antipattern 1: The "Technical Jargon Firewall" - *The Flaw*: Presenting slides dominated by technical acronyms (K8s, CI/CD, microservices, gRPC, OAuth2, multi-tenant sharding) that non-technical directors do not understand. Directors feel intellectually alienated and suspect the CIO is using jargon to conceal operational confusion or unmanaged complexity. - *The Executive Fix*: Apply the Business Capability Translation Rule. Never mention a technical component without immediately coupling it to its business outcome: "Deploying an event-driven Kafka message broker (the technology) allows our logistics network to update delivery timestamps instantly across all customer portals (the business capability), eliminating 45,000 inbound tracking calls per month (the P&L impact)."
### Antipattern 2: The "Uncapped Lump-Sum Request" - *The Flaw*: Asking the board to authorize a single, monolithic capital allocation ($100M+) with zero formal stage-gate release mechanisms. Directors know from historical experience that once capital is authorized unconditionally, technical scope expands and accountability evaporates. - *The Executive Fix*: Structure the capital request into Discrete Milestone Tranches. Request immediate funding only for Horizon 1 ($22M for foundation, architecture setup, and quick-win MVP). Explicitly bind Horizon 2 funding ($65M) to verified audit gates: API fabric handling live production traffic and validated data migration accuracy.
### Antipattern 3: The "Soft Benefits Only" Trap - *The Flaw*: Building the financial justification solely on theoretical employee time saved (e.g., "saving 15 minutes per employee per day equals $25M in productivity"). CFOs routinely reject this math because time savings rarely translate into eliminated headcount or reduced payroll expense. - *The Executive Fix*: Base the financial case on Bankable Hard-Dollar Reductions. Calculate physical data center lease terminations, eliminated software maintenance contracts, reduced hardware maintenance agreements, avoided cloud over-provisioning penalties, and direct third-party contractor reductions. Treat soft productivity as an operational bonus, not the baseline justification.
### Antipattern 4: The "Vendor-Led Pitch" - *The Flaw*: Arriving with presentation materials clearly prepared by an enterprise software vendor (e.g., SAP, Salesforce, AWS) or a Big 4 System Integrator pushing proprietary frameworks. The board immediately perceives that the CIO is being steered by vendor sales quotas rather than shareholder interests. - *The Executive Fix*: Present an Objective, Vendor-Neutral Business Case. Openly evaluate competing vendor alternatives, document licensing trade-offs, detail vendor lock-in risks, and highlight tough contractual concessions negotiated by enterprise procurement.
### Antipattern 5: The "Ignoring the Human Factor" Fallacy - *The Flaw*: Devoting 40 slides to technical architecture and software deployment while dedicating half a slide to employee change management and operational training. New technology that frontline employees reject delivers zero enterprise ROI. - *The Executive Fix*: Elevate Organizational Change & Adoption to a top-tier strategic pillar. Present a dedicated change management roadmap, employee reskilling curricula, role transition pathways, and automated software adoption telemetry (tracking daily active users and feature adoption depth).
Frequently Asked Questions: Presenting Digital Transformation Strategy to Boards and Executive Committees
How long should an executive digital transformation strategy deck be for a board meeting?
An executive board deck should strictly adhere to the 12 to 15-slide standard for the core presentation, accompanied by a comprehensive technical appendix. In a typical 45-minute board slot, plan to present for no more than 15 to 20 minutes, reserving 25 minutes for interactive discussion, financial stress-testing, and governance review. If you cannot communicate the strategic imperative, 4-layer architecture, financial bridge, and multi-horizon roadmap in 15 slides, the transformation strategy is not yet sufficiently mature for board authorization.
How should a CIO address accumulated technical debt when presenting to a non-technical board?
Never describe technical debt as 'ugly code' or 'old systems.' Instead, dollarize technical debt as a financial liability: calculate the annual cost of carrying the debt (unsupported vendor surcharges, mainframe hosting fees, specialized contractor salaries), the operational friction (weeks required to deploy a simple feature change vs. industry peers), and the existential risk of unplanned downtime. Frame modernizing technical debt as an accretive capital reallocation that permanently eliminates operating friction.
What is the best way to handle inevitable scope creep and cost overruns in the steering committee deck?
Establish an explicit 'Clean Core & Minimum Viable Product (MVP)' governance rule in your initial deck. Any proposed modification or custom feature request that deviates from standardized SaaS workflows must submit a formal business case to the SteerCo and receive unanimous approval. By framing customizations as deliberate, costly exceptions rather than default options, the CIO shifts the burden of justification back onto operational business units.
How do we justify multi-year cloud migration costs when short-term OpEx might increase?
Acknowledge the 'cloud migration bubble' transparently. Explain that during Months 6 to 18, total operating costs temporarily rise due to dual-running expenses (paying for cloud infrastructure while still maintaining legacy data center leases). Show the precise inflection point in Month 20 where data centers are decommissioned, perpetual licenses terminate, and total operating expenses permanently drop 35% to 50% below baseline levels, delivering a superior 5-year Total Cost of Ownership.
How should a digital transformation presentation balance agile speed against strict regulatory compliance?
Present a 'Compliance-as-Code & Automated Governance' architecture. Demonstrate that modern digital pipelines integrate automated security scanning (SAST/DAST), dependency auditing, and regulatory compliance validation directly into the deployment process. Contrast this automated, continuous compliance model against traditional manual, quarterly compliance audits that are prone to human oversight.
What metrics best prove that a digital transformation is delivering real business value during early phases?
During Horizon 1 and early Horizon 2, focus on leading telemetry indicators: deployment frequency (moving from quarterly releases to daily/weekly drops), lead time for changes, automated test coverage, and API transaction volume. Concurrently, report early commercial quick-win metrics: customer self-service adoption percentages, transaction latency reductions, and specific legacy contractor hours terminated.
How can AI presentation tools like XLSlides accelerate the creation of consulting-style transformation decks?
XLSlides eliminates the tedious manual effort of formatting complex consulting slide layouts, financial waterfall charts, and governance matrices in PowerPoint. By providing structured, executive-grade templates built on consulting logic (action titles, MECE structures, clean architecture layers), XLSlides allows CIOs, strategy directors, and consultants to input raw technical and financial data and immediately generate polished, board-ready presentation decks that follow elite management consulting standards.
Transform Complex Technical Roadmaps into Decision-Ready Executive Presentations
Stop wasting weeks manually wrestling with PowerPoint shapes and disconnected architecture diagrams. XLSlides turns complex technology modernizations, cloud financial models, and governance frameworks into polished, consulting-grade presentations that boards understand and approve.