Executive Takeaways: Delivering Board-Grade Cost Reduction & Operational Efficiency
- Replace "Peanut-Butter" Across-the-Board Cuts with MECE Spend Baseline Architecture: Arbitrary across-the-board 10% budget reductions disproportionately cripple high-growth commercial functions while preserving entrenched administrative overhead. Institutional cost programs decompose the enterprise into an addressable spend cube across personnel, third-party procurement, fixed real estate, and digital infrastructure.
- The Cost-Out Sizing Waterfall Is Non-Negotiable: Board audit committees and private equity investment committees reject abstract expense targets. Every cost reduction deck must present an auditable waterfall bridge reconciling gross unconstrained ambition down to net bankable EBITDA, deducting one-off restructuring cash costs, implementation capital expenditures, and organizational friction buffers.
- Attack Structural Organizational Complexity Before Headcount Ratios: True headcount efficiency is not achieved through indiscriminate layoffs; it is realized by redesigning organizational span-of-control and management layers. Eliminating "manager-of-one" anomalies and widening average manager spans from 1:3.8 to 1:7.4 accelerates operational decision velocity while capturing 20% to 35% in sustainable SG&A payroll savings.
- Institutionalize Transformation Office (TO) Stage-Gate Governance: Over 70% of cost transformations fail to flow through to bottom-line P&L due to departmental cost leakage and phantom budget reinvestment. Enforcing a strict L1-through-L5 stage-gate tollgate process ensures savings are mathematically locked into general ledger cost centers and signed off by the CFO before celebration.
- Differentiate "Good Costs" from "Bad Costs" via Strategic Ring-Fencing: Elite consulting decks establish clear non-negotiable guardrails. While eliminating non-value-added administrative redundancies and fragmented vendor tail spend, the transformation program explicitly protects core customer retention capabilities, sales quota-bearing capacity, and intellectual property R&D engines.
The Executive Cost-Out Imperative: Why Traditional Bottom-Up Expense Rationalization Fails
When corporate profit margins compress under macroeconomic contraction, inflationary cost pressures, post-merger integration overlap, or sponsor-mandated EBITDA covenants, corporate leadership inevitably launches an enterprise cost reduction initiative. Yet, empirical management consulting research consistently demonstrates that nearly two-thirds of traditional corporate cost programs fail to achieve their target run-rate savings—and of those that do, more than 60% see the eliminated expenses creep back onto the corporate balance sheet within 18 to 24 months.
The root cause of this systemic failure lies not in financial arithmetic, but in presentation and governance architecture. In traditional corporate environments, cost reduction begins as a defensive, bottom-up exercise. Finance distributes generic spreadsheet templates asking department heads to volunteer 5% to 10% in departmental budget cuts. The predictable institutional response is political horse-trading, deferral of vital strategic capital investments, cosmetic travel freezes, and across-the-board "peanut-butter" reductions that penalize high-performing revenue engines while shielding bloated administrative monopolies.
When these disjointed spreadsheet volunteer cuts are aggregated into a slide deck for the CEO and Board of Directors, the presentation invariably fails. Directors are confronted with fragmented bullet lists, anecdotal justifications, and zero structural visibility into whether the proposed cuts will impair customer delivery or violate regulatory compliance. Directors leave the meeting skeptical, middle management remains cynical, and frontline employees suffer organizational whiplash.
An institutional, board-grade Enterprise Cost Reduction & Operational Efficiency presentation flips this paradigm entirely. Instead of negotiating bottom-up volunteered reductions, executive leadership presents a top-down, hypothesis-driven, mutually exclusive and collectively exhaustive (MECE) diagnostic. The presentation establishes an unassailable spend cube baseline, quantifies structural efficiency levers through benchmarked operational ratios, maps gross opportunities through an auditable EBITDA bridge waterfall, and establishes an empowered Transformation Office (TO) to govern execution through disciplined stage gates.
Whether you are a CFO preparing for a contentious Board Audit Committee review, a Private Equity Operating Partner driving a 100-day turnaround plan, or a management consultant structuring a multi-million-dollar transformation program for an executive steering committee, this guide provides the institutional blueprint for designing, visualizing, and defending an enterprise cost reduction strategy that commands immediate boardroom credibility.
Addressable Spend Baseline & Cost Pool Taxonomy Matrix
A comprehensive institutional taxonomy categorizing enterprise expenditures into addressable vs. non-addressable cost pools, detailing baseline dollar envelopes, benchmark cost-out yields, implementation friction, and strategic governance considerations.
| Spend Pool Category | Illustrative Baseline ($M) | % of Total Spend | Addressability Classification | Target Cost-Out Yield (%) | Target Run-Rate Savings ($M) | Primary Optimization Levers | Implementation Friction & Lead Time |
|---|---|---|---|---|---|---|---|
| Third-Party Procurement & Vendor Tail | $82.5M | 34.4% | Highly Addressable (85%) | 12.0% - 18.0% | $11.5M | SKU rationalization, demand management, competitive RFP retendering, vendor consolidation, payment term harmonization | Low to Medium friction; 60-120 days lead time |
| Corporate SG&A & Management Hierarchy | $68.0M | 28.3% | Highly Addressable (90%) | 15.0% - 22.0% | $12.8M | Span-of-control widening (1:3.8 to 1:7.4), eliminating manager-of-one roles, delayering from 8 to 5 organizational tiers, shared services consolidation | High organizational friction; 90-180 days lead time |
| Information Technology & Enterprise SaaS | $34.2M | 14.3% | Moderately Addressable (75%) | 14.0% - 20.0% | $5.6M | Application portfolio rationalization, duplicate software license reclamation, cloud compute instance rightsizing (FinOps), Tier-1 contract renegotiation | Medium technical friction; 90-150 days lead time |
| Corporate Real Estate & Facilities Footprint | $22.8M | 9.5% | Moderately Addressable (60%) | 18.0% - 25.0% | $4.1M | Subleasing excess square footage, hybrid workplace consolidation, lease termination renegotiation, facility maintenance vendor bundling | Medium to High legal friction; 120-240 days lead time |
| Supply Chain & Inbound/Outbound Logistics | $18.5M | 7.7% | Addressable (70%) | 10.0% - 15.0% | $2.4M | Linehaul freight route optimization, dynamic parcel carrier rate tiering, 3PL contract consolidation, safety stock inventory rationalization | Medium operational friction; 90-180 days lead time |
| Non-Addressable Contractual & Regulatory Commitments | $14.0M | 5.8% | Non-Addressable (<5%) | 0.0% - 2.0% | $0.2M | Statutory audit fees, sovereign regulatory filings, non-cancellable debt servicing escrow, core intellectual property patent maintenance | Severe legal/regulatory barrier; Excluded from baseline |
| Total Enterprise Spend Baseline | $240.0M | 100.0% | Overall Addressable ($212.0M / 88.3%) | 15.8% (Weighted Average) | $36.6M | Integrated enterprise cost transformation program across procurement, organization, technology, and footprint | Weighted average payback period: 4.8 months |
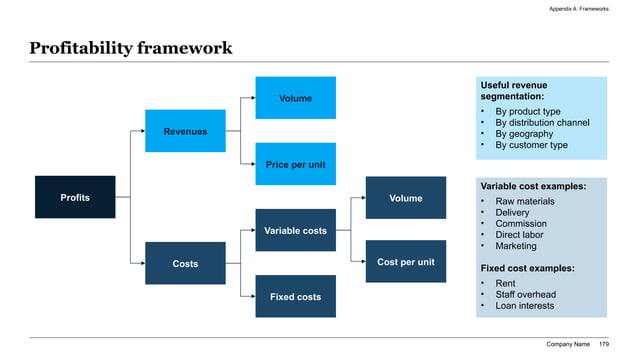
Exhibit 1: MECE Spend Cube & Profitability Cost Baseline Decomposition
Establishing the Spend Cube: Diagnostic Discipline & Sourcing Leakage Identification
Before an executive can credibly propose a single dollar of cost reduction to the Board of Directors, the presentation must establish an unassailable financial baseline. In top-tier management consulting engagements, this foundation is known as the "Spend Cube." A Spend Cube is a multi-dimensional database and visual artifact that categorizes every single general ledger (GL) expenditure across three simultaneous axes: Who spent it (cost center and organizational business unit), What was bought (procurement category and commodity classification), and With whom it was spent (vendor and supplier hierarchy).
In most corporate enterprises, spend visibility is notoriously fragmented. Disparate ERP instances, regional accounting variances, and unmonitored p-card expenditures create massive visibility voids. Common diagnostic blind spots include:
1. Maverick Vendor Tail Spend: In a typical $250M enterprise, the top 20 vendors represent 65% of spend, while the remaining 35% is scattered across 1,800+ disparate suppliers. These tail vendors frequently charge 20% to 45% premiums over negotiated enterprise contract rates due to localized, uncontracted purchasing.
2. Duplicate Vendor Entities: A global company often contracts with the same software or logistics vendor across four different operating subsidiaries under distinct account numbers, failing to aggregate volume to trigger contractual tier-discount thresholds.
3. Embedded Service Markups: Vendor invoices routinely mask internal operational costs, such as "time-and-materials" consulting contracts where 40% of billable hours are allocated to junior coordinators performing administrative tasks that could be automated or repatriated in-house.
4. Phantom Software Subscriptions: Enterprise SaaS sprawl frequently results in 15% to 30% of paid software licenses sitting completely dormant, with no active logins recorded over 90 consecutive days.
In Exhibit 1, the presentation displays the MECE Spend Cube decomposition. By disaggregating fixed overhead from variable operational costs, the slide immediately signals to directors that the executive team understands the exact anatomical composition of enterprise expenses. It provides the mathematical baseline against which all subsequent savings calculations are underwritten.
The 10-Point Addressable Spend & P&L Leakage Audit Checklist
Enterprise Cost-Out Levers Benchmark: Yield, Time-to-Impact, and Capital Friction
A benchmark comparison of the four primary operational cost transformation levers, detailing target percentage savings yield, time required to achieve run-rate cash impact, upfront restructuring capital costs, and organizational risk profile.
| Cost Transformation Lever | Primary Scope of Intervention | Benchmark Savings Yield (%) | Time to Cash Realization | One-Off Implementation Cost Ratio | Organizational Friction & Risk Profile |
|---|---|---|---|---|---|
| Strategic Procurement & Sourcing Optimization | Direct & indirect supplier renegotiation, RFP competitive retendering, volume tier bundling, payment term extension (Net 30 to Net 60/90), demand management | 8.0% - 15.0% of external spend | 60 - 120 Days | 0.05x - 0.10x of annualized run-rate savings | Low internal friction; moderate vendor relationship management required; minimal impact on employee morale |
| Organizational Delayering & Spans Optimization | Eliminating redundant middle-management layers (8 tiers to 5 tiers), dissolving manager-of-one roles, widening span-of-control (1:3.8 to 1:7.4), job architecture simplification | 12.0% - 20.0% of SG&A payroll | 90 - 180 Days | 0.25x - 0.45x of annualized run-rate savings (Severance & retention outlays) | High organizational friction; requires sensitive internal change communications, clear retention packages for key talent, and board governance |
| Digital Process Automation & Shared Services | Robotic process automation (RPA) of transactional finance/accounting, AI customer support tier-1 deflectors, centralized global business services (GBS), invoice matching automation | 20.0% - 35.0% of transactional workflow cost | 120 - 270 Days | 0.40x - 0.75x of annualized run-rate savings (Software licenses, integration SI fees) | Medium organizational friction; significant technical and systems integration dependencies; high permanent operational scalability |
| Real Estate & Facilities Footprint Rationalization | Consolidating regional offices, subleasing vacant commercial floors, transitioning non-frontline functions to hybrid/remote, decommissioning redundant branch leases | 15.0% - 30.0% of occupancy overhead | 180 - 360 Days | 0.30x - 0.60x of annualized run-rate savings (Sublease tenant improvements, lease exit fees) | Low to Medium friction; dependent on commercial real estate submarket liquidity and legal contract flexibility |
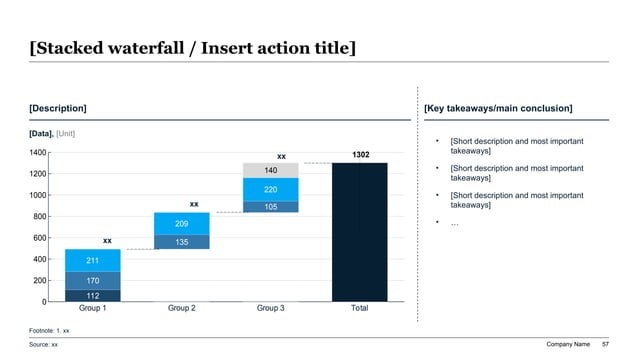
Exhibit 2: Enterprise Cost-Out Sizing & Run-Rate EBITDA Savings Waterfall Bridge
Building the Cost Reduction Waterfall: Decomposing Gross Ambition into Bankable EBITDA
The centerpiece of any board-level cost transformation presentation is the Cost-Out Sizing Waterfall Bridge. Directors, lenders, and private equity investors instinctively discount raw savings assertions because corporate history is littered with cost initiatives where projected savings dissolved into one-off implementation costs or were immediately offset by unbudgeted operational expenses elsewhere.
An executive waterfall bridge establishes mathematical defensibility by illustrating the exact, audited reconciliation between baseline expenditures and net bankable EBITDA. In our comprehensive corporate case study, the enterprise operates with a total annual spend baseline of $240.0M, of which $212.0M is classified as commercially addressable across operational workstreams.
The waterfall models six distinct structural movements:
1. Starting Baseline Spend ($212.0M Addressable Pool): Established through verified trailing-twelve-month financial audits.
2. Third-Party Procurement Optimization (-$11.5M Savings): Captured across vendor consolidation, rate card harmonization, volume bundling, and aggressive demand management policies.
3. Organizational Delayering & Headcount Rationalization (-$12.8M Savings): Achieved through management tier compression (8 layers down to 5) and span-of-control widening (1:3.8 average span expanded to 1:7.4), eliminating redundant executive overhead and managerial bureaucracy.
4. IT & Enterprise Software Rationalization (-$5.6M Savings): Unlocked by harvesting 3,200 dormant software licenses, sunsetting overlapping redundant applications, and rightsizing cloud compute infrastructure instances.
5. Real Estate & Facilities Consolidation (-$4.1M Savings): Realized by terminating underutilized regional satellite leases and consolidating corporate headquarters square footage from 140,000 sq ft down to 75,000 sq ft under a flexible hybrid model.
6. Restructuring Costs & Reinvestment Friction Buffer (+ $5.6M Total Offset): This is the critical credibility anchor that distinguishes elite executive decks from amateur slide presentations. The model explicitly deducts $3.2M in one-off severance, legal restructuring, and lease exit costs (amortized over Year 1), alongside a $2.4M strategic reinvestment buffer allocated directly to digital enablement and frontline sales compensation.
The resulting Net Bankable EBITDA Expansion of $36.6M represents a clean 15.3% reduction in addressable enterprise expenditures, expanding operating profit margins by 610 basis points on an annualized run-rate basis. Because all frictional headwinds and transition costs are transparently modeled on the slide, the board can underwrite the management case with total analytical confidence.
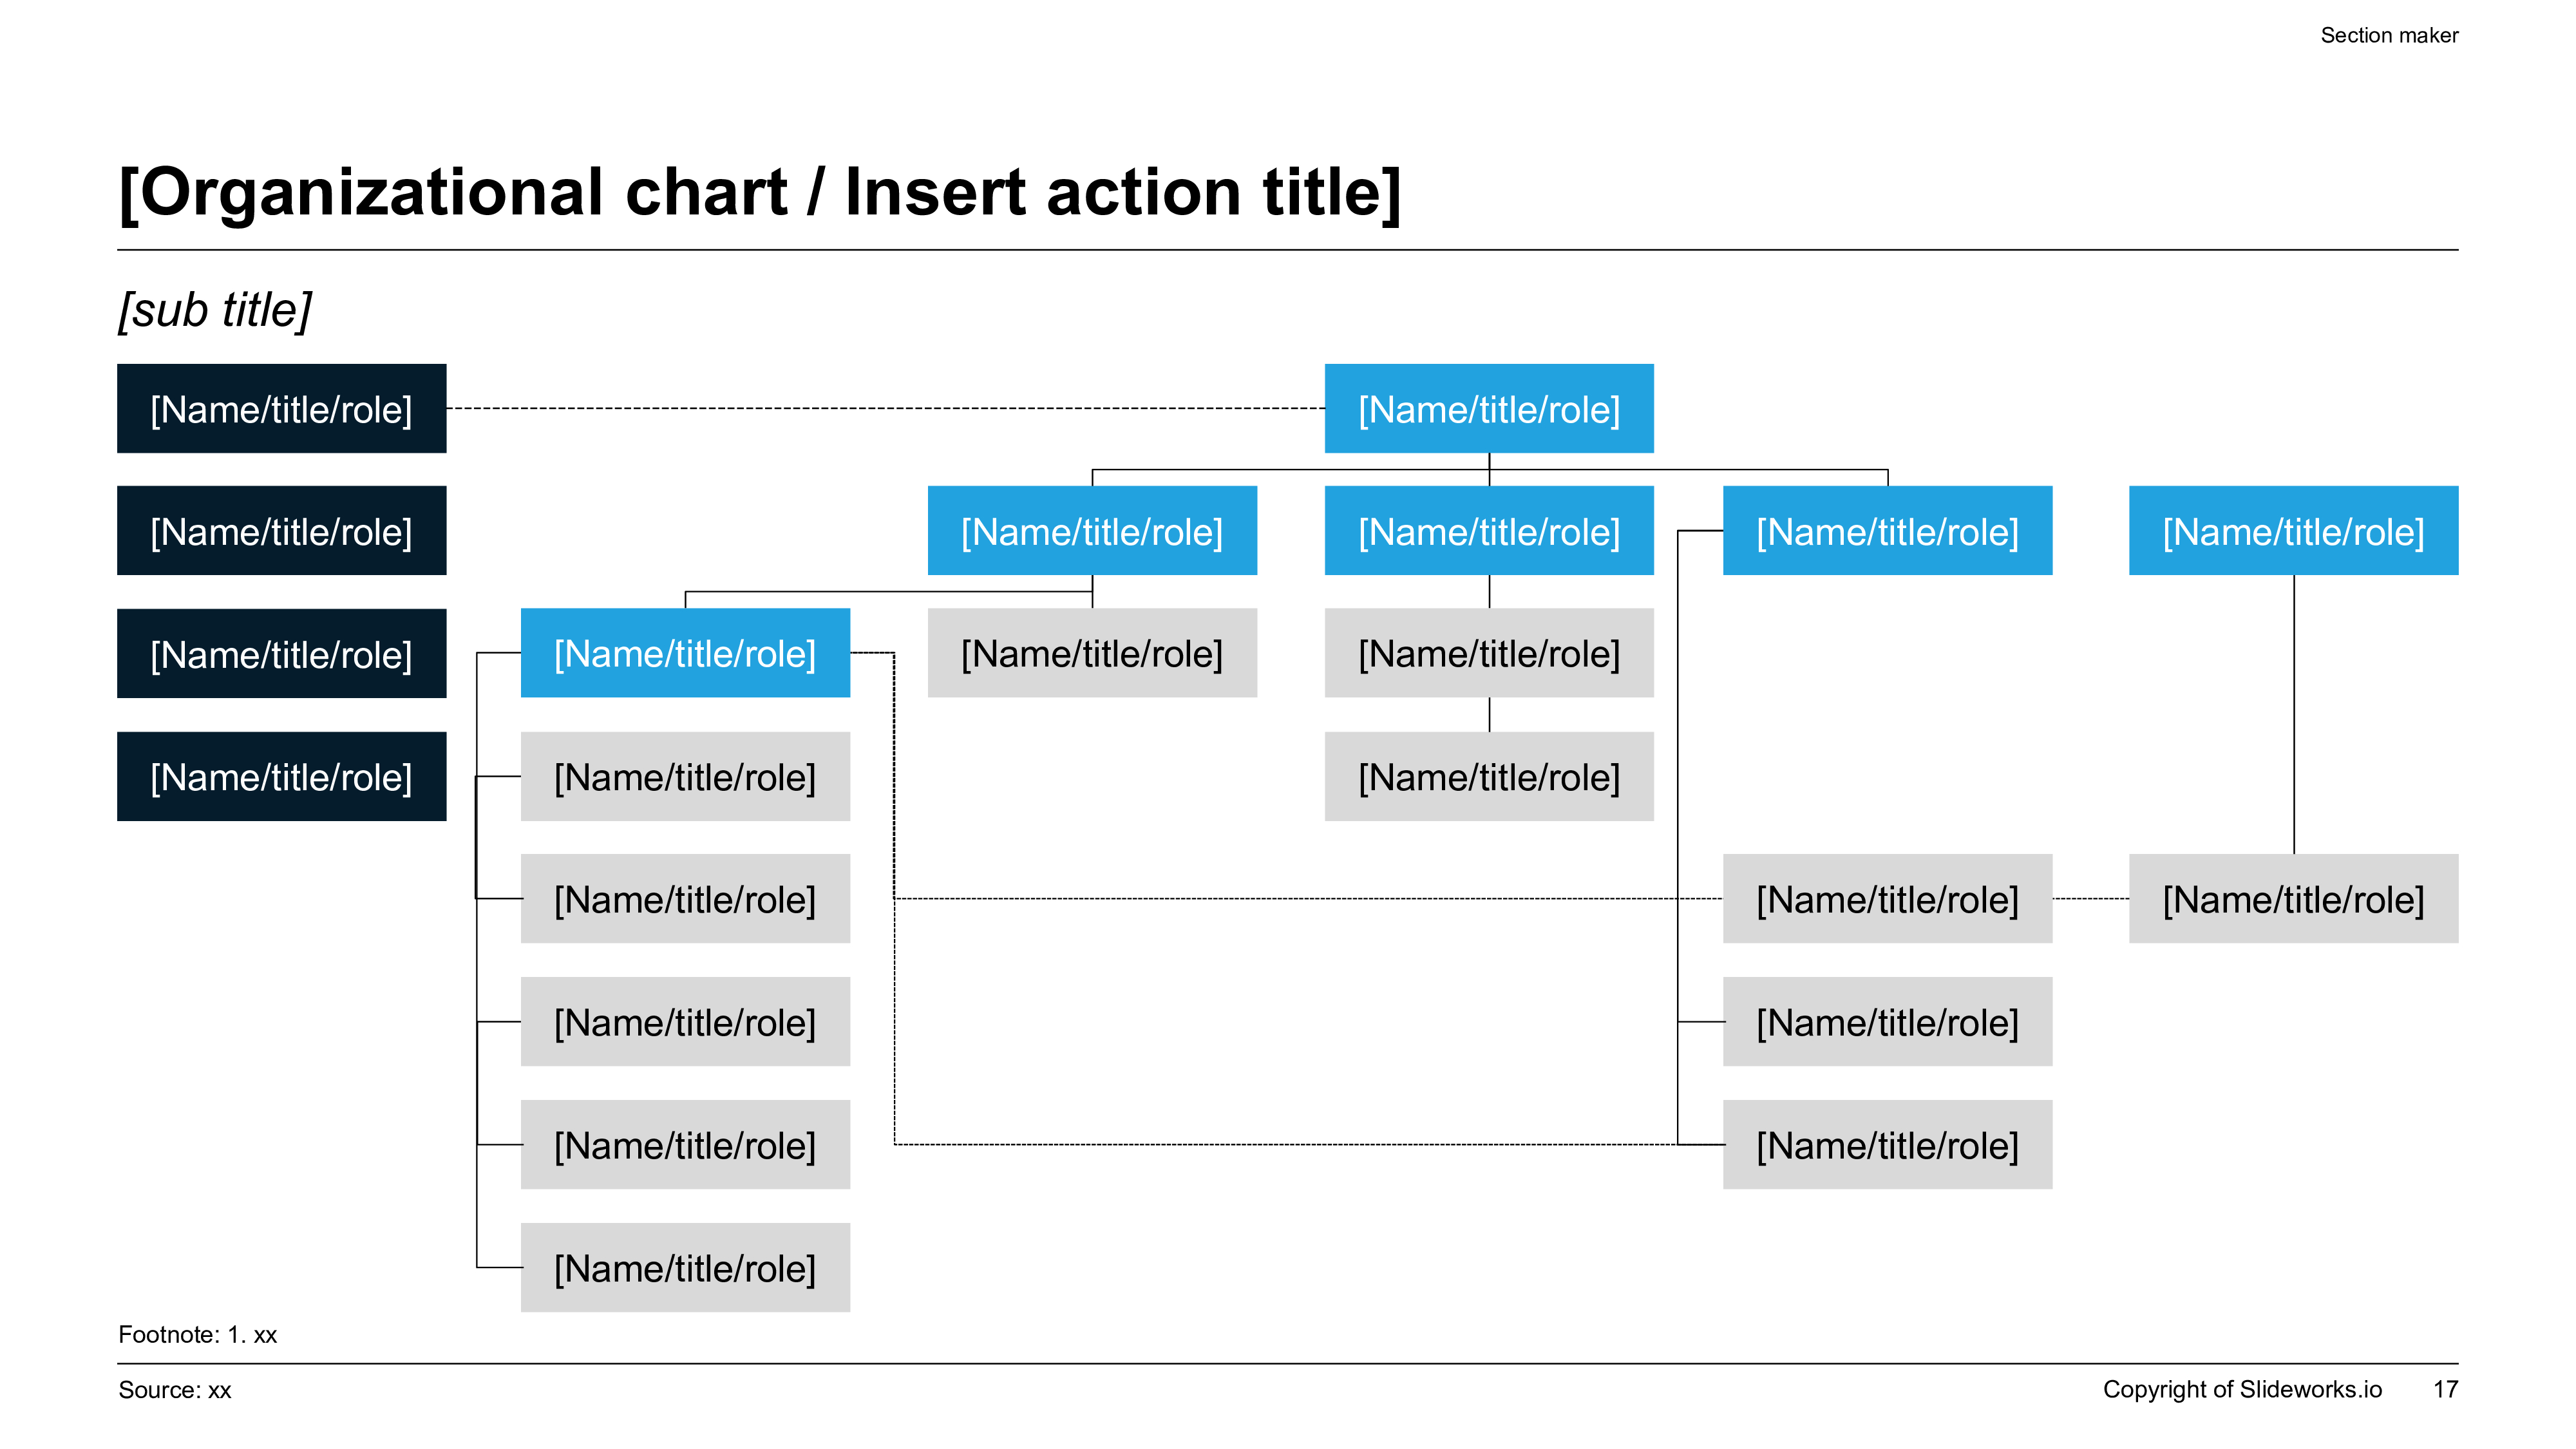
Exhibit 3: Organizational Delayering & Span-of-Control Governance Architecture
Organizational Delayering & Span-of-Control Benchmark Matrix by Corporate Function
A granular department-by-department diagnostic analysis contrasting baseline organizational layering and spans against target state operating model benchmarks, quantifying liberated annual headcount run-rate savings.
| Corporate Function | Baseline Headcount | Baseline Org Layers | Baseline Avg Span | Target Org Layers | Target Avg Span | Target Headcount Reduction | Annualized Payroll Savings ($M) |
|---|---|---|---|---|---|---|---|
| Finance, Accounting & Treasury | 84 FTEs | 7 Layers | 1:3.2 | 4 Layers | 1:6.8 | 18 FTEs (21.4%) | $2.45M |
| Human Resources & Internal Recruiting | 52 FTEs | 6 Layers | 1:3.4 | 4 Layers | 1:7.2 | 14 FTEs (26.9%) | $1.68M |
| Information Technology & Business Systems | 116 FTEs | 8 Layers | 1:3.6 | 5 Layers | 1:7.5 | 24 FTEs (20.7%) | $3.72M |
| Marketing, Brand & Communications | 65 FTEs | 7 Layers | 1:3.5 | 4 Layers | 1:6.5 | 15 FTEs (23.1%) | $1.85M |
| Supply Chain Operations & Procurement | 98 FTEs | 7 Layers | 1:4.1 | 5 Layers | 1:8.2 | 19 FTEs (19.4%) | $2.10M |
| Legal, Regulatory & Corporate Affairs | 25 FTEs | 5 Layers | 1:2.8 | 4 Layers | 1:4.5 | 4 FTEs (16.0%) | $0.98M |
| Total Corporate Overhead Functions | 440 FTEs | 8 Layers Max | 1:3.8 (Avg) | 5 Layers Max | 1:7.4 (Avg) | 94 FTEs (21.4%) | $12.78M |
Restructuring Management Architecture: Eliminating 'Manager-of-One' Spans and Middle-Management Friction
In corporate overhead reorganizations, the greatest destruction of enterprise value occurs when executives mandate percentage-based layoffs without altering organizational design. When a department simply cuts 10% of staff, the remaining employees inherit identical bureaucratic approval chains, meeting proliferation, and managerial bottlenecks. Decision latency worsens, burnout escalates, and key performers exit.
To achieve sustainable structural efficiency, management consulting practices (such as BCG Smart Simplicity and McKinsey Organization Design) utilize Spans & Layers Analysis. Spans and layers evaluate two structural metrics across the corporate hierarchy:
1. Organizational Layers: The number of supervisory tiers between the Chief Executive Officer and the frontline individual contributor. In high-overhead mid-market companies, organizations frequently accumulate 7 to 9 management layers, resulting in distorted operational directives, micro-management, and glacial approval cycles.
2. Span of Control: The number of direct reports reporting into each people manager. In unoptimized corporate structures, average spans frequently drop to 1:3 or 1:4, with pervasive "manager-of-one" anomalies—individuals given managerial titles and compensation bands who manage exactly one direct report.
Exhibit 3 visualizes the structural re-architecture. By eliminating manager-of-one supervisory roles and consolidating fragmented teams under cross-functional leaders, the enterprise compresses its vertical hierarchy from 8 tiers down to 5 tiers. Simultaneously, average management spans widen from 1:3.8 to 1:7.4.
This architectural shift achieves two powerful outcomes for the Board of Directors:
First, it delivers massive, permanent payroll savings. In our case study, restructuring corporate overhead yields a 21.4% reduction in non-quota corporate personnel (94 FTEs), liberating $12.78M in annual salary, bonus, and payroll burden expenses.
Second, it dramatically accelerates organizational agility. With three full layers of bureaucratic review eliminated, customer escalation cycles drop from 14 business days to 48 hours, capital approval workflows require two signatures instead of six, and frontline teams are empowered to execute without multi-tier managerial interference.
Exhibit 4: Transformation Office (TO/PMO) Stage-Gate Initiative Scorecard & Tollgate Tracker
The Transformation Office (TO): Institutionalizing L1-L5 Stage-Gate Tollgates and P&L Drag Elimination
The graveyard of corporate turnaround initiatives is filled with programs where executive committees announced aggressive cost targets, issued press releases, and celebrated on PowerPoint slides, only to find six months later that general ledger expenses had actually increased. This phenomenon—known as "Cost-Out Evaporation"—occurs when identified savings are eroded by unauthorized headcount replacement, phantom consulting fees, or departmental budget recycling.
To guarantee that every identified efficiency dollar flows directly into reported earnings, elite restructuring advisors institute an empowered Transformation Office (TO) governed by a rigorous 5-stage gating methodology:
• Stage L1 (Idea & Identification): A cost-out initiative is conceived and logged into the transformation register. Preliminary savings ranges are scoped without formal validation.
• Stage L2 (Charter & Feasibility Assessment): The initiative lead authors a comprehensive project charter detailing operational requirements, regulatory risks, customer impact assessments, and upfront capital requirements. Crucially, the charter identifies the exact general ledger cost center code and line item from which money will be extracted.
• Stage L3 (Detailed Planning & Bottom-Up Sizing): FP&A rigorously stress-tests the financial model. Timelines, severance calculations, vendor termination penalties, and IT dependencies are finalized. The initiative receives formal operational sign-off from the Workstream Sponsor.
• Stage L4 (Active Execution & Implementation): The initiative is actively implemented in the field—vendor contracts are renegotiated, organizational roles are transitioned, leases are exited, or software instances are decommissioned. Operational KPIs are monitored weekly to detect customer disruption.
• Stage L5 (Banked P&L Realization & GL Lock): The ultimate milestone. The CFO and Controller permanently reduce the baseline budget allocation in the enterprise ERP for that specific cost center. The savings are mathematically locked and visible on monthly financial management accounts.
Exhibit 4 demonstrates how the Transformation Office presents this governance framework to the Board Audit Committee. By displaying the active pipeline of 34 discrete cost initiatives across stages L1 through L5, the executive team proves that cost reduction is managed with the same rigorous governance and accountability as core revenue operations.
The Stage-Gate Tollgate & CFO P&L Sign-Off Checklist
Exhibit 5: Multi-Quarter Execution Roadmap & Run-Rate Savings Realization Schedule
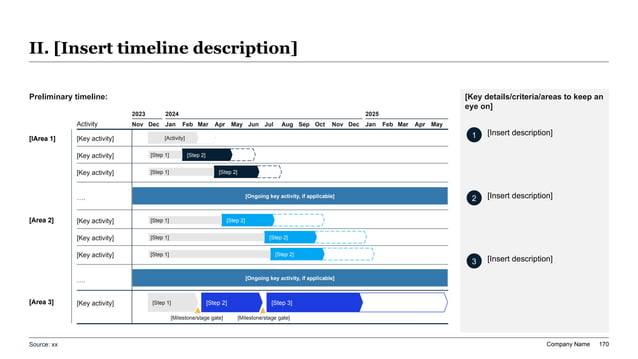
Phased Implementation Sequencing: Balancing Quick-Hit Liquidity with Long-Term Structural Redesign
A fatal mistake in corporate cost transformation decks is presenting all cost initiatives as an undifferentiated, simultaneous blitzkrieg. Attempting to execute enterprise-wide organizational delayering, complex IT shared services migrations, and multi-facility real estate closures simultaneously overtaxes organizational bandwidth, paralyses operational execution, and invites severe employee backlash.
Institutional presentation decks sequence implementation across three disciplined operational waves, balancing immediate cash liquidity generation with long-term structural operating model redesign:
• Wave 1: Immediate Cash Liberation & Quick Hits (Months 1 to 3): Focuses exclusively on non-invasive, low-friction spend categories that yield rapid cash liquidity without operational disruption. Key initiatives include implementing strict discretionary spending controls, eliminating dormant SaaS software licenses, freezing non-essential hiring, and capturing fast procurement discounts through payment term extensions. In our baseline case study, Wave 1 liberates $6.2M in annualized cash flow, funding the upfront restructuring costs of subsequent phases.
• Wave 2: Operational Restructuring & Sourcing Harmonization (Months 4 to 9): Executes the primary structural interventions across procurement and organizational architecture. Comprehensive RFP retendering processes are conducted across top vendor categories, middle-management layers are compressed from 8 tiers to 5, and redundant operational roles are transitioned out under structured severance packages. By the conclusion of Month 9, an additional $18.4M in annualized savings is formally banked into general ledger cost centers.
• Wave 3: Structural Operating Model Transformation & Automation (Months 10 to 18): Implements permanent, technology-enabled operational efficiencies. Transactional back-office workflows in finance, HR, and customer care are migrated to digital automation platforms and centralized shared services centers. Long-term commercial real estate leases are renegotiated or subleased. Wave 3 delivers the final $12.0M in structural savings, completing the full $36.6M run-rate EBITDA expansion.
Exhibit 5 showcases this multi-horizon roadmap layout. By illustrating distinct implementation phases with clear stage-gate tollgates, cash burn curves, and executive milestones, leadership demonstrates to the Board of Directors that the transformation is controlled, de-risked, and mathematically aligned with enterprise capital planning.
Institutional Enterprise Cost Reduction Deck Generation Prompt for XLSlides
{ "system_instruction": "You are an elite corporate turnaround and operations strategy partner at a top-tier management consultancy (McKinsey RTS, BCG TURN, Alvarez & Marsal). Your role is to generate an institutional, boardroom-ready, 14-slide Enterprise Cost Reduction & Operational Efficiency presentation for the CFO, CEO, and Board of Directors. Every slide must feature an executive action title summarizing the core quantitative takeaway, followed by structured analytical frameworks, auditable financial bridges, benchmark ratios, and concrete operational milestones. Strictly avoid generic bulleted lists, superficial AI platitudes, and decorative stock imagery.", "user_input_variables": { "enterprise_profile": "Mid-Market B2B Industrial Technology & Services Enterprise ($380M Annual Revenue, $240M Total Operating Spend Baseline, 1,450 Global Employees, 8.2% Baseline Operating Margin).", "financial_mandate": "Expand EBITDA operating margin from 8.2% to 15.0% over an 18-month execution horizon by capturing $36.6M in sustainable net run-rate cost reductions across corporate overhead, procurement, and operational footprint.", "core_workstreams": [ "Workstream 1: Third-Party Procurement & Vendor Tail Consolidation ($82.5M Baseline Spend -> $11.5M Net Target Run-Rate Savings)", "Workstream 2: Corporate SG&A Delayering & Spans Optimization ($68.0M Baseline Spend -> $12.8M Net Target Run-Rate Savings)", "Workstream 3: Enterprise IT, Cloud & SaaS Software Rationalization ($34.2M Baseline Spend -> $5.6M Net Target Run-Rate Savings)", "Workstream 4: Real Estate & Facilities Footprint Optimization ($22.8M Baseline Spend -> $4.1M Net Target Run-Rate Savings)" ], "restructuring_capital_envelope": "$3.2M One-Off Restructuring Cash Costs (Severance, retention, legal, lease exit fees) + $2.4M Strategic Reinvestment Buffer (Digital enablement, frontline sales incentives)." }, "slide_architecture": [ "Slide 1: Executive Summary & Transformation Charter (Action Title: Board-Mandated 680 bps EBITDA Expansion via $36.6M Net Structural Cost-Out Program)", "Slide 2: Macro Context & Margin Diagnostic (Historical gross margin compression, inflation headwinds, and competitor benchmark gaps)", "Slide 3: MECE Spend Cube & Baseline Decomposition (Decomposing $240M total spend into addressable vs. non-addressable categories across 4 operational workstreams)", "Slide 4: Addressable Spend Leakage Audit (Top 10 leakage areas: vendor tail sprawl, software shelfware, and managerial bottlenecks)", "Slide 5: Enterprise Cost-Out Sizing Waterfall Bridge (Visual bridge from $212M addressable baseline down to $36.6M net run-rate EBITDA expansion, showing gross savings, restructuring costs, and reinvestment buffers)", "Slide 6: Workstream 1 Deep-Dive: Procurement & Sourcing Optimization (Vendor consolidation matrix, RFP retender yield, and payment term harmonization from Net 30 to Net 60/90)", "Slide 7: Workstream 2 Deep-Dive: Spans & Layers Organizational Redesign (Compressing hierarchy from 8 to 5 tiers, eliminating manager-of-one roles, widening spans from 1:3.8 to 1:7.4)", "Slide 8: Organizational Benchmark Scorecard by Function (Departmental breakdown of 94 corporate FTE transitions and $12.78M payroll burden savings)", "Slide 9: Workstream 3 Deep-Dive: Enterprise IT & Software Rationalization (Reclaiming 3,200 dormant SaaS licenses and rightsizing cloud compute instances)", "Slide 10: Workstream 4 Deep-Dive: Facilities & Footprint Consolidation (Downsizing corporate headquarters from 140K to 75K sq ft under hybrid model, terminating regional leases)", "Slide 11: Transformation Office (TO) Governance & Stage-Gate Methodology (L1 Idea -> L2 Charter -> L3 Plan -> L4 Execute -> L5 Banked in General Ledger)", "Slide 12: Active Initiative Pipeline & Stage-Gate Scorecard (Tracking 34 discrete workstreams across L1-L5 with CFO sign-off status)", "Slide 13: 18-Month Phased Implementation Roadmap (Wave 1 Quick Hits Months 1-3 -> Wave 2 Operational Restructuring Months 4-9 -> Wave 3 Operating Model Transformation Months 10-18)", "Slide 14: Non-Negotiable Guardrails & Board Risk Mitigation Matrix (Ring-fencing commercial sales quota capacity, R&D patent pipeline, and customer delivery SLAs)" ] }
Frequently Asked Questions on Enterprise Cost Reduction & Board Governance
What is the standard benchmark for addressable spend in an enterprise cost reduction program?
In typical corporate enterprises, between 70% and 85% of total operating expenditures (excluding raw material direct cost of goods sold and statutory regulatory fees) are classified as commercially addressable. Third-party procurement and external vendor spend typically yields 10% to 18% in net savings; corporate SG&A and organizational hierarchy overhead yields 15% to 22%; enterprise IT and software licensing yields 14% to 20%; and corporate real estate occupancy yields 18% to 25%.
How do top management consultants distinguish between cost avoidance and bankable cash savings?
Cost avoidance refers to negotiating a discount off a vendor's initial price increase or list price, which prevents an expenditure increase but does not reduce historical cash outflows. Bankable cash savings (or general ledger savings) represent verified mathematical reductions in historical cash expenditures relative to baseline trailing general ledger accounts. Elite transformation programs govern exclusively by bankable cash savings, permanently reducing ERP department budget envelopes.
What is an optimal span of control for enterprise management structures?
While optimal spans vary by functional complexity, best-practice management consulting benchmarks establish target managerial spans of 1:7 to 1:10 for professional corporate functions (finance, HR, procurement, operations) and 1:12 to 1:18 for standardized transactional or frontline operations (customer service, warehousing, retail operations). Highly technical or specialized functions (corporate legal, strategic M&A) operate effectively with narrower spans of 1:4 to 1:6.
How should upfront restructuring costs (severance, lease penalties) be accounted for in the cost-out waterfall?
Upfront restructuring cash outlays must be modeled as a distinct, transparent deducting movement in the transformation waterfall. Best-practice corporate presentations display both the Gross Annualized Run-Rate Savings (the perpetual annual benefit) and the Net Year 1 Cash Realization (Gross Savings minus Severance, Legal, and Lease Break Cash Outflows). In typical corporate transformations, one-off restructuring costs range from 0.20x to 0.45x of first-year gross savings.
Why do across-the-board percentage budget cuts almost always fail over time?
Across-the-board percentage budget cuts (e.g., mandating that every department cut 10%) fail because they penalize lean, highly productive commercial growth teams while failing to address the root structural causes of overhead in bloated administrative departments. Furthermore, they incentivize department heads to pad their budgets prior to budget reviews, reward political maneuvering, and leave inefficient organizational layers and redundant workflows completely intact.
What role does the Chief Transformation Officer (CTO) play relative to the CFO during a cost program?
While the Chief Financial Officer (CFO) serves as the ultimate financial arbiter, underwriter, and general ledger gatekeeper, the Chief Transformation Officer (CTO) leads operational execution. The CTO manages the Transformation Office (TO/PMO), runs the bi-weekly stage-gate tollgate reviews, holds workstream leaders accountable for delivery milestones, and eliminates cross-functional operational roadblocks across business units.
How can AI presentation tools like XLSlides accelerate cost reduction governance for executive teams?
Traditional management teams lose hundreds of billable hours attempting to manually format complex spend waterfalls, organizational delayering hierarchy charts, and stage-gate initiative tables in legacy presentation software. XLSlides automates the generation of institutional, consulting-grade slides directly from structured financial data cubes and ERP exports, enforcing MECE structuring, action titles, and audit-grade annotations in editable PowerPoint formats.
Generate Institutional Cost Reduction & Efficiency Decks with XLSlides
Stop wasting valuable consulting and FP&A hours wrestling with manual PowerPoint shapes, unformatted waterfall bridges, and misaligned organizational hierarchies. XLSlides turns your spend cubes, delayering models, and cost-out data into boardroom-ready, editable PowerPoint presentations built on management consulting logic, action titles, and institutional financial design standards.
Methodology And Sources
- Where to Cut and Where to Grow: Driving Enterprise Productivity and Operational Resilience(McKinsey & Company • 2024)
Foundational research on strategic spend baselining, MECE cost-out categorization, and separating growth-accretive investments from non-strategic administrative overhead.
- Smart Simplicity: Managing Complexity Without Getting Complicated and Optimizing Organizational Spans & Layers(Boston Consulting Group • 2023)
The industry-standard framework for analyzing organizational layers, eliminating manager-of-one bottlenecks, and widening span-of-control ratios to accelerate operational decision velocity.
- Cost Cutting That Makes You Stronger: How Leaders Separate Strategic Costs From Non-Strategic Fat(Harvard Business Review • 2020)
Seminal strategy analysis by Paul Leinwand, Cesare Mainardi, and Art Kleiner on differentiating strategic differentiating capabilities from non-core expense pools.
- Zero-Based Redesign: Rebuilding the Operating Model to Accelerate Growth and Eliminate Structural SG&A Drag(Bain & Company • 2023)
Comprehensive methodologies for structural SG&A cost transformation, zero-based overhead redesign, and sustainable operating margin expansion.
- Transforming the Cost Structure: Moving Beyond Traditional Cost Reduction to Sustainable Margin Expansion(Deloitte Touche Tohmatsu Limited • 2024)
Institutional guidance on establishing Transformation Offices (TO), stage-gate L1-L5 tollgate governance, and locking savings into general ledger cost centers.