The Executive Mandate: Translating Technical Architecture into Boardroom Strategy
Executive Summary & Core Architectural Modernization Principles
Simulate & Prototype: Enterprise Architecture & IT Strategy Presentation Guide: Executive Modernization Decks
Drag to draw custom components, test consulting layout presets, and preview presentation architecture live before generating with AI.
The 4-Tier Enterprise Architecture Stack & Technology Operating Blueprint
Exhibit 1: The 4-Tier Enterprise Architecture Stack & Technology Operating Blueprint
Table 1: Enterprise Architectural Layers, Governance Artifacts & C-Suite Decision Mandates
The Pre-Board Architecture Modernization Readiness Gate: 10 Architectural Integrity Audits
Application Portfolio Management & The TIME Rationalization Matrix
Exhibit 2: Application Portfolio Management (APM): The Gartner TIME Rationalization Matrix
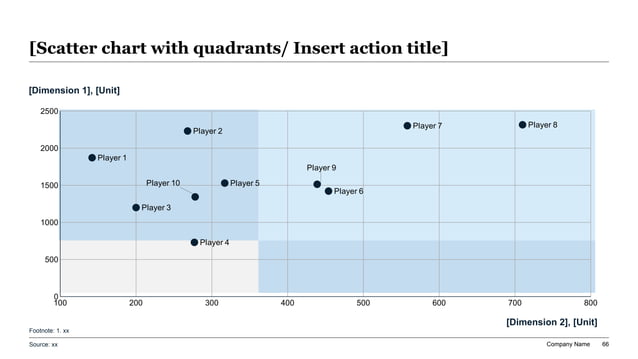
Table 2: TIME Portfolio Rationalization Governance: Disposition Criteria, Modernization Levers & Multi-Year P&L Impact
Technical Debt Valuation, Total Cost of Ownership & CapEx Modernization Envelope
Exhibit 3: Technical Debt Dollarization & 5-Year Modernization Investment Envelope
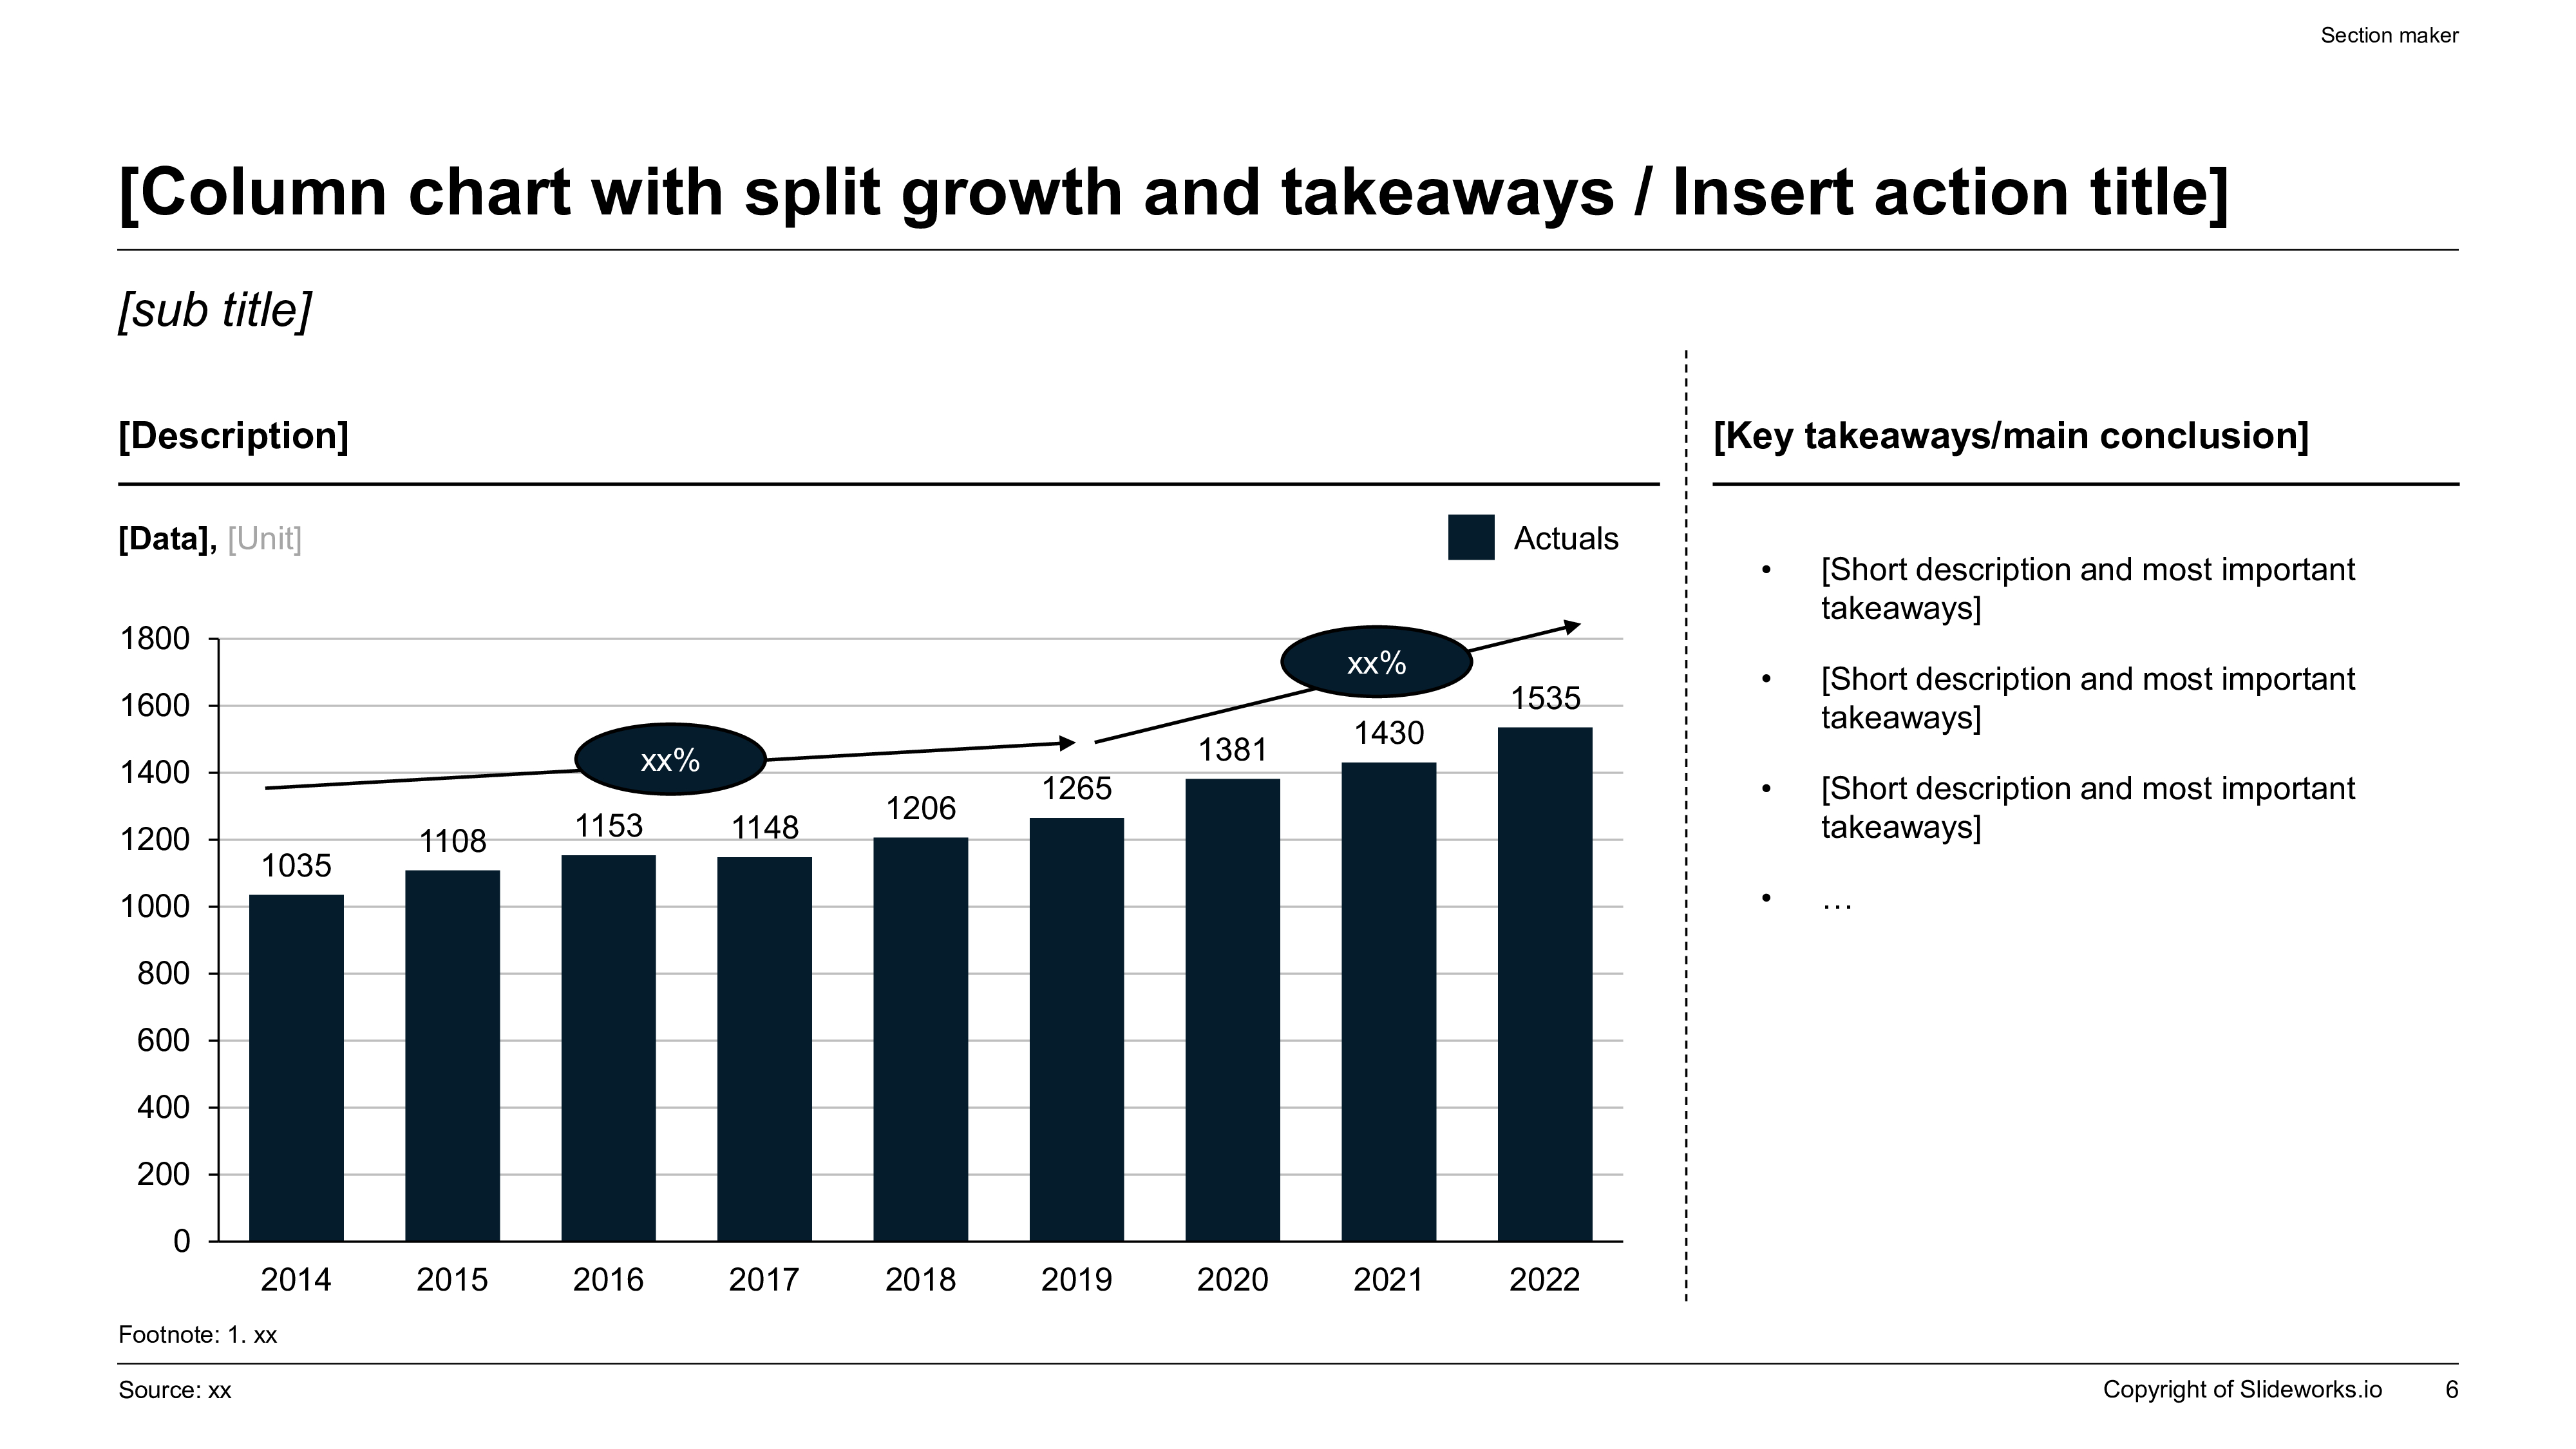
Multi-Horizon Enterprise Modernization Flight Path: From Legacy Monoliths to Composable Platforms
Exhibit 4: Multi-Horizon Enterprise Modernization Flight Path & Technical Transition Roadmap
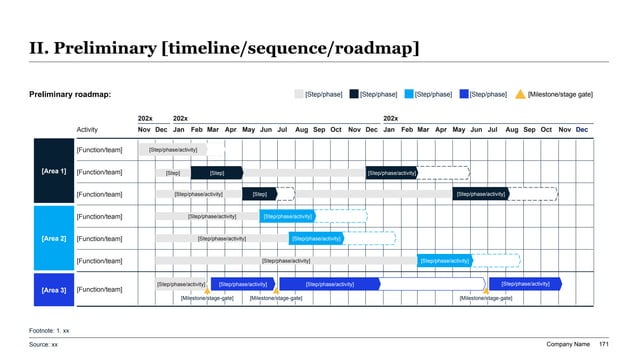
Table 3: Multi-Horizon Enterprise Modernization Execution Matrix: Workstreams, Milestones & Stage-Gate Criteria
Modern IT Operating Model: Platform Engineering, DevSecOps & Architecture Governance
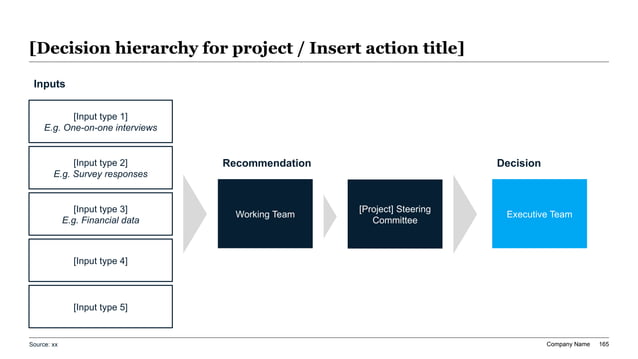
Exhibit 5: Enterprise Architecture Governance & Architecture Review Board (ARB) Stage-Gate Decision Pipeline
The Architecture Review Board (ARB) Project Governance & Cutover Checklist
The 8-Slide Institutional IT Strategy & Architecture Board Deck Structure
Common Architectural Anti-Patterns: Why Enterprise IT Initiatives Fail in the Boardroom
Executive XLSlides Prompt Recipe: Generating Board-Ready IT Strategy & Architecture Decks
Act as a Senior Partner at McKinsey Technology Practice and Chief Enterprise Architect preparing an executive board presentation for the Board of Directors, CEO, and CFO of a $2.5B enterprise undergoing core technology modernization. Context & Baseline Metrics: - Current Landscape: 320 legacy enterprise applications across 4 regional business units; 68% of IT budget ($45M/year) consumed by Keep-the-Lights-On (KTLO) maintenance; core transaction engine running on heavily customized on-premise monolith; recurring Sev-1 batch crashes impacting quarter-end financial close; average developer onboarding time of 14 weeks. - Modernization Mandate: 3-Year, $32M capital investment program to establish a 4-Tier Target Architecture Stack, rationalize application portfolio via Gartner TIME, execute Strangler Fig migration to cloud-native microservices, and transition operating model to Platform Engineering. Slide Generation Instructions: 1. Slide 1 (Executive Summary): Action title establishing the commercial mandate. Synthesize current technical debt drag ($45M/yr maintenance tax) versus target state benefits ($16.5M/yr recurring P&L savings, 22-month cash payback, 4x release velocity). Use a 3-column executive summary card layout (Strategic Context, Financial Business Case, Immediate Decision Tranche). 2. Slide 2 (4-Tier Architecture Stack): Construct a clean, institutional 4-tier architectural blueprint diagram (Business Architecture, Application Ecosystem, Unified Data Fabric, Hybrid Cloud Infrastructure) with explicit API gateway boundary callouts. 3. Slide 3 (Gartner TIME Matrix): Classify the 320 applications across Tolerate (70 apps), Innovate (90 apps), Migrate (105 apps), and Eliminate (55 apps). Highlight immediate 90-day decommissioning of Eliminate systems to harvest $4.8M in software license cash savings. 4. Slide 4 (Multi-Horizon Modernization Roadmap): Structure a phased 36-month transition timeline across Horizon 1 Core De-Risking (Months 1-12), Horizon 2 Platformization (Months 12-24), and Horizon 3 Composable Enterprise (Months 24-36) with explicit stage-gate governance criteria. 5. Slide 5 (5-Year TCO & Capital Waterfall): Build a financial bridge chart showing the transition from baseline $66M annual IT run-rate through upfront modernization CapEx, dual-running bubble costs, and ultimate landing at $49.5M optimized annual operating expense. Tone & Formatting: Executive, precise, data-dense, MECE. Eliminate generic tech buzzwords. Every slide must feature an assertive action title, supporting quantitative metrics, and clean PowerPoint-style visual hierarchy ready for boardroom presentation.