The Executive Mandate: Why 73% of Enterprise Data Initiatives Fail to Create Economic Value
Key Takeaways: What Executive Boards & CDOs Must Command
Simulate & Prototype: Enterprise Data Strategy & Governance Presentation Guide
Drag to draw custom components, test consulting layout presets, and preview presentation architecture live before generating with AI.
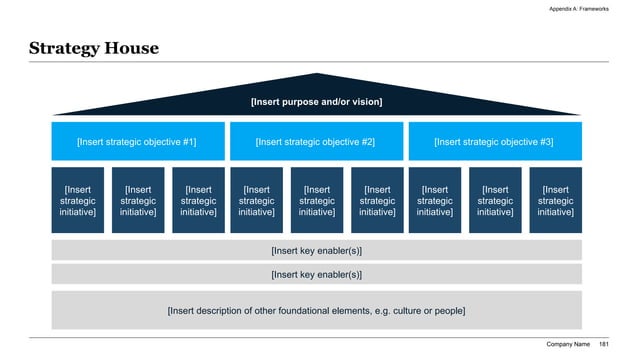
Exhibit 1: The Enterprise Data Strategy House Architecture
From Monolithic Data Lakes to Federated Data Mesh: The Modern Architectural Paradigm
Table 1: Enterprise Data Architecture & Storage Archetypes: Data Lake vs. Cloud Lakehouse vs. Federated Data Mesh
Master Data Management (MDM) & The Six Dimensions of Data Quality
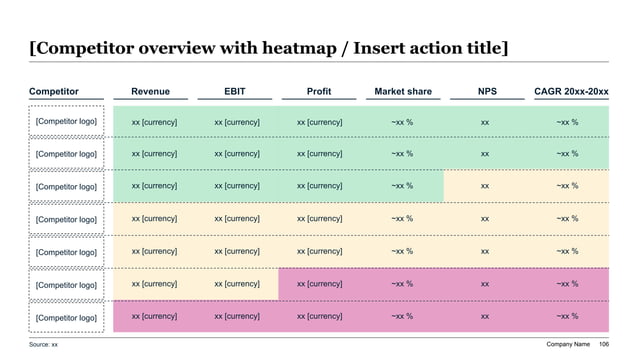
Exhibit 2: Enterprise Data Quality & MDM SLA Health Heatmap Across Operating Domains
Checklist 1: The Pre-Executive Data Governance Readiness Gate (10 Mandatory Strategic & Governance Checks)
Designing the Federated Data Governance Operating Model: Council, Domains & Stewardship
Table 2: Data Stewardship & Ownership RACI Across Enterprise Functional Domains
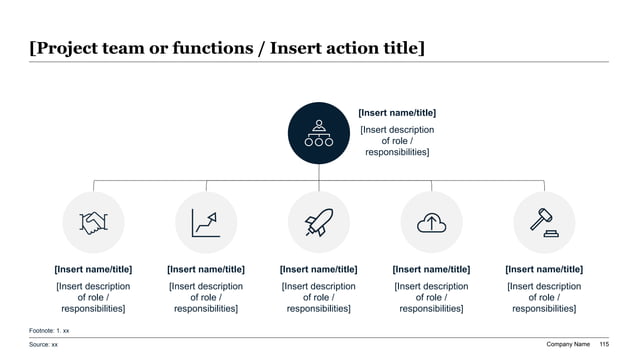
Exhibit 3: Federated Data Governance Hierarchy & Operating Cadence
Monetizing the Enterprise Data Asset: Translating Data Engineering into Bottom-Line EBITDA
Exhibit 4: Enterprise Data Investment to Economic Value & Cash Flow Waterfall Bridge
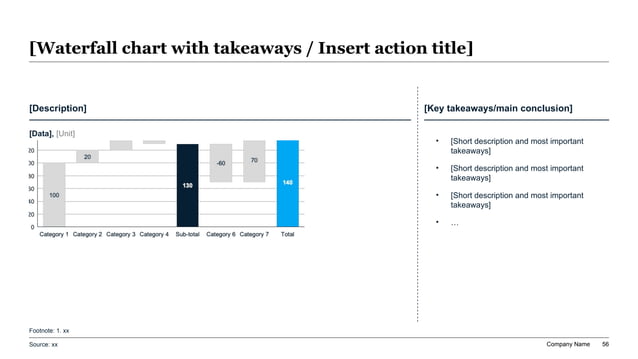
Table 3: Master Data Management (MDM) & The Six Core Data Quality Dimensions
Regulatory Compliance, Data Privacy & AI Model Risk Governance (GDPR, CCPA, BCBS 239, EU AI Act)
Checklist 2: The Pre-Board Data Architecture & Regulatory Audit Checklist (10 Operational & Risk Verification Gates)
Phasing the Multi-Year Enterprise Data Modernization Roadmap
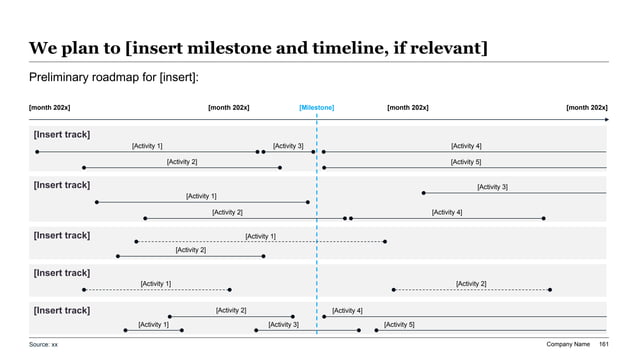
Exhibit 5: 36-Month Enterprise Data Transformation & Modernization Roadmap
The 8-Slide Decision-Ready Board Data Presentation Architecture
XLSlides Executive Prompt Recipe: Data Strategy & Governance Presentation
You are a Senior Partner at McKinsey QuantumBlack and Chief Data Officer advisor specializing in enterprise data strategy, modern cloud lakehouse architectures, and corporate governance for Global 2000 companies. Generate a comprehensive, 8-slide executive presentation in PowerPoint format based on the following enterprise transformation context: Context & Organizational Baseline: - Enterprise Profile: $3.2B revenue global industrial manufacturing and B2B services enterprise operating across North America, Europe, and APAC with 14,000 employees. - Current Pain Points: Fragmented data estate with 4 legacy on-premises data warehouses and 60+ uncurated data lakes; centralized data engineering team overwhelmed with 4-month ticket backlogs; duplicate customer records (18% duplicate rate) causing billing errors and conflicting marketing campaigns; poor data quality resulting in $14M annual inventory holding write-offs and CFO skepticism of BI reporting; looming audit exposure under EU CSRD, GDPR, and emerging EU AI Act governance. - Proposed Strategy: 36-month enterprise modernization to a Federated Data Mesh built on a unified Cloud Lakehouse (Snowflake / Databricks with Apache Iceberg); decentralized Domain Data Ownership across 5 core business units (Commercial, Supply Chain, Manufacturing, Finance, People); automated Master Data Management (MDM) establishing golden records for Customer and Product entities; 3-tier federated data governance operating model (Executive Data Council, Domain Owners, Data Stewards). - Financial Program Economics: $24.0M total capital investment over 36 months ($14M Capex, $10M Opex); projected gross economic value creation of $81.5M ($38.5M operational labor productivity and legacy IT sunset, $18.2M working capital inventory liberation, $24.8M pricing margin expansion); net bankable EBITDA expansion of $45.0M (3.4x program ROI, 18-month payback). Slide-by-Slide Requirements: Slide 1: Executive Summary & Strategic Rationale — Frame the imperative to transform from an infrastructure cost center into a value-generating data product organization. Split-panel layout with key financial returns, regulatory drivers, and executive decisions requested. Slide 2: Enterprise Data Strategy House Architecture — Present the strategy house framework: Corporate Vision/Outcomes roof, 4 operational pillars (Data Products, Federated Governance, MDM Quality, AI Enablement), and secure Cloud Lakehouse foundation. Slide 3: Modern Data Architecture & Storage Archetypes — Compare Centralized Data Lake vs. Cloud Lakehouse vs. Federated Data Mesh across storage paradigms, ownership models, and time-to-insight. Slide 4: Master Data Management (MDM) & Quality SLA Heatmap — Display the 6-dimension data quality framework (Completeness, Accuracy, Consistency, Timeliness, Uniqueness, Validity) across Customer, Product, Finance, and Supply Chain domains with clear Green/Amber/Red status. Slide 5: Federated Governance Operating Model & RACI — Detail the 3-tier structure: Executive Data Council, Business Domain Owners, and Embedded Data Stewards. Clarify the RACI matrix across the data lifecycle. Slide 6: Financial Valuation & EBITDA Waterfall Bridge — Present an 8-segment ascending/descending waterfall bridge tracing from the $24.0M capital investment through cost savings, working capital release, and revenue acceleration to $45.0M net EBITDA. Slide 7: Regulatory Compliance, Privacy & AI Model Risk — Highlight governance controls across GDPR/CCPA DSAR automation, column-level masking, BCBS 239 audit lineage, and EU AI Act high-risk model training data validation. Slide 8: Multi-Year Transformation Roadmap & Board Resolutions — Outline the 3-Horizon flight path (Months 1-6 Foundation, Months 7-18 Decentralization, Months 19-36 Autonomous Scale) with explicit stage-gate tollgates and formal board resolution text. Tone & Style Guidelines: - Use formal executive consulting language. Avoid casual tone, technical engineering jargon without business context, or generic AI fluff. - Write bold, conclusion-first action titles for every slide (e.g., 'Decentralizing Data Product Ownership to Business Domains Compresses Analytical Lead Times from 10 Weeks to 3 Days'). - Quantify all economic impacts with concrete dollar figures, operational percentages, and specific timelines.