Executive Summary: The Board-Grade ERM Standard
- Enterprise Risk Management (ERM) presentations are strategic decision and capital allocation documents, not compliance tick-box archives.
- Dumping raw, 200-row Excel risk registers into a PowerPoint slide deck triggers cognitive fatigue and paralyzes boardroom oversight; directors require a filtered 5x5 heatmap with explicit velocity vectors.
- Every risk presented to the Board must articulate both Inherent (gross) and Residual (net) exposure, quantifying the financial return on deployed mitigation controls.
- The Risk Appetite Statement (RAS) must establish non-negotiable quantitative boundary conditions across strategic, financial, cyber, operational, and regulatory domains.
- Early-warning Key Risk Indicators (KRIs) must be leading rather than lagging, linking trigger breaches directly to predetermined management playbooks.
- The Three Lines of Defense (3LoD) governance architecture must clarify unambiguous operational ownership, independent risk oversight, and objective audit validation.
The Board-Level ERM Mandate: Shifting from Compliance Checklist to Strategic Decision Shield
In modern corporate governance, the presentation of Enterprise Risk Management (ERM) has evolved from a passive compliance ritual into the central defense mechanism of corporate value. Board of Directors, Audit Committees, and dedicated Board Risk Committees operate under unprecedented regulatory scrutiny, activist pressure, and macroeconomic volatility. Directors are no longer satisfied with listening to general legal disclaimers or reviewing qualitative lists of generic corporate anxieties. They demand a mathematically grounded, strategically prioritized assessment of the existential and material threats facing the enterprise.
For Chief Risk Officers (CROs), General Counsels, Chief Compliance Officers, and risk advisory partners, this transformation dictates a fundamental redesign of executive presentation materials. When an ERM presentation succeeds, it provides directors with complete clarity regarding where the organization is taking deliberate, compensated risks to drive return on invested capital (ROIC), and where uncompensated operational, cyber, or regulatory exposures threaten enterprise solvency. It equips the board to evaluate whether management's mitigation controls are operating effectively and whether current capital reserves are sufficient to absorb tail-risk shocks.
Conversely, when an ERM deck fails, it leaves the board blind to emerging vulnerabilities until a catastrophic breach, regulatory fine, supply chain collapse, or credit downgrade occurs. The primary cause of this failure is not a lack of internal diligence or data gathering; it is the inability of risk leadership to synthesize thousands of operational data points into a coherent, executive narrative that facilitates rigorous board-level decision-making.
The Core Failure Mode: Why 200-Row Excel Risk Registers Poison Boardroom Engagement
The single most pervasive failure mode in enterprise risk reporting is the 'Risk Register Dump.' Operational risk teams spend weeks surveying business units, compiling hundreds of granular risks, and calculating composite risk scores inside massive spreadsheets. When preparing for the quarterly Board Risk Committee meeting, well-meaning teams attempt to demonstrate thoroughness by shrinking these 200-row registers onto landscape slides using 7-point fonts and dense qualitative bullet points.
This approach fails three critical boardroom tests. First, it violates the Principle of Cognitive Hierarchy: board directors are non-executive leaders who review dozens of committee packets under tight time constraints. Forcing them to decipher an unfiltered risk register shifts the burden of prioritization from management onto the board, creating immediate executive frustration. Second, it obscures Risk Velocity: static risk registers treat a slow-moving demographic shift identically to an acute cyber ransomware vulnerability, even though the latter can destroy hundreds of millions of dollars of enterprise market capitalization within 72 hours. Third, it severs the link between Risk and Capital: raw lists fail to explain what it costs to mitigate a threat, what residual exposure remains post-control, or what specific board decision is being requested.
An executive-grade ERM presentation ruthlessly filters the enterprise landscape down to the 'Top 10 Material Risks' that genuinely threaten strategic objectives or solvency, while categorizing remaining exposures into structured functional appendices. Every slide is anchored by a complete-sentence action headline that delivers the strategic implication before the director inspects the supporting visual exhibit.
Exhibit 1: 5x5 Enterprise Risk Matrix & Heatmap: Inherent vs. Residual Position with Velocity Vectors
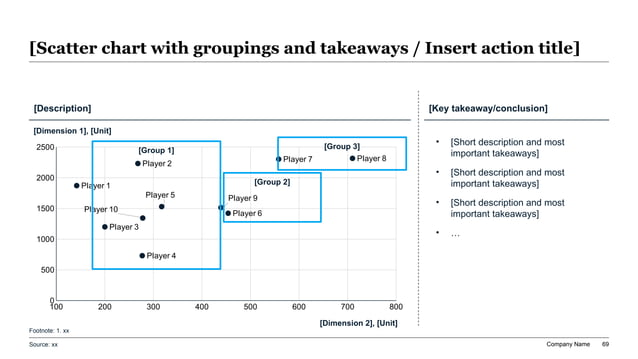
Anatomy of an Executive Risk Heatmap: Velocity, Inherent vs. Residual Exposure, and Appetite Boundaries
The visual centerpiece of any boardroom ERM presentation is the 5x5 Enterprise Risk Heatmap. However, standard corporate heatmaps are notorious for being visually confusing and intellectually static. To serve as a genuine executive decision tool, a modern risk matrix must incorporate four indispensable analytical dimensions.
Dimension 1: Dual-State Plotting (Inherent Gross vs. Residual Net Exposure). A standalone point on a heatmap is uninterpretable because the board cannot discern whether the risk is naturally low or whether massive management controls are actively keeping it suppressed. An institutional slide displays both positions: the transparent 'ghost node' representing inherent risk (the exposure assuming zero controls or complete control failure) connected via a directional dotted trajectory vector to the solid 'target node' representing residual risk (the remaining exposure after internal controls, hedging, insurance, and operational redundancies are applied). This visual delta immediately demonstrates to directors the tangible value generated by the company's compliance and risk management investments.
Dimension 2: Risk Velocity & Momentum Vectors. Risk velocity measures the speed of onset—the timeframe between the occurrence of a risk event and its first material impact on enterprise cash flow, operations, or reputation. In an executive slide, velocity is indicated by arrow styling or color-coded perimeter halos: acute risks with instantaneous onset (e.g., cyber breaches, zero-day infrastructure outages, geopolitical sanctions) are visually flagged with urgent lightning indicators, whereas chronic risks with multi-quarter gestation periods (e.g., workforce demographic aging, long-term brand preference erosion) are designated with gradual trend lines.
Dimension 3: The Board Risk Appetite Frontier. A heatmap without an explicit risk appetite boundary is merely an academic exercise. The executive slide must superimpose a prominent, bold boundary line separating the acceptable risk tolerance zone (green and amber quadrants) from the unaccepted breach zone (critical red quadrants). Any residual risk node that breaches this boundary line automatically triggers a mandatory deep-dive agenda item and executive remediation plan during the committee session.
Inherent vs. Residual Risk Rating Taxonomy: 5x5 Scoring Criteria & Dollar-Denominated Impact Thresholds
Standardizing qualitative descriptors into quantitative, board-approved financial and operational thresholds prevents subjective risk inflation across disparate business units.
| Severity Level | Financial Loss Impact | Operational Interruption | Cyber & Data Asset Compromise | Regulatory & Legal Consequence | Reputational & Market Capitalization Impact |
|---|---|---|---|---|---|
| 1 - Negligible | < $1,000,000 P&L impact | < 4 hours of non-critical system downtime; no customer impact | Isolated scanning attempt; zero exfiltration or credential compromise | Minor technical non-compliance resolved via informal notification | Zero media coverage; no perceptible impact on customer sentiment or brand equity |
| 2 - Low / Minor | $1,000,000 – $5,000,000 | 4 to 24 hours of localized operational disruption; workaround viable | Single workstation malware infection; contained by automated EDR; zero PII leak | Minor regulatory query or inspection notice; potential fine < $250k | Localized trade publication mention; zero executive or stock price impact |
| 3 - Moderate | $5,000,000 – $25,000,000 | 1 to 3 days of regional production impairment; SLA penalties triggered | Confidential internal operational data breach; no sensitive customer PII exfiltrated | Formal regulatory investigation launched; civil penalties between $1M–$5M | National business press coverage; transient negative sentiment among enterprise buyers |
| 4 - Major / Severe | $25,000,000 – $100,000,000 | 3 to 10 days of enterprise-wide operational paralysis; material customer defection | Major ransomware deployment across core ERP; customer PII exfiltrated; breach notification mandated | Consent decree, statutory sanction, or criminal indictment; fines exceeding $10M | Sustained mainstream media scrutiny; 5% to 15% temporary reduction in public share valuation |
| 5 - Catastrophic | > $100,000,000 (Solvency Threat) | > 10 days of complete core business shutdown; critical supply chain failure | Total enterprise infrastructure compromise; destruction of core IP or critical customer databases | Revocation of operating license, charter suspension, or CEO/Board personal liability enforcement | Permanent destruction of commercial brand trust; catastrophic credit rating downgrade; restructuring |
Exhibit 2: Enterprise Risk Appetite Framework (RAF): 5 Strategic Risk Dimensions
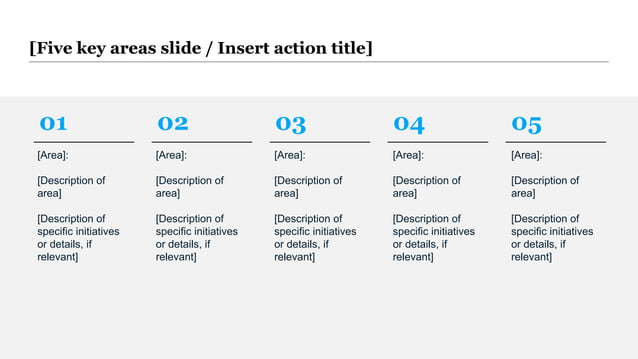
Codifying the Risk Appetite Statement (RAS): Defining Zero, Low, Moderate, and High Tolerance Thresholds
A common point of confusion among executive teams is the difference between risk capacity, risk appetite, and risk tolerance. In the board presentation, the Chief Risk Officer must clearly establish these distinctions before introducing policy adjustments. Risk Capacity represents the absolute maximum volume of loss the enterprise could endure before facing insolvency or existential distress. Risk Appetite is the amount and type of risk that the Board of Directors deliberately authorizes management to pursue in pursuit of value creation. Risk Tolerance represents the acceptable operational variance around those appetite targets before mandatory escalation is triggered.
The Risk Appetite Statement (RAS) cannot be written as a platitude like 'We maintain zero tolerance for operational failure.' In reality, zero risk tolerance across all activities would paralyze commercial growth and prevent new product launches. An institutional RAS differentiates tolerance levels across five core enterprise pillars: Strategic, Operational, Financial & Capital, Cyber & Information Security, and Compliance & Legal.
For instance, an enterprise may deliberately maintain a 'High Appetite' for strategic product innovation and calculated M&A expansion where downside exposure is bounded by deal escrow and equity investment caps. Concurrently, that exact same enterprise must enforce a 'Zero Tolerance' mandate for statutory bribery (FCPA), conscious safety violations, or deliberate financial misstatements. Clearly visualizing these appetite bands prevents executive leadership from operating under conflicting assumptions and provides frontline managers with explicit boundaries for daily risk-taking.
Enterprise Risk Appetite Matrix by Functional Domain: Appetite Mandates, Tolerance Limits, and Board Breach Triggers
A reference guide for how boards codify qualitative appetite statements into quantitative trigger points that mandate immediate executive intervention.
| Risk Pillar | Board Appetite Posture | Strategic Rationale & Business Context | Quantitative Tolerance Boundary | Automated Board Escalation Trigger |
|---|---|---|---|---|
| Strategic & Market Expansion | Moderate to High Appetite | Calculated commercial risk-taking is essential to capture market share and defend long-term competitive moat. | Maximum cumulative capital at risk across experimental ventures capped at 8% of annual EBITDA. | Single initiative capital variance exceeds $15M or market share decline exceeds 300 bps YoY. |
| Financial & Capital Liquidity | Low to Moderate Appetite | Preserve investment-grade credit ratings and ensure uninterrupted liquidity through severe macro downturns. | Minimum liquidity floor maintained at $250M committed undrawn facility + cash; Net Debt/EBITDA < 3.25x. | Committed liquidity drops below $200M or forward projected covenant headroom shrinks below 15%. |
| Operational & Supply Chain | Low Appetite | Customer delivery reliability and product quality are core brand promises; operational failure destroys enterprise customer retention. | Core tier-1 operational uptime SLA maintained at 99.95%; dual-sourcing mandated for 100% of critical manufacturing inputs. | Unscheduled production downtime exceeds 12 consecutive hours or single-source dependency exposes > 10% of revenue. |
| Cybersecurity & IT Infrastructure | Minimal / Averse Appetite | Ransomware, infrastructure disruption, or intellectual property theft poses catastrophic existential and reputational liabilities. | Zero unpatched critical (CVSS > 9.0) vulnerabilities older than 14 days; Mean Time to Contain (MTTC) cyber threats < 60 minutes. | Confirmed exfiltration of sensitive client data or uncontained ransomware event in production environments. |
| Legal, Regulatory & Ethical Conduct | Zero Tolerance | Zero tolerance for statutory illegality, anti-money laundering (AML) failures, bribery, or intentional deceptive accounting. | 100% completion of mandatory compliance certifications; zero tolerance for uninvestigated whistleblower complaints. | Receipt of formal regulatory subpoena, civil investigative demand (CID), or criminal inquiry by any enforcement agency. |
Exhibit 3: Top 5 Enterprise Risks: Deep-Dive Assessment, Leading KRIs, and Mitigation Actions
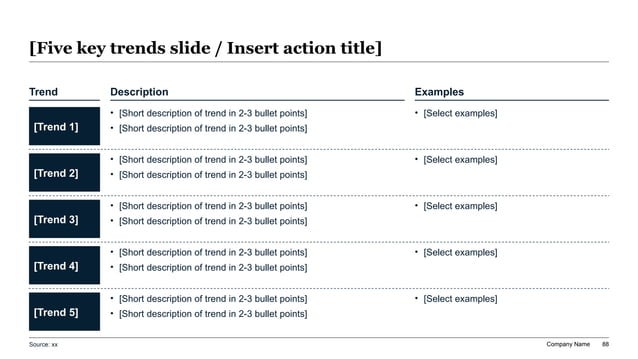
Leading vs. Lagging Indicators: Designing Early-Warning Key Risk Indicators (KRIs) that Trigger Management Intervention
A critical vulnerability in legacy ERM reporting is an over-reliance on lagging Key Performance Indicators (KPIs) rather than forward-looking Key Risk Indicators (KRIs). Presenting a historical dashboard showing that the company suffered zero compliance fines or experienced zero supply chain bottlenecks during the prior quarter provides the Board with zero insight into future operational resilience. By the time a lagging metric turns red, the loss event has already materialized.
Leading KRIs are predictive metrics that track the accumulation of underlying stress, vulnerability, or environmental shifts before they culminate in an operational failure. For example, rather than tracking 'Number of Cyber Breaches' (a lagging loss metric), a leading KRI tracks 'Percentage of Phishing Simulation Failures among High-Privilege Executives' or 'Days to Patch High-Severity Vulnerabilities Across Edge Systems.' Rather than tracking 'Customer Churn due to Product Defects' (a lagging commercial loss), a leading KRI tracks 'Unresolved High-Severity Jira Tickets in Production Beyond 48 Hours.'
In the presentation, KRIs must be structured within a strict Green-Amber-Red threshold protocol. Green indicates normal operating variance within approved risk appetite. Amber indicates an early-warning signal where operational tolerance is being tested, requiring management monitoring and workstream reporting. Red indicates an explicit breach of risk appetite that triggers a mandatory, pre-documented Management Mitigation Playbook and formal notification to the Board Risk Committee Chair.
Enterprise KRI Dashboard: Metrics, Green/Amber/Red Thresholds, Measurement Frequency, and Executive Owners
A standardized executive KRI reporting template illustrating how quantitative early-warning metrics establish operational accountability.
| Risk Domain | Leading Key Risk Indicator (KRI) | Measurement Cadence | Green (Normal) | Amber (Early Warning) | Red (Appetite Breach) | Executive Accountable Owner |
|---|---|---|---|---|---|---|
| Cybersecurity | Mean Time to Remediate (MTTR) Critical Vulnerabilities (CVSS > 8.0) | Weekly Rolling | < 7 calendar days | 7 to 14 calendar days | > 14 calendar days | Chief Information Security Officer (CISO) |
| Counterparty Credit | Percentage of Accounts Receivable with Deteriorating Credit Rating | Bi-Weekly Rolling | < 3.0% of total AR balance | 3.0% to 6.0% of total AR balance | > 6.0% of total AR balance | Treasurer & VP of Credit Risk |
| Supply Chain | Critical Component Inventory Days of Buffer Stock at Contract Manufacturers | Weekly | > 45 days of safety stock | 30 to 45 days of safety stock | < 30 days of safety stock | Chief Supply Chain Officer (CSCO) |
| Regulatory Compliance | Overdue High-Risk Internal Audit & Compliance Findings | Monthly | 0 findings past remediation SLA | 1 to 2 findings delayed < 30 days | > 2 findings delayed or any > 30 days | Chief Compliance Officer (CCO) |
| Talent & Human Capital | Key Personnel Flight Risk / Voluntary Attrition in Core Engineering & Sales | Monthly Rolling | < 8.0% annualized attrition | 8.0% to 12.0% annualized attrition | > 12.0% annualized attrition | Chief People Officer (CPO) |
| Capital & Liquidity | Projected 13-Week Cash Flow Minimum Headroom vs. Covenant Floor | Weekly Rolling | > $75M buffer above covenant | $35M to $75M buffer above covenant | < $35M buffer above covenant | Chief Financial Officer (CFO) |
Exhibit 4: Inherent vs. Residual Risk Exposure Profile & Mitigation Control Effectiveness
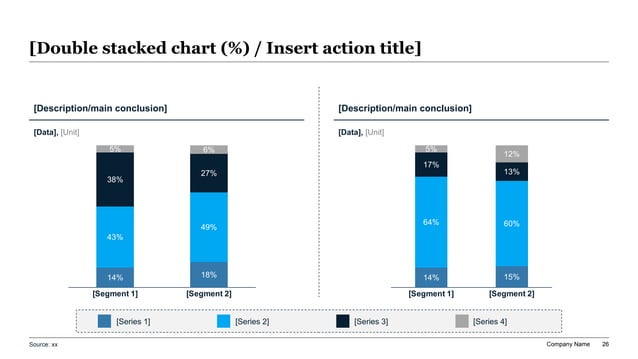
Quantified Scenario Modeling & Tail-Risk Stress Testing: Monte Carlo, Value at Risk, and Worst-Case Liquidity Buffers
Modern corporate boards are increasingly skeptical of purely qualitative heatmaps that assign arbitrary 'high, medium, low' tags to multi-million dollar business threats. Rating agencies, bank syndicates, and institutional shareholders expect corporate risk leadership to present Quantified Scenario Stress Tests and tail-risk capital adequacy models.
The presentation should structure quantitative stress testing around three rigorous methodology layers: First, Discrete Deterministic War Gaming: modeling the simultaneous occurrence of 2 to 3 correlated compounding shocks (e.g., a severe global cyber outage occurring concurrently with a 200 bps interest rate hike and a 15% revenue decline in European operations). Second, Probabilistic Value at Risk (VaR) & Monte Carlo Simulations: running 10,000 algorithmic iterations across fluctuating commodity prices, currency exchange rates, and customer demand curves to calculate the 99th percentile maximum potential quarterly cash loss (Cash-at-Risk). Third, Reverse Stress Testing: starting from the assumption that the company has suffered catastrophic financial insolvency, and working backward to identify which unprecedented combination of operational and market failures could trigger that outcome.
In the board deck, the output of these models must be summarized in a clean, executive liquidity waterfall exhibit. The slide should display the enterprise baseline liquidity, show the step-down deductions resulting from the simulated stress scenario, and prove that the remaining capital buffer exceeds debt covenant minimums and committed operational cash floors. If the stress test reveals a capital deficit under a plausible severe scenario, management must accompany the finding with an immediate capital-contingency recommendation (such as expanding revolving credit lines, purchasing tailored risk transfer insurance, or implementing emergency CapEx freezes).
Exhibit 5: Three Lines of Defense (3LoD) Governance & Board Escalation Architecture
Operationalizing the Three Lines of Defense (3LoD): Accountability, Escalation Protocols, and Board Reporting Cadence
A frequent finding in corporate post-mortems following major corporate crises is that risk warnings were identified internally but became trapped within middle-management silos. To provide directors with confidence in institutional resilience, the ERM presentation must clearly outline the enterprise Three Lines of Defense (3LoD) governance architecture and codify explicit escalation pathways.
The First Line of Defense: Operational Management & Business Unit Owners. The fundamental tenet of institutional risk management is that operational leaders own risk. Business unit presidents, product managers, and engineering heads own the risks generated by their commercial activities. They are directly accountable for designing, executing, and monitoring frontline controls. In the presentation, the CRO must emphasize that the central risk function does not relieve business units of their primary duty to operate within approved risk appetite parameters.
The Second Line of Defense: Independent Risk Management & Compliance Oversight. The Chief Risk Officer, Chief Compliance Officer, CISO, and centralized ERM team constitute the second line. Their mandate is to provide objective challenge, design standardized risk assessment methodologies, establish enterprise risk policies, and independently monitor KRI compliance. The second line possesses direct reporting access to the Board Risk Committee and maintains the authority to challenge business unit risk evaluations.
The Third Line of Defense: Independent Internal Audit. Internal Audit provides the Board Audit Committee with completely independent, objective assurance that both the first-line controls and second-line oversight mechanisms are functioning effectively as designed. Internal Audit operates with strict organizational independence from executive management.
Board Escalation Cadence & Whistleblower Protections: The deck must articulate a frictionless escalation protocol. Any event categorized as a 'Level 4 or 5' threat (material cybersecurity breach, formal regulatory subpoena, or risk appetite tolerance breach) must be formally communicated to the Board Risk Committee Chair within 24 hours, followed by an emergency executive briefing within 72 hours. Establishing this cadence protects directors from governance blind spots and ensures swift executive alignment.
The Standard 10-Slide Board Risk Committee Deck Architecture: Slide Function, Executive Question, and Core Visuals
A battle-tested 10-slide presentation blueprint optimized for quarterly 45-minute Board Risk and Audit Committee review sessions.
| Slide # | Slide Title / Focus Area | Primary Executive Question Addressed | Recommended Visual Layout & Data Exhibit |
|---|---|---|---|
| Slide 1 | Executive Summary & Risk Posture Overview | What is the overall risk posture of the enterprise, and where are acute concerns? | 3-panel executive summary: Macro Outlook, Top 3 Emerging Vulnerabilities, Board Action Asks. |
| Slide 2 | Enterprise 5x5 Heatmap & Migration Vectors | Which risks are migrating toward or breaching our board risk appetite boundary? | 5x5 scatter plot with inherent-to-residual trajectory arrows and appetite frontier line. |
| Slide 3 | Risk Appetite Statement (RAS) Compliance Scorecard | Are all operating divisions operating strictly within approved board risk tolerances? | 5-column scorecard across Strategic, Financial, Operational, Cyber, and Legal pillars. |
| Slide 4 | Top 5 Material Risks Deep-Dive (Part 1: Operational & Strategic) | What specific threats jeopardize our core operations and commercial expansion? | Structured 3-column table: Vulnerability Profile, Inherent Exposure, Mitigation Countermeasures. |
| Slide 5 | Top 5 Material Risks Deep-Dive (Part 2: Cyber, Tech & AI) | How resilient are our digital infrastructure and proprietary algorithms against catastrophic compromise? | Cyber maturity benchmark, unpatched vulnerability burn-down chart, incident MTTR trend. |
| Slide 6 | Leading Key Risk Indicator (KRI) Early-Warning Dashboard | What forward-looking indicators are signaling potential operational or credit stress? | Green/Amber/Red status table tracking 8 leading metrics with historical variance trends. |
| Slide 7 | Quantified Scenario Stress Test & Liquidity Waterfall | Can our balance sheet and liquidity reserves absorb a compounding multi-event shock? | Liquidity bridge waterfall chart showing stress deductions against debt covenant minimums. |
| Slide 8 | Regulatory, Compliance & Internal Audit Issue Tracker | Are outstanding audit deficiencies and regulatory remediation items being closed on schedule? | Horizontal milestone tracking grid categorizing open audit items by severity and days overdue. |
| Slide 9 | Three Lines of Defense Governance & Resource Adequacy | Do our risk oversight teams have sufficient staffing, budget, and tooling to maintain defense? | Governance RACI architecture paired with risk management headcount and technology budget envelope. |
| Slide 10 | Board Decision Asks & Policy Approval Requests | What specific policy updates, risk tolerance exceptions, or capital allocations must the Board approve today? | Callout box detailing 3 specific resolutions requiring formal committee vote and minuting. |
Pre-Board ERM Deck Quality Gate: 10 Tests Before Submitting to the Audit & Risk Committee
CRO Risk Narrative Checklist: Ensuring Business-Enablement and Strategic Value
Institutional Enterprise Risk Management Board Deck Prompt Recipe for XLSlides
Act as a Senior Partner in McKinsey & Company's Global Risk Practice and a Chief Risk Officer advising the Board Risk & Audit Committee of an enterprise corporation. Generate a comprehensive, 10-slide executive Enterprise Risk Management presentation formatted for boardroom review. Structure the deck following Pyramid Principle logic with action titles on every page. Include: (1) Executive Summary highlighting macro risk posture, top 3 emerging threats, and capital adequacy; (2) 5x5 Enterprise Risk Heatmap displaying both Inherent and Residual positions with velocity vectors and board appetite boundary; (3) Risk Appetite Framework (RAF) scorecard establishing quantitative tolerance limits across Strategic, Financial, Operational, Cyber, and Legal pillars; (4) Top 5 Material Risks Deep-Dive with root causes, quantified dollar exposure, and active mitigation controls; (5) Leading Key Risk Indicator (KRI) Dashboard featuring green/amber/red thresholds and executive owners; (6) Three Lines of Defense (3LoD) Governance Architecture showing operational ownership, second-line challenge, and internal audit assurance; (7) Quantified Scenario Stress Testing Liquidity Waterfall showing severe multi-variable downside impact against debt covenants; and (8) Board Action Asks detailing specific policy updates and risk tolerance approvals. Ensure tone is authoritative, mathematically grounded, and executive-ready, avoiding generic corporate platitudes or unfiltered spreadsheets.
Frequently Asked Questions: Board & Executive Enterprise Risk Management Presentations
How long should an executive ERM presentation be for a Board Risk Committee meeting?
For a formal quarterly Board Risk Committee meeting, the primary deck should be exactly 8 to 12 slides, structured for a 20-minute executive briefing followed by 25 to 30 minutes of rigorous discussion. Granular risk registers, statistical modeling methodologies, detailed compliance logs, and insurance policy schedules should be compiled in a structured appendix of 15 to 25 slides for reference during Q&A.
What is the difference between Inherent Risk and Residual Risk on an executive slide?
Inherent Risk (gross risk) represents the maximum potential financial, operational, or reputational damage that would occur in the total absence of internal management controls or hedging. Residual Risk (net risk) represents the actual remaining exposure that exists after current internal controls, automated guardrails, redundancies, and insurance policies are actively deployed. Presenting both metrics demonstrates the measurable value of management's control investments.
How should a Chief Risk Officer handle a risk appetite breach in front of the Board?
Never attempt to soften or conceal a risk appetite breach. State the breach immediately on the executive summary slide, explain the root cause and market conditions that caused the metric to exceed board-approved tolerance, quantify the potential financial downside, and present a pre-budgeted Management Remediation Plan with an aggressive timeline. Directors respect transparent accountability; they severely penalize surprises.
Why should risk severities be denominated in dollars rather than High/Medium/Low tags?
Qualitative tags like 'High' or 'Medium' mean completely different things to different executives. A $20M supply chain disruption might be considered catastrophic by a small business unit lead, but manageable by the corporate CFO. Denominating risk severities in audited dollar bands (e.g., Level 4 = $25M–$100M P&L impact) creates a common corporate currency for evaluating competing risks and allocating capital.
How often should the Board Risk Committee receive formal ERM presentations?
The Board Risk Committee (or combined Audit & Risk Committee) should receive a comprehensive ERM presentation quarterly. In addition, the Board should receive an annual strategic ERM workshop dedicated to multi-year scenario planning and refreshing the Risk Appetite Statement. Finally, any acute Level 5 event triggers immediate 24-hour notification protocols outside the regular quarterly schedule.
How does XLSlides help risk teams build boardroom-ready presentations?
XLSlides automates the transition from messy spreadsheets to executive-ready presentations. While generic AI slide tools produce childish clip art and superficial bullet lists, XLSlides generates consultant-grade PowerPoint presentations featuring MECE narrative structure, full-sentence action titles, decision-ready 5x5 matrix tables, and clear governance hierarchies that satisfy the rigorous expectations of corporate boards and rating agencies.
Build Board-Ready Enterprise Risk Presentations with XLSlides
Convert complex risk registers, 5x5 heatmaps, and Risk Appetite Statements into clean, consultant-grade presentations. XLSlides generates editable, structured PowerPoint decks with executive action titles, MECE logic, and decision clarity.
Methodology And Sources
- COSO Enterprise Risk Management: Integrating with Strategy and Performance(Committee of Sponsoring Organizations of the Treadway Commission (COSO))
- ISO 31000:2018 Risk Management — Guidelines(International Organization for Standardization (ISO))
- NACD Blue Ribbon Commission Report on Risk Governance: Balancing Risk and Reward(National Association of Corporate Directors (NACD))
- Principles for the Sound Management of Operational Risk(Basel Committee on Banking Supervision (BCBS))
- Transforming Enterprise Risk Management for Resilience and Value Creation(McKinsey & Company Risk & Resilience Practice)