The Boardroom Cybersecurity Mandate: Translating Technical Vulnerabilities into Fiduciary Risk
Cybersecurity has irreversibly crossed the threshold from an operational IT trouble ticket into a core fiduciary responsibility for the Board of Directors, Audit Committees, and Executive Leadership Teams. Historically, Chief Information Security Officers (CISOs) entered boardrooms once a year to deliver dense slide decks laden with technical esoterica—firewall block statistics, patch percentages, signature counts, and CVE vulnerability databases. The inevitable result was cognitive fatigue, glazed director eyes, and a fundamental disconnect between security expenditure and corporate value preservation.
In the current regulatory and threat environment, this technical presentation paradigm is not merely ineffective; it represents an active governance liability. Regulatory mandates worldwide—most notably the U.S. Securities and Exchange Commission (SEC) Item 106 of Regulation S-K, the European Union's Digital Operational Resilience Act (DORA), and the NIS2 Directive—now legally codify board-level oversight of cybersecurity risk management, strategy, and governance. Board members are personally liable for failing to exercise informed oversight over material cyber risks that threaten shareholder equity, operational continuity, and customer trust.
To satisfy this heightened fiduciary bar, the modern CISO must operate as an enterprise risk executive and strategic business partner. Directors are not software engineers or cryptographers; they are former CEOs, institutional investors, audit partners, and legal counselors whose primary responsibility is capital allocation, governance, and enterprise risk oversight. When communicating with the board, every security finding, architectural transformation, and capital request must be anchored to three fundamental business questions: (1) What is our probable financial, legal, and operational loss exposure under realistic threat scenarios? (2) Are management and security teams deploying corporate resources efficiently to reduce risk to within Board-approved tolerance? and (3) In the event of a catastrophic breach, can the enterprise sustain core revenue-generating operations and recover within acceptable downtime boundaries?
This guide provides the definitive, consultant-grade blueprint for constructing and delivering institutional cybersecurity board presentations. Drawing on best practices from McKinsey, Gartner, the FAIR Institute, NIST CSF 2.0, and Fortune 100 CISOs, we delineate the exact narrative architecture, visual layouts, quantitative risk models, operational resilience metrics, and regulatory escalation frameworks necessary to command executive respect, secure necessary capital budgets, and establish ironclad governance accountability.
The CISO Board Presentation Anti-Pattern vs. Institutional Standard: Technical Metrics vs. Business Risk
A structured comparative evaluation contrasting the engineering-centric reporting mistakes that alienate directors with the executive decision-grade standards demanded by modern corporate boards.
| Presentation Dimension | The Technical CISO Anti-Pattern (What Glazes Eyes) | The Institutional Board Standard (What Drives Decisions) | Executive Boardroom Impact |
|---|---|---|---|
| Operational Telemetry & Vulnerabilities | Listing total raw vulnerability counts, open CVE tickets, and firewall port scanning attempts without context. | Reporting Tier-0 Crown Jewel patch velocity, Mean Time to Detect (MTTD), Mean Time to Remediate (MTTR), and SLA compliance. | Shifts conversation from overwhelming IT operational noise to verifiable defensive speed and critical asset protection. |
| Risk Exposure & Quantification | Subjective qualitative 3x3 heatmaps (High/Medium/Low red-yellow-green dots) based on intuitive team sentiment. | Open FAIR quantitative financial modeling displaying dollar-denominated Loss Exceedance Curves and Probable Maximum Loss (PML). | Enables the Audit Committee and CFO to evaluate cyber exposure directly against balance sheet cash reserves and insurance retention limits. |
| Defensive Maturity Benchmarking | Presenting an exhaustive 400-row spreadsheet checklist of SOC 2 or ISO controls with pass/fail checkmarks. | NIST CSF 2.0 capability maturity scores (Current vs. 12-Month Target State) benchmarked against peer industry quartiles. | Provides an authoritative, objective framework proving multi-year capability trajectory and highlighting targeted resource gaps. |
| Threat Landscape Context | Academic deep-dives into exotic malware reverse engineering, obfuscation techniques, and MITRE ATT&CK sub-techniques. | Threat actor economic intent, sector-specific targeting vectors, ransomware business disruption days, and supply chain blast radius. | Connects abstract threat actors to realistic enterprise disruption scenarios and supply chain vulnerabilities. |
| Incident Escalation & Materiality | Detailed forensic chronological log dumps of past minor alerts, spam phishing emails, and routine endpoint blocks. | SEC Item 106 4-day materiality assessment framework, cross-functional escalation triggers, and crisis tabletop outcomes. | Assures directors that statutory disclosure deadlines and executive escalation protocols are rigorously codified. |
| Budget Justification & Asks | Requesting budget for specific vendor point-solution tools, licensing tiers, and IT headcount without quantified ROI. | Marginal Risk Reduction per dollar invested, cyber insurance premium/deductible trade-offs, and TCO portfolio consolidation. | Frames cybersecurity spending not as an uncontrollable overhead cost, but as an economically rational capital allocation. |
Executive Summary: What Directors Actually Demand from the CISO
- Executive Translation Over Technical Jargon: The Board does not require a primer on packet inspection, zero-day vulnerabilities, or cryptographic hashes; directors demand an authoritative, business-grounded assessment of enterprise exposure, operational resilience, and regulatory compliance.
- Dollar-Denominated Cyber Risk Quantification: Replace subjective qualitative color-coded heatmaps with Open FAIR probabilistic models that calculate annual Probable Maximum Loss (PML) and Value at Risk (VaR) in concrete currency values.
- Anchor Strategic Capability to NIST CSF 2.0: Structure the strategic multi-year defense roadmap around the 6 core NIST CSF functions (Govern, Identify, Protect, Detect, Respond, Recover), highlighting the vital role of organizational governance.
- Lead with Operational Velocity (MTTD & MTTR): Focus operational reporting on time-to-contain metrics rather than vanity alert volumes, demonstrating how defensive controls minimize adversary dwell time and bound financial damage.
- Codify Clear Materiality & SEC Item 106 Escalation: Establish formal, multi-disciplinary materiality determination protocols (CISO, CFO, General Counsel, Head of IR) to ensure compliance with the SEC's stringent 4-business-day Form 8-K disclosure requirement.
- Enforce Rigorous Third-Party & Supply Chain Oversight: Over 60% of catastrophic enterprise breaches stem from third-party software or service dependencies; report tiered vendor risk assessments, continuous monitoring, and right-to-audit compliance.
- Justify Capital Through Marginal Risk Reduction: Present proposed security investments alongside explicit risk-reduction deltas, cyber insurance coverage optimization, and vendor consolidation efficiencies.
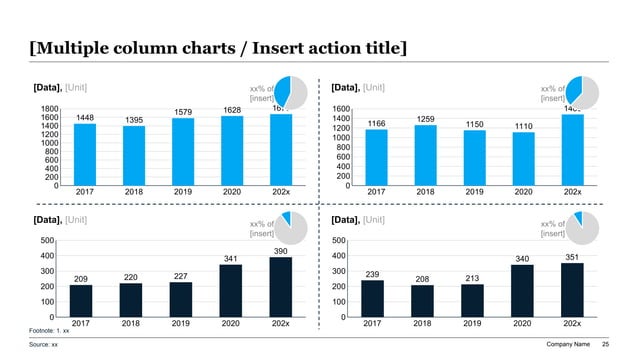
Exhibit 1: CISO Executive Security Operations Dashboard: MTTD, MTTR, Critical Vulnerability Burndown, and Budget Allocation
Operational Resilience Metrics: Moving from CVE Volume to MTTD, MTTR, and Patch Velocity
A primary failing of technical security leaders is presenting vanity metrics that provide zero actionable insight to directors. Informing a board that the security operations center (SOC) 'blocked 45 million firewall probes this quarter' or 'quarantined 12,000 phishing emails' sounds impressive to the uninitiated, but to an experienced board member, it simply describes table-stakes background noise. It does not answer whether the company is actually secure, whether malicious actors are currently dwelling undetected within the enterprise network, or whether critical revenue systems are fortified.
Operational reporting in an executive board deck must center on operational resilience—specifically the speed, precision, and velocity with which the organization detects anomalies, isolates compromised assets, and eradicates threats. The gold standard framework for operational resilience metrics focuses on three core pillars: Detection Velocity, Containment Velocity, and Exposure Burndown.
1. Mean Time to Detect (MTTD): Industry benchmarks established by elite incident response firms (e.g., CrowdStrike, Mandiant) indicate that sophisticated adversaries can execute lateral privilege escalation and reach domain dominance within 84 minutes of initial access ('breakout time'). Board decks should present quarterly MTTD trendlines against the target threshold of less than 2 hours for high-severity alerts. Any spike in MTTD must be accompanied by an executive explanation—such as visibility blind spots in recently acquired business units, unmanaged cloud workloads, or SOC analyst alert fatigue.
2. Mean Time to Remediate (MTTR) / Time to Contain: Once a compromise is detected, how rapidly can automated endpoint detection and response (EDR) agents or human incident responders isolate the compromised host, revoke privileged credentials, and block command-and-control (C2) communication channels? High-performing enterprises aim for an MTTR under 4 hours for Tier-0 critical infrastructure. Demonstrating a quarter-over-quarter downward trend in MTTR proves to the board that past investments in automation, SOAR playbooks, and endpoint instrumentation are yielding tangible operational velocity.
3. Critical Vulnerability Patch Velocity on Tier-0 Systems: Rather than reporting overall vulnerability numbers across 50,000 laptops and printers, isolate Tier-0 'Crown Jewel' assets—core ERP databases, active directory domain controllers, payment gateways, and proprietary code repositories. Present SLA adherence for remediating Known Exploited Vulnerabilities (KEVs cataloged by CISA): e.g., '100% of CISA KEV vulnerabilities patched within 14 days of release across production systems.' This demonstrates disciplined hygiene where it matters most to enterprise survival.
Core Cybersecurity Board Metrics: Target Baselines, Red-Flag Triggers, and Business Impact
An executive metric scorecard establishing defensible target baselines, committee escalation triggers, and fiduciary business rationale across the core security disciplines.
| Security Metric Domain | Key Metric Name | Institutional Target Baseline | Board Red-Flag Trigger | Executive Business Justification |
|---|---|---|---|---|
| Incident Detection | Mean Time to Detect (MTTD) | < 2 hours for critical alerts (< 24h estate-wide) | > 72 hours or detection via external third-party | Bounds adversary dwell time prior to data exfiltration or ransomware encryption payloads. |
| Incident Containment | Mean Time to Remediate (MTTR) | < 4 hours from alert triage to isolation | > 24 hours for privileged host compromise | Directly limits operational business interruption and minimizes customer record exposure volume. |
| Vulnerability Hygiene | Tier-0 Critical KEV Patch SLA | 100% remediated or mitigated within 14 days | > 30 days outstanding on internet-facing systems | Closes weaponized exploit vectors actively utilized by automated botnets and ransomware syndicates. |
| Identity Governance | Phishing-Resistant MFA Coverage | 100% workforce, contractors, & service accounts | Any administrative portal lacking FIDO2/MFA | Neutralizes 98% of credential stuffing, session hijacking, and social engineering attack surfaces. |
| Third-Party Supply Chain | Tier-1 Critical Vendor Security Audit | 100% assessed annually with verified SOC 2 / ISO | Critical vendor with unaddressed high finding > 60d | Shields enterprise from downstream software supply chain breaches (e.g. MOVEit, SolarWinds). |
| Disaster Recovery | Immutable Backup Restoration Time | Full critical service restoration verified < 48h | Recovery untested in > 6m or RTO > 5 business days | Guarantees business survival and eliminates extortion leverage during major ransomware incidents. |
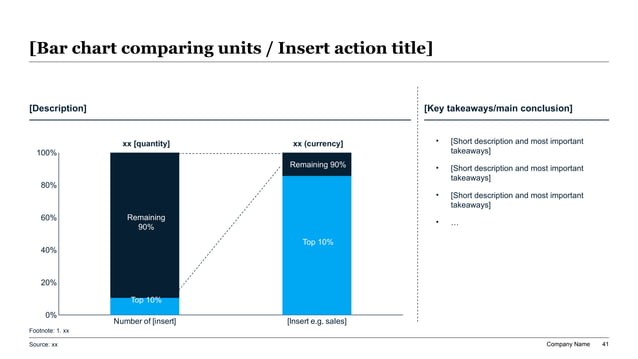
Exhibit 2: Threat Surface & Loss Exposure Pareto Analysis: 80% of Enterprise Risk Driven by Top 20% Vulnerabilities
Pre-Board Cyber Risk Quantification Checklist: 8 Tests for Defensible Dollar-Denominated Loss Estimates
FAIR Model & Cyber Risk Financial Quantification: Loss Exceedance and Probable Maximum Loss
For decades, the standard artifact for communicating risk to boards was the qualitative 5x5 heatmap, plotting 'Likelihood' against 'Impact' with subjective color coding. A board member was told that ransomware was 'High Likelihood, High Impact (Red),' while insider data theft was 'Medium Likelihood, High Impact (Yellow).' In practice, this framework is deeply flawed. What one executive considers 'High Impact' ($5M) another considers minor operating noise ($50M). Color-coded heatmaps obscure underlying mathematical reality, prevent accurate cost-benefit trade-offs, and make it impossible for boards to determine whether insurance policies and security budgets are correctly calibrated.
Leading CISOs and forward-thinking Audit Committees have adopted Open FAIR (Factor Analysis of Information Risk)—the only international standard quantitative model for information security risk. FAIR decomposes risk into two mathematically rigorous components: Threat Event Frequency (TEF) and Loss Magnitude (LM), evaluated across thousands of Monte Carlo simulation runs.
Loss Magnitude is systematically divided into Primary Loss (costs directly incurred by the organization to resolve the incident, such as incident response retainers, hardware replacement, employee overtime, and lost operational productivity) and Secondary Loss (costs imposed by external stakeholders, including regulatory fines, class-action litigation, credit monitoring services, customer churn, and increased borrowing costs).
When presented to the board, FAIR outputs are summarized into a Loss Exceedance Curve and Probable Maximum Loss (PML) table. For example, the CISO can state: 'Our probabilistic modeling indicates a 10% annual probability of experiencing a cyber loss exceeding $32M, and a 1% annual tail-risk probability of exceeding $78M. Our current cyber insurance coverage provides $25M in protection with a $1M retention deductible. Therefore, management recommends allocating $2.2M to implement Zero Trust micro-segmentation, which will compress our 90th percentile PML from $78M to $41M, delivering an annual expected loss reduction of $8.4M.' This language transforms the CISO from a technical alarmist into a sophisticated risk manager speaking the native language of the boardroom.
Evaluating the Threat Landscape: Geopolitics, Nation-State Actors, and Advanced Persistent Threats
Board members read mainstream business news and frequently arrive at committee meetings with heightened anxieties regarding nation-state cyber warfare, geopolitical espionage, and state-sponsored ransomware cartels. The CISO's role is not to stoke hysteria, but to provide calm, analytical perspective that separates sensationalized headlines from the specific threat vectors facing the company's industry, geographic footprint, and digital architecture.
An effective threat landscape presentation categorizes external adversaries into distinct threat actor archetypes, evaluating their motivation, targeting intent, and capabilities: (1) Financially Motivated Cybercrime Syndicates: Operating as sophisticated business enterprises with division of labor, initial access brokers, and ransomware-as-a-service (RaaS) affiliates seeking extortion payouts; (2) Nation-State Advanced Persistent Threats (APTs): Sponsoring targeted espionage to exfiltrate proprietary intellectual property, strategic M&A intelligence, or state secrets, with patience and deep resources; (3) Hacktivist & Ideological Actors: Conducting disruptive distributed denial-of-service (DDoS) campaigns, website defacements, or reputational data dumps driven by political or social agendas; and (4) Malicious or Negligent Insiders: Authorized users abusing privileged credentials or bypassing security protocols out of frustration or financial incentive.
Crucially, the CISO must articulate the modern 'Assume Breach' security posture. Directors must understand that determined nation-state adversaries or sophisticated ransomware syndicates cannot be 100% prevented from gaining an initial foothold through phishing, zero-day vulnerabilities, or compromised third-party credentials. What distinguishes resilient enterprises from catastrophic breach victims is defense-in-depth: network micro-segmentation that blocks lateral movement, strict least-privilege identity access management, immutable offline backup architectures, and automated endpoint containment.
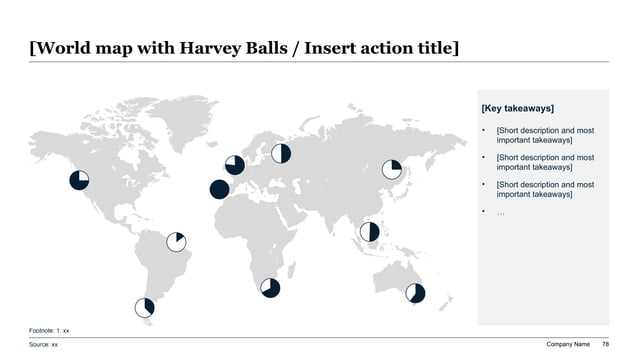
Exhibit 3: Global Threat Landscape & Third-Party Supply Chain Risk Heatmap
Third-Party Vendor Risk & Cloud Dependency: Managing Downstream Software Supply Chain Exposure
In modern cloud-native enterprises, the traditional corporate network perimeter has effectively dissolved into a complex web of SaaS platforms, cloud hyperscalers, external managed service providers (MSPs), and third-party software dependencies. Industry data consistently reveals that over 60% of significant data breaches originate not from vulnerabilities within the victim company's own infrastructure, but via compromise of an external vendor with authorized interconnectivity or shared data access.
Directors are acutely aware of high-profile supply chain catastrophes—such as the MOVEit Transfer vulnerability, the SolarWinds Orion supply chain compromise, and breaches of payroll and benefits processors. Presenting a credible cybersecurity posture requires demonstrating rigorous, continuous oversight over the third-party ecosystem rather than relying on obsolete annual paper questionnaires.
A mature Third-Party Risk Management (TPRM) board reporting framework categorizes vendors into distinct criticality tiers based on data sensitivity and system connectivity. Tier-1 vendors (those with direct access to customer PII, corporate bank accounts, or production code environments) are subjected to mandatory independent security attestations (SOC 2 Type II, ISO 27001), continuous automated external vulnerability monitoring, contractual right-to-audit clauses, and strict 24-hour breach notification SLAs.
Furthermore, the board presentation must address fourth-party concentration risk: the realization that hundreds of seemingly distinct SaaS vendors all run on the same underlying cloud infrastructure (AWS, Microsoft Azure, Google Cloud) or rely on identical third-party authentication services (e.g., Okta). The CISO should outline failover plans, data escrow arrangements, and egress procedures that ensure business continuity even if a key Tier-1 software vendor experiences an catastrophic multi-day outage.
Tiered Vendor Cybersecurity Risk Architecture: Assessment Cadence, Required Attestations, and Breach Containment
A structured governance framework categorizing external third-party suppliers, mandatory security attestations, contractual covenants, and continuous oversight protocols.
| Vendor Risk Tier | Data / System Access Profile | Assessment & Review Cadence | Mandatory Security Attestations | Contractual Security Requirements |
|---|---|---|---|---|
| Tier 1: Mission-Critical | Direct read/write access to customer PII/NPI, production core infrastructure, or financial transaction processing. | Continuous automated rating + Annual deep-dive audit + Penetration test verification. | SOC 2 Type II (all 5 Trust Principles), ISO 27001, FedRAMP or PCI-DSS Level 1. | Mandatory 24-hour breach notification SLA, minimum $10M cyber insurance, explicit indemnification, contractual right to audit. |
| Tier 2: Operational Business | Access to internal confidential business data, employee HR records, or non-production code repositories. | Annual questionnaire reassessment + Semi-annual automated external vulnerability scan. | SOC 2 Type II (Security & Confidentiality) or ISO 27001 certification. | Mandatory 48-hour breach notification SLA, minimum $5M cyber insurance, end-to-end data encryption in transit and at rest. |
| Tier 3: Commodity / Low Risk | No access to corporate networks, customer data, or sensitive corporate intellectual property. | Initial onboarding assessment + Biennial review. | Standard security questionnaire (SIG Lite / CAIQ) or verified public security whitepaper. | Standard commercial terms, data disposal certification upon contract termination, zero corporate network access permitted. |
| Tier 4: Software / Open Source | Embedded third-party libraries, SDKs, and open-source packages integrated into proprietary software products. | Continuous automated Software Bill of Materials (SBOM) scanning in CI/CD pipeline. | Zero high/critical CVE vulnerability tolerance prior to production deployment. | Automated dependency pinning, SCA vulnerability scanning, automated license compliance enforcement. |
Exhibit 4: NIST CSF 2.0 Core Function Maturity Matrix: Baseline vs. Target State vs. Residual Gap
Benchmarking Defense Posture: NIST CSF 2.0, ISO 27001, and Maturity Gap Remediation
A perennial frustration for corporate directors is the inability to gauge whether the company's cybersecurity capabilities are advancing over time or lagging behind industry standards. To provide an objective, defensible standard, executive board decks should anchor organizational posture to the National Institute of Standards and Technology Cybersecurity Framework (NIST CSF 2.0)—the globally recognized gold standard for managing cyber risks.
NIST CSF 2.0 introduces a vital structural evolution from previous editions: the establishment of 'GOVERN' (GV) as a foundational sixth core function alongside Identify (ID), Protect (PR), Detect (DE), Respond (RS), and Recover (RC). The Govern function places cybersecurity strategy, organizational context, supply chain risk management, and board oversight at the center of the framework. For directors, this makes NIST CSF 2.0 the natural language of executive governance.
In board presentations, maturity should be evaluated using standard CMMI (Capability Maturity Model Integration) tiers: Tier 1 (Partial/Ad-hoc), Tier 2 (Risk-Informed), Tier 3 (Repeatable/Documented), and Tier 4 (Adaptive/Predictive). Rather than presenting exhaustive sub-category detail, summarize each of the 6 core functions with current baseline maturity, target maturity (typically 12 to 24 months out), and the specific funded initiatives required to bridge residual gaps.
Furthermore, boards demand competitive context. Present third-party industry benchmark comparisons (e.g., peer quartile rankings across financial services, healthcare, or SaaS) derived from independent external assessments or security rating agencies. Demonstrating that the company operates in the top quartile for 'Govern' and 'Protect'—while transparently highlighting a gap in 'Recover' that is currently being addressed by the disaster recovery roadmap—builds immense director confidence in executive leadership.
Exhibit 5: SEC Item 106 & Regulatory Cyber Incident Escalation Protocol: 5-Stage Governance Sequence
The 10-Slide Standard Cybersecurity Board Deck Blueprint: Narrative Arc, Slide Content, and Decision Asks
An executive-tested slide architecture designed for a 20-to-30-minute board presentation, establishing clear logical flow from strategic context to fiduciary decisions.
| Slide # | Slide Title / Function | Key Executive Question Answered | Core Visual Asset / Chart Format | CISO Talking Points & Board Takeaway |
|---|---|---|---|---|
| Slide 1 | Executive Summary & State of Cyber Resilience | What is our overall cyber risk posture, and are our core business operations protected? | High-level 3-card summary with key risk status indicators | Delivers an authoritative, definitive assessment of current health; avoids panic and false complacency. |
| Slide 2 | Threat Landscape & Strategic Risk Context | What external adversaries and emerging threats target our specific industry sector? | Industry threat landscape graphic with actor motivation callouts | Connects geopolitical and industry attack trends directly to the company's operating profile. |
| Slide 3 | CISO Security Operations Dashboard | How efficiently are our defensive detection and remediation controls operating? | 4-Quadrant metric dashboard (MTTD, MTTR, patch SLA, budget mix) | Demonstrates operational excellence through downward trendlines in dwell time and containment velocity. |
| Slide 4 | FAIR Cyber Risk Quantification & Loss Exceedance | What is our quantified dollar loss exposure in a catastrophic breach scenario? | Loss exceedance curve & Value at Risk (VaR) distribution table | Connects cyber threats directly to corporate balance sheet cash reserves and EBITDA sensitivity. |
| Slide 5 | NIST CSF 2.0 Maturity Benchmark | Where are our defensive strengths, and where do critical capability gaps remain? | 6-function maturity scorecard comparing current vs. target state | Demonstrates disciplined capability progression against national standards and peer quartiles. |
| Slide 6 | Crown Jewel Protection & Zero Trust Progress | Are our highest-value intellectual property and revenue engines ring-fenced? | Architectural schematic showing micro-segmentation and MFA gates | Confirms Tier-0 asset isolation and verifies that lateral movement vectors are neutralized. |
| Slide 7 | Third-Party Supply Chain & Cloud Risk Profile | What vulnerabilities do our SaaS vendors, suppliers, and partners introduce? | Global vendor risk heatmap with Tier-1 criticality rankings | Proves proactive governance over third-party suppliers, contractual SLAs, and fourth-party dependencies. |
| Slide 8 | Incident Response Readiness & Tabletop Results | If breached tomorrow, how rapidly can we contain damage and resume operations? | Tabletop crisis simulation timeline and recovery test findings | Highlights realistic crisis rehearsal results, executive muscle memory, and remediation actions. |
| Slide 9 | Regulatory Compliance & Materiality Governance | Are we prepared to meet SEC 4-day disclosure and regulatory reporting rules? | 5-stage incident escalation workflow with cross-functional governance | Confirms cross-functional alignment between CISO, General Counsel, CFO, and IR on materiality triggers. |
| Slide 10 | Strategic Investment Priorities & Board Decisions | What capital investments and policy approvals does management require today? | Investment vs. Risk Reduction ROI waterfall and explicit board vote requests | Frames capital asks around measurable risk-reduction ROI, enabling decisive board action. |
CISO Board Readiness Checklist: 10 Fiduciary Sanity Checks Before Entering the Boardroom
Institutional Cybersecurity Board Presentation Prompt Recipe for XLSlides
Act as a seasoned Chief Information Security Officer (CISO) and elite management consulting partner (McKinsey, Bain, BCG). Generate a comprehensive, 10-slide executive cybersecurity presentation for the Board of Directors and Audit Committee. Key Guidelines: 1. Executive Tone: Write with strategic clarity, professional authority, and absolute absence of technical jargon. Focus on fiduciary risk, business continuity, regulatory compliance, and capital efficiency. 2. Structure & Flow: Follow the standard 10-slide executive arc: - Slide 1: Executive Summary & State of Cyber Resilience (3-card high-level risk overview) - Slide 2: Threat Landscape & Strategic Risk Context (Adversary archetypes, industry targeting) - Slide 3: Security Operations Dashboard (MTTD, MTTR, Tier-0 patch SLA, budget allocation) - Slide 4: FAIR Cyber Risk Quantification (Loss Exceedance Curve, Probable Maximum Loss, Value at Risk) - Slide 5: NIST CSF 2.0 Maturity Scorecard (Govern, Identify, Protect, Detect, Respond, Recover) - Slide 6: Crown Jewel Protection & Zero Trust Architecture (Micro-segmentation, identity hygiene) - Slide 7: Third-Party Supply Chain & Cloud Risk (Vendor tiering, concentration risk, continuous monitoring) - Slide 8: Incident Response Readiness & Tabletop Results (Crisis simulation findings, recovery RTO) - Slide 9: Regulatory Governance & SEC Item 106 Escalation (Materiality committee, 4-day disclosure) - Slide 10: Strategic Investment Priorities & Board Decisions (Capital asks tied to marginal risk reduction) 3. Quantitative Grounding: Include realistic enterprise metrics: MTTD (<2h), MTTR (<4h), Tier-0 patch SLA (14d), FAIR PML ($35M median, $80M tail-risk), cyber insurance ($25M policy with $1M retention), and concrete capital budget requests ($1.8M). 4. Slide Design: Use structured executive card panels, clean data tables, Harvey ball matrices, and clear bold takeaways. Ensure every slide features a bold action headline summarizing the executive conclusion.
Frequently Asked Questions: Cybersecurity Board Presentations & CISO Governance
How frequently should the CISO present to the Board of Directors vs. the Audit Committee?
In best-practice corporate governance, the CISO conducts deep-dive technical and operational reviews with the Audit Committee or dedicated Technology/Cybersecurity Committee on a quarterly basis (every 90 days). In contrast, the CISO presents to the full Board of Directors semi-annually or annually, focusing exclusively on strategic cyber posture, multi-year maturity trajectory, enterprise financial loss exposure, and macro regulatory compliance.
How should a CISO answer the classic director question: 'Are we secure?'
Never answer with a simple 'Yes' or 'No.' Answering 'Yes' creates false complacency and exposes the CISO to catastrophic liability if an incident occurs. Answering 'No' induces panic and questions leadership competence. The executive response is: 'Cybersecurity is not a binary state of being secure or insecure; it is a continuous discipline of risk management and operational resilience. We have implemented robust defense-in-depth controls around our Crown Jewel systems that align with top-quartile industry benchmarks, and our operational incident response readiness ensures we can detect, contain, and recover from realistic adversary attacks within acceptable business downtime thresholds.'
What are the most common mistakes security executives make in the boardroom?
The three most fatal mistakes are: (1) Technical Jargon: Explaining low-level networking concepts, port scans, and CVE acronyms that disengage non-technical directors; (2) FUD (Fear, Uncertainty, and Doubt): Stoking alarmist headlines without providing balanced, constructive management solutions; and (3) Lack of Financial Context: Presenting qualitative color-coded heatmaps that fail to quantify risk in dollars or connect proposed budgets to measurable risk reduction.
How does SEC Item 106 impact board slide decks and record-keeping?
SEC Item 106 mandates explicit disclosure of board cybersecurity oversight processes in annual Form 10-K filings. Consequently, board presentation materials, committee minutes, and CISO briefings are scrutinized by auditors, regulators, and litigation discovery. Presentations must maintain complete factual integrity, avoid misleading claims of '100% protection,' clearly document identified risks and remediation plans, and demonstrate that the board is actively engaged in regular, informed oversight.
How should a CISO justify a cybersecurity budget increase to a cost-conscious board?
Frame the budget request through Marginal Risk Reduction and Total Cost of Ownership (TCO). Rather than requesting budget for individual tools, present a business case showing how the investment shifts the organization's Loss Exceedance Curve: e.g., 'Investing $1.5M in privileged access management reduces our annual expected loss by $6.2M and qualifies the enterprise for a 15% reduction in cyber insurance premiums.' Additionally, highlight cost savings achieved through vendor consolidation.
What role should cyber insurance play in a board cybersecurity presentation?
Cyber insurance must be positioned as a financial backstop, not a primary defensive control. Directors must understand that insurance policies contain strict warranty covenants (e.g., mandatory MFA enforcement across all systems), substantial deductibles, and significant exclusions (such as state-sponsored war exclusions). The CISO should present cyber insurance alongside the FAIR risk model, demonstrating where commercial policy limits cover probable loss and where balance sheet capital reserves must absorb residual risk.
Build Board-Ready Cybersecurity Presentations with XLSlides
Translate complex security telemetry, NIST CSF maturity, and FAIR risk quantification into executive decision decks that survive boardroom scrutiny. Generate editable, beautifully formatted slides in seconds.
Methodology And Sources
- NIST Cybersecurity Framework (CSF 2.0) Reference Tool and Core Functions(National Institute of Standards and Technology (NIST), U.S. Department of Commerce)
- SEC Final Rule on Cybersecurity Risk Management, Strategy, Governance, and Incident Disclosure by Public Companies (Release No. 33-11216)(U.S. Securities and Exchange Commission (SEC))
- The Factor Analysis of Information Risk (FAIR) Standard for Cyber Risk Quantification(The Open Group & FAIR Institute)
- NACD Director's Handbook on Cyber-Risk Oversight(National Association of Corporate Directors (NACD) & Internet Security Alliance (ISA))
- Cybersecurity at a Crossroads: The CISO Guide to Board Engagement and Fiduciary Risk Reporting(Gartner for Security & Risk Management Leaders)