The Executive FP&A Mandate: Transitioning from Spreadsheet Bookkeeping to Strategic Value Architecture
The Pre-Executive Committee FP&A Forecast Integrity & Reconciliation Gate (10 Mandatory Data Audits)
Simulate & Prototype: Corporate FP&A Presentation Guide: Executive Board Decks, Rolling Forecasts, and Driver-Based Variance Modeling
Drag to draw custom components, test consulting layout presets, and preview presentation architecture live before generating with AI.
Executive Summary & Core Strategic Takeaways for CFOs, FP&A Leaders & Operating Committees
Driver-Based Planning & 3-Statement Integration: Connecting Operational Levers to Cash Realization
Table 1: Corporate Financial Modeling Archetypes: Static Budgeting vs. Driver-Based Forecasting vs. Rolling Horizons
A structured comparative evaluation of core financial planning frameworks used across corporate enterprises, analyzing operational flexibility, computational overhead, and executive decision-making agility.
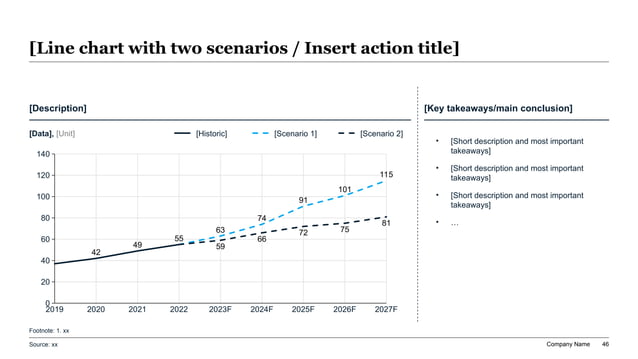
Exhibit 1: Multi-Scenario Financial Forecast: Base Case vs. Downside Stagflation vs. Accelerated Investment Trajectory
Deconstructing the Operating Variance: Isolating Price, Volume, Mix, and Cost Inflation Drivers
Table 2: Variance Root-Cause Decomposition Matrix: Reconciling Budgeted vs. Actual EBITDA Variances
An institutional matrix defining mathematical variance formulas, operational root-cause drivers, organizational accountability, and executive remedy protocols for corporate financial reviews.
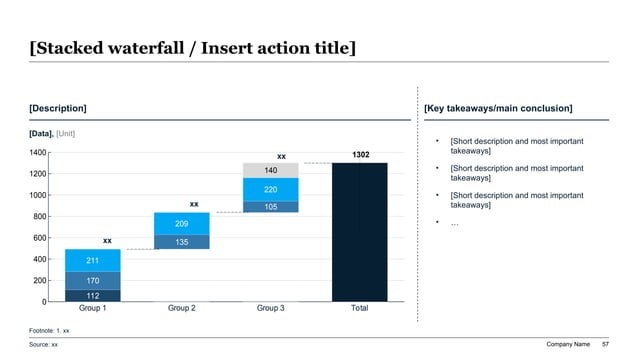
Exhibit 2: Operating EBITDA Variance Waterfall Bridge: Volume, Price Realization, Cost-Out, and Overhead Growth
The 12-to-18 Month Rolling Forecast Architecture: Breaking Free from the Fiscal Year Calendar Trap
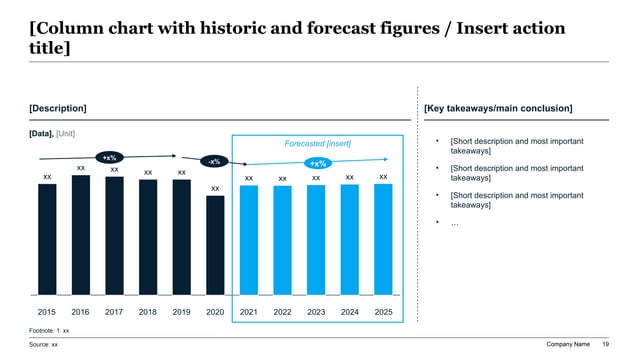
Exhibit 3: Multi-Year Rolling Revenue & Margin Forecast: Baseline Trajectory with Phase-Gated Growth Levers
Capital Allocation & Hurdle Rate Governance: Balancing Organic Reinvestment, M&A, and Balance Sheet Solvency
Table 3: Scenario Stress-Testing & Breakeven Sensitivity Matrix: Modeling Macro Shocks on Covenant Headroom
A quantitative corporate finance stress-testing matrix evaluating the resilience of enterprise EBITDA, senior debt covenant headroom, and liquidity runway under severe macroeconomic and operational shocks.
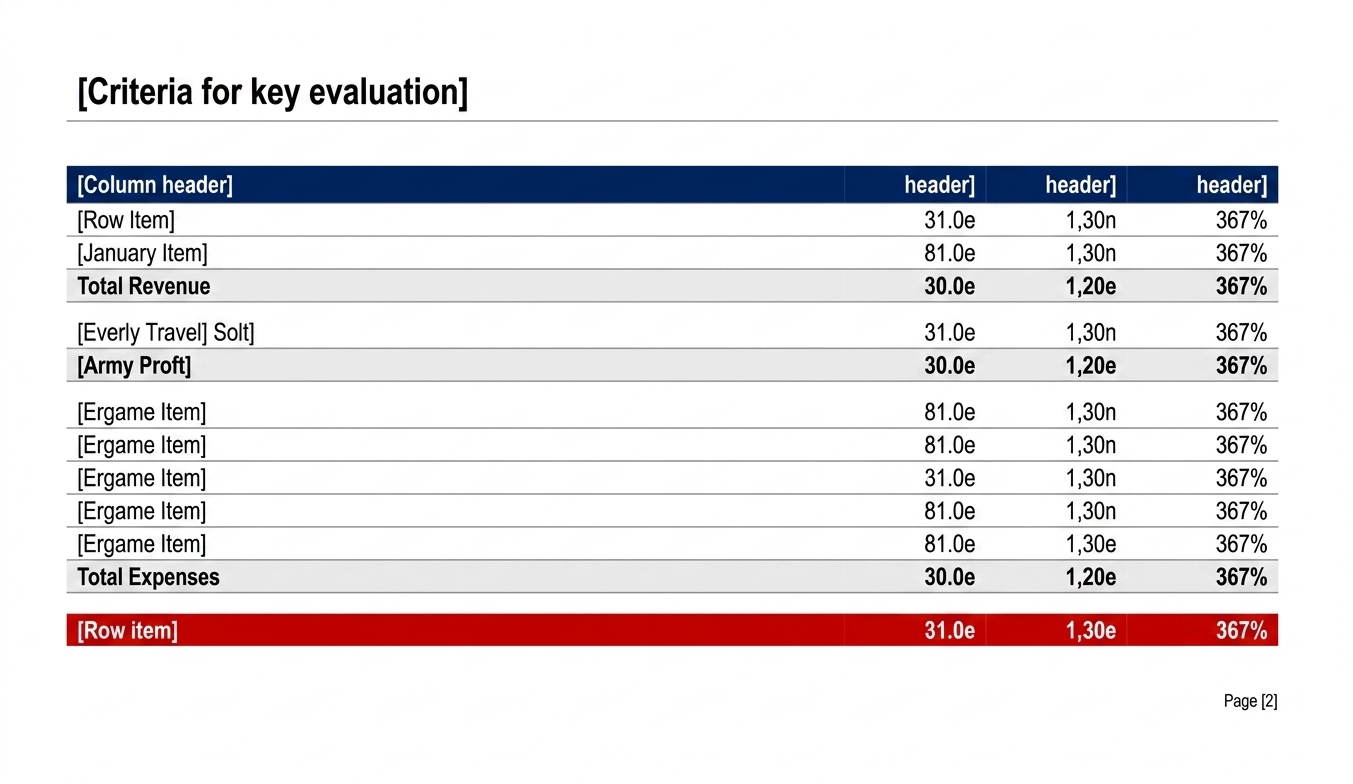
Exhibit 4: 3-Statement Financial Model Summary Grid: Integrated Income Statement, Balance Sheet, and FCF Reconciliation
Institutional Planning Rhythms: Aligning Corporate Strategy, Business Unit Targets, and Capital Rationing
The Annual Planning & Rolling Forecast Governance Checklist (10 Operational Cadence Gates)
Exhibit 5: The Corporate Planning Cadence Roadmap: Strategic Guidance, Departmental Budgeting, and Executive Sign-Off
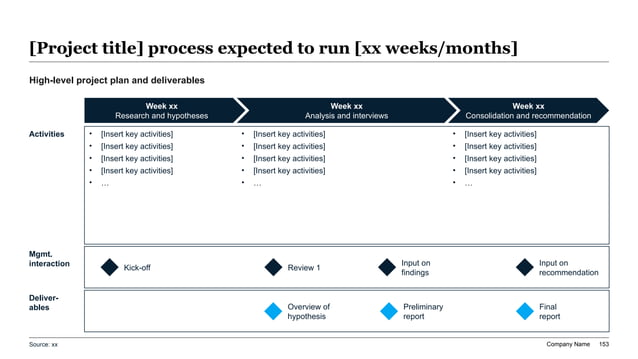
The 8-Slide Institutional FP&A Executive Committee Deck Architecture
Common Anti-Patterns in Financial Presentations: How FP&A Decks Lose Executive Engagement
Executive XLSlides Prompt Recipe: Generating a Complete Corporate FP&A Executive Committee Deck
Act as a Senior Vice President of Financial Planning & Analysis (FP&A) and Strategic Corporate Finance. Generate an institutional, executive-ready 8-slide presentation deck for the CFO, CEO, and Executive Committee evaluating our quarterly financial performance, operational variance, and 12-month rolling forecast. Enterprise Background & Financial Performance Context: - Company Profile: B2B Enterprise Software & Industrial Technology Platform ($850M Annual Revenue, $158.4M Adjusted EBITDA, 18.6% EBITDA Margin, 2,400 Employees). - Performance Summary: Q3 Revenue reached $218.4M (+6.2% YoY, +$4.2M vs Budget); Adjusted EBITDA reached $41.8M (+8.5% YoY, -$1.8M vs Budget due to cloud compute cost pull-forward); Unlevered Free Cash Flow reached $28.5M (68.2% FCF conversion). - Variance Root Causes: Net positive volume growth (+$6.8M) and price realization (+$2.4M) offset by raw material freight spot rate inflation (-$3.2M), accelerated enterprise cloud migration hosting fees (-$2.6M), and delayed enterprise GTM hiring ramp (+$1.4M labor timing savings). - Rolling Horizon Outlook: 5-Quarter Rolling Forecast projects $895.0M FY+1 Revenue and $172.5M EBITDA (19.3% margin). Minimum cash floor maintained at $85.0M; Net Debt / EBITDA leverage stands at 2.65x against a 4.00x covenant ceiling. Presentation Architecture Requirements: 1. Executive Slide Narrative: Strictly enforce answer-first action titles for every slide (e.g., "Q3 EBITDA Reached $41.8M as Strong Volume Growth Offset Cloud Hosting Pull-Forward"). 2. Slide 1 (Executive Scorecard): 5-metric executive dashboard (Revenue, Gross Margin, Adjusted EBITDA, Free Cash Flow, Liquidity) comparing Actual vs. Budget and YoY deltas. 3. Slide 2 (Operating Variance Waterfall): Decompose $1.8M EBITDA budget variance into Volume, Price, Mix, Inflation, and Fixed SG&A vectors. 4. Slide 3 (Business Unit Contribution Matrix): 4-division table evaluating ARR, Gross Margin %, and SG&A efficiency across Enterprise Software, Industrial Hardware, Cloud Services, and Managed Services. 5. Slide 4 (Driver-Based Sales Capacity): Analysis of sales rep quota capacity, AE ramp-up velocity, and average contract ARR productivity. 6. Slide 5 (Working Capital & Cash Flow Bridge): Waterfall reconciling EBITDA to Ending Liquid Cash through DSO (52 days), CapEx ($12.5M), cash interest ($5.8M), and taxes ($3.2M). 7. Slide 6 (5-Quarter Rolling Forecast): Comparative projections across Base Case, Downside Stagflation, and Accelerated Investment scenarios with debt covenant buffer callouts. 8. Slide 7 (CapEx Hurdle Tracking): 5-project CapEx allocation scorecard ranking investments by IRR, NPV, and execution milestone phase-gates. 9. Slide 8 (Strategic Action Asks): Clear executive decisions: release $4.5M CapEx tranche for automated testing, approve reallocation of $1.2M hiring lag savings into performance marketing, and affirm 2027 planning targets. Visual & Design Direction: - Premium management consulting visual aesthetic (McKinsey / Morgan Stanley / Goldman Sachs institutional tone). - Color Palette: Deep executive navy (#0F172A), slate grey (#475569), corporate cobalt (#2563EB), and crisp white (#FFFFFF). Use muted crimson (#DC2626) sparingly for negative variances and emerald (#16A34A) for positive variances. - Never include raw spreadsheet dumps or cluttered bulleted text. Every slide must feature a prominent visual artifact (waterfall chart, scenario fan, grouped column, or structured rating matrix) paired with concise executive commentary.
Frequently Asked Questions: Executive Corporate FP&A and Financial Presentation Strategy
How does corporate FP&A differ from financial controllership and treasury?
While all three functions report to the Chief Financial Officer, their mandates and time horizons are fundamentally different. Financial Controllership is historical and compliance-focused: it manages the general ledger, enforces GAAP/IFRS accounting rules, closes the monthly books, and ensures statutory audit compliance. Corporate Treasury is liquidity and risk-focused: it manages bank syndicate relationships, cash concentration, debt facilities, foreign exchange hedging, and working capital solvency. Corporate FP&A is forward-looking and strategically commercial: it translates enterprise strategy into financial forecasts, constructs driver-based models, decomposes operational variance, stress-tests multi-scenario plans, and provides decision-ready capital allocation intelligence to executive leadership.
Why are leading corporate finance organizations abandoning static annual budgets in favor of rolling forecasts?
Static annual budgets take 3 to 6 months of intense organizational effort to negotiate, yet they become obsolete within 60 to 90 days of the fiscal year start due to shifting macroeconomic conditions, competitive actions, and supply chain disruptions. Furthermore, static budgets create an artificial fiscal cliff in the fourth quarter where visibility drops to zero and managers game the system with "use-it-or-lose-it" spending behavior. Continuous 12-to-18 month rolling forecasts eliminate the fiscal cliff by adding an incremental future quarter as each quarter closes, maintaining an unbroken 4-to-6 quarter forward visibility window that guides continuous capital allocation and proactive covenant monitoring.
How should FP&A present complex mathematical variance models to non-financial operating executives?
Operating executives disengage when confronted with abstract calculus formulas or multi-column general ledger account tables. FP&A leaders must present variance through visual waterfall bridges paired with operational root-cause translations. Instead of reporting an unfavorable price variance of $2.4M, the slide should explain: "Sales discounting concessions in European enterprise accounts reduced net realized pricing by 4.2%, diluting gross margin by $2.4M despite closing 12% more unit volume." Linking every financial variance directly to an operational lever, an organizational owner, and a corrective management action makes the analysis immediately actionable.
What is the optimal balance between top-down financial target setting and bottom-up operational budgeting?
Neither purely top-down nor purely bottom-up budgeting succeeds in isolation. A purely top-down approach imposes ungrounded executive mandates that lack operational buy-in from front-line managers. A purely bottom-up approach results in departmental sandbagging, excessive spending buffers, and fragmented sub-scale budgets. Elite organizations use a "Top-Down Envelope, Bottom-Up Build" hybrid model: the CEO and CFO set firm, non-negotiable financial envelopes (revenue targets, EBITDA margins, CapEx limits) based on market sizing and board commitments; business units then have full autonomy to construct the operational driver models (headcount, software, marketing programs) required to deliver those targets within their assigned envelopes.
How does driver-based financial modeling improve forecasting accuracy during periods of high inflation and volatility?
Traditional models extrapolate prior-period dollar amounts with arbitrary percentage escalators, which completely breaks down when inflation surges or demand drops. Driver-based modeling decouples physical operational volumes (units produced, headcount hours, server cores) from unit price inputs (raw material prices per pound, hourly contractor wage rates, cloud compute pricing per token). When macroeconomic inflation strikes, finance updates the unit price input in a single variable cell, and the entire 3-statement financial model dynamically recalculates across all product lines, giving executive leadership instant visibility into margin compression and required price pass-throughs.
What are the most critical debt covenants to monitor and display in an executive FP&A board deck?
In leveraged corporate structures, private equity portfolio companies, or syndicated debt environments, FP&A presentations must continuously monitor three core covenants: (1) Total Net Debt / TTM Adjusted EBITDA (the primary leverage ceiling, typically capped between 3.50x and 5.00x); (2) Senior Secured Net Leverage Ratio (evaluating first-lien bank debt against EBITDA); and (3) Fixed Charge Coverage Ratio or Interest Coverage Ratio (EBITDA minus maintenance CapEx and cash taxes divided by cash interest expense, typically requiring a minimum floor of 1.25x to 1.50x). Presenting these ratios in a multi-scenario sensitivity matrix ensures the board never encounters an unexpected covenant default or forced equity cure.
How can presentation automation and generative AI accelerate the monthly and quarterly FP&A reporting cycle?
Historically, corporate FP&A teams spend 70% to 80% of their working hours manually extracting CSV data, updating Excel tables, and formatting repetitive PowerPoint slides, leaving only 20% of their capacity for actual strategic analysis. Modern AI presentation workflows like XLSlides automate this entire mechanical burden: raw financial models, variance ledgers, and rolling forecast tables are ingested directly into institutional presentation templates with pre-engineered waterfall bridges, multi-column executive scorecards, and formatted variance callouts. This compresses the monthly reporting cycle from ten business days to 48 hours, freeing finance professionals to act as true strategic advisors to executive leadership.