Executive Summary & Direct Answer: The Fiduciary Standard for CMO Board Presentations
Key Institutional Takeaways for the Chief Marketing Officer & Board of Directors
Simulate & Prototype: CMO Board Presentation Guide: Architecting Decision-Ready Marketing Strategy & ROI Decks
Drag to draw custom components, test consulting layout presets, and preview presentation architecture live before generating with AI.
Table 1: Marketing Accountability Metrics vs. Board Governance Expectations
| Operational Metric (Tactical) | Board-Level Equivalent (Governance) | Primary Metric Owner | Target Performance Threshold | Strategic Boardroom Impact |
|---|---|---|---|---|
| Website Impressions & Ad Clicks | Marketing-Sourced Pipeline (ARR / TCV) | VP Performance Marketing / CMO | >= 35% of Total Net-New Pipeline | Proves direct demand creation capacity vs. passive organic drift |
| Cost Per Click (CPC) & Cost Per Lead (CPL) | Fully-Loaded CAC & CAC Payback Period | Head of Growth / FP&A Director | <= 12 Months (SMB) / <= 18 Months (Enterprise) | Reassures CFO of rapid working capital recapture and cash efficiency |
| Brand Sentiment & Social Engagement | Excess Share of Voice (ESOV) & Net Pricing Power | VP Brand Strategy / CMO | ESOV >= +5.0% vs. Market Share | Quantifies economic moat, gross margin defensibility, and market share capture |
| Marketing Qualified Leads (MQLs) | Sales Accepted Pipeline (SAP) & Deal Velocity | VP Revenue Operations / CRO | >= 65% MQL-to-SQL Acceptance Rate | Eliminates departmental finger-pointing; enforces sales-marketing SLA alignment |
| Software-Reported Last-Touch ROAS | Econometric Incrementality (Marginal Return on Ad Spend) | Head of Marketing Analytics / CMO | Marginal mROAS >= 1.5x on Incremental Spend | Isolates genuine commercial lift from organic baseline; prevents ad spend waste |
| Campaign Production Count & Asset Volume | Strategic Initiative Milestone Delivery & Budget Variance | CMO / Chief of Staff to CMO | Within +/- 3% of Board-Approved Budget | Demonstrates operational rigor, spend predictability, and governance discipline |
The Strategic Choice Architecture: Framing Marketing as an Investment Portfolio, Not a Cost Center
Exhibit 1: CMO Board Executive Summary & Strategic Choice Architecture
Marketing Unit Economics: CAC Payback, LTV:CAC Ratios & Margin Contribution Across Segments
Exhibit 2: Marketing Unit Economics & CAC Payback by Acquisition Channel
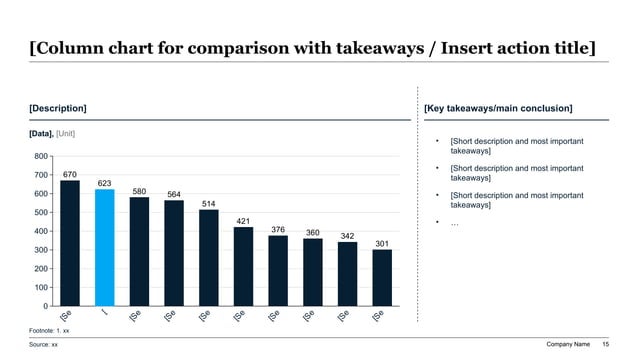
Table 2: Channel Acquisition Economics, Blended vs. Paid CAC & Payback Corridor Matrix
| Acquisition Channel | Share of Budget | Direct Paid CAC | Fully-Loaded CAC | CAC Payback Period | LTV:CAC Ratio | Board-Approved Strategic Role |
|---|---|---|---|---|---|---|
| Account-Based Marketing (ABM) | 32.5% | $2,100 | $3,100 | 8.2 Months | 4.8x | Scale Aggressively: Primary driver of high-ACV enterprise tier expansions |
| Executive Thought Leadership & Roundtables | 18.0% | $1,450 | $2,400 | 6.4 Months | 5.6x | Core Growth Engine: Highest C-suite deal velocity and premium win rates |
| Organic Search (SEO) & Technical Content | 14.5% | $420 | $950 | 3.1 Months | 8.2x | Foundational Moat: Long-term compounding asset protecting organic baseline |
| Paid Search (High-Intent Non-Branded) | 20.0% | $5,200 | $7,800 | 19.4 Months | 2.6x | Ration & Optimize: Cap bids; eliminate low-margin broad match bidding |
| Paid Social & Programmatic Display | 10.0% | $4,800 | $6,900 | 17.8 Months | 2.9x | Reposition: Reallocate from cold acquisition to retargeting and brand aircover |
| Partner Ecosystem & Co-Marketing | 5.0% | $680 | $1,250 | 4.5 Months | 6.1x | Expand Opportunistically: Leverage reseller and alliance networks for margin-accretive growth |
Media Mix Modeling (MMM) vs. Attribution: Isolating Incremental Lift from Baseline Organic Demand
Exhibit 3: Media Mix Modeling (MMM) & Incremental Revenue Attribution Decision Tree
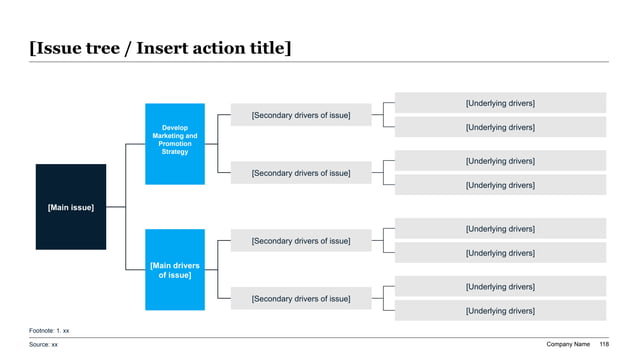
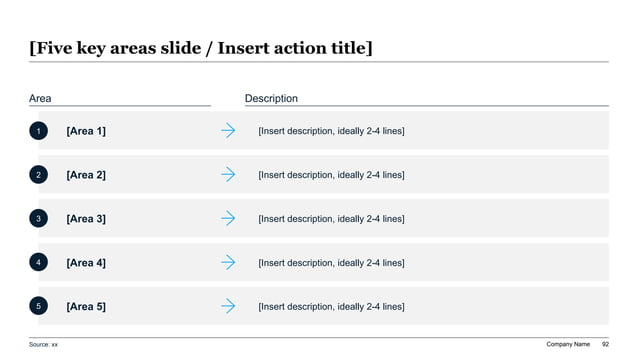
Table 3: Media Mix Allocation Benchmark: Binet & Field 60/40 Brand vs. Sales Activation Split
| Strategic Dimension | Brand Building (~60% Budget Allocation) | Sales Activation (~40% Budget Allocation) | Executive Rationale for Board Approval |
|---|---|---|---|
| Primary Commercial Objective | Create long-term mental availability, category leadership, and pricing power | Convert in-market buyers into immediate pipeline opportunities | Prevents margin erosion; companies that over-index on activation face rising CAC and severe price elasticity |
| Target Audience Reach | Broad category reach (all potential future buyers in addressable market) | Tightly targeted in-market buyers (currently active in buying cycle) | Only ~5% of B2B buyers are in-market in any given quarter; starving the 95% destroys next year's pipeline |
| Primary Psychological Mechanism | Emotional salience, narrative positioning, and cognitive trust | Rational product features, pricing offers, and direct calls to action | B2B decisions involve high professional career risk; trust and brand reputation dominate final vendor selection |
| Measurement Horizon & Metrics | Long-term (6 to 24 Months): ESOV, brand recall, gross margin premium | Short-term (1 to 90 Days): MQLs, demo bookings, click-through conversions | Board must understand that evaluating brand investments on 30-day conversion cycles triggers false negatives |
| Economic Impact on Cash Flow | Drives sustainable pricing power; lowers long-term blended CAC by 28% | Drives immediate quarterly revenue realization and working capital velocity | The 60/40 ratio balances current-quarter pipeline obligations with 3-year enterprise equity compounding |
Full-Funnel Pipeline Mathematics: Marketing Sourced vs. Marketing Influenced Revenue Waterfalls
Exhibit 4: 5-Stage Full-Funnel Lead-to-Revenue Conversion Flow & Velocity Metrics
The 12-Month Marketing Capability Transformation & Budget Governance Cadence
Exhibit 5: 3-State Marketing Capability & Media Mix Maturity Roadmap
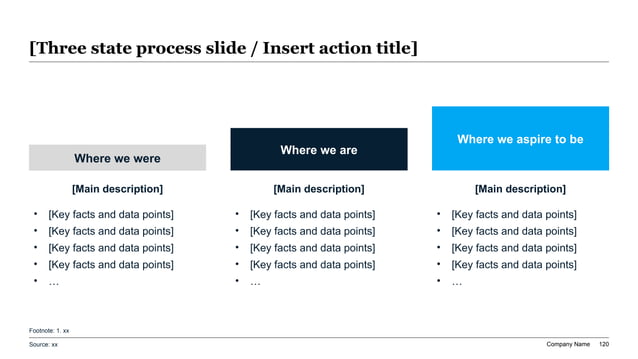
Table 4: The Master CMO Board Deck Blueprint (The 8-Slide Decision-Ready Architecture)
| Slide Number | Slide Name & Headline Focus | Executive Purpose & Core Question Answered | Recommended Visual & Data Format | Key Board Takeaway & Decision Action |
|---|---|---|---|---|
| Slide 1 | Executive Summary & Capital Request | What is the commercial state of the business and what capital decision is required today? | 3-Card Strategic Choice Layout (Exhibit 1) | Approve $24M marketing budget allocation based on disciplined unit economic payback commitments |
| Slide 2 | Macro Market Context & Competitive Landscape | How are market dynamics, customer behaviors, and competitors evolving? | 2x2 Competitive Positioning Grid / Share of Voice Chart | Demonstrate market share gains and identify strategic growth opportunities in target customer segments |
| Slide 3 | Marketing Unit Economics & Payback Corridors | Is marketing capital being deployed efficiently across customer acquisition channels? | Descending Column Bar Chart with Takeaways (Exhibit 2) | Validate that blended CAC payback (<12 mos) and LTV:CAC (4.2x) meet institutional CFO investment thresholds |
| Slide 4 | Media Mix Modeling & Incrementality Proof | How do we know marketing is driving genuine incremental revenue vs. baseline demand? | Branching Issue Tree / Econometric Regression Curve (Exhibit 3) | Prove that marketing spend creates real commercial lift, justifying budget shift from search ads to ABM |
| Slide 5 | Full-Funnel Pipeline Waterfall & Sales SLA | How effectively is marketing partner-shipping with sales to convert demand into closed ARR? | 5-Stage Horizontal Process Flow with SLAs (Exhibit 4) | Confirm 3.8x pipeline coverage against quota and verify 68% sales acceptance rate of marketing-generated leads |
| Slide 6 | Brand Equity vs. Performance Allocation (60/40) | How are we balancing immediate quarterly pipeline with long-term pricing resilience? | Dual-Track Investment Comparison Matrix (Table 3) | Secure board buy-in for protecting brand investment to defend gross margins against competitor discounting |
| Slide 7 | 12-Month Capability Roadmap & Transformation | How is the marketing organization evolving its technology, talent, and execution capability? | 3-State Strategic Maturity Progression Roadmap (Exhibit 5) | Demonstrate operational execution discipline and stage-gated milestone delivery |
| Slide 8 | Governance, Risk Management & Board Asks | What specific approvals, policy decisions, and oversight mechanisms are required today? | Executive Scorecard & Formal Resolution Block | Formal Board approval of annual marketing plan, budget envelope, and quarterly governance review schedule |
Checklist 1: The Pre-Board CMO Deck Defense & CFO Reconciliation Gate (10 Mandatory Audits)
Checklist 2: The CMO 100-Day Board Presentation Execution Gate (10 Governance Milestones)
XLSlides CMO Board Presentation Prompt Recipe
Role: Chief Marketing Officer (CMO) and Strategic Commercial Advisor presenting to the Board of Directors and Executive Leadership Team. Task: Generate an institutional, decision-ready 8-slide CMO Board Presentation deck evaluating marketing return on capital, defending marketing ROI, modeling CAC payback corridors by channel, and presenting a formal annual budget allocation request. Instructions: 1. Structure the presentation using the established 8-Slide Executive Blueprint: Executive Summary & Capital Request -> Market Context & Competitive Landscape -> Marketing Unit Economics & CAC Payback -> Media Mix Modeling & Incrementality Proof -> Full-Funnel Pipeline Waterfall & Sales SLA -> Brand vs. Performance Allocation (60/40) -> 12-Month Capability Roadmap -> Governance & Board Asks. 2. Write every slide title as a rigorous executive action assertion that communicates the strategic takeaway (e.g., 'Reallocating $3.2M from Saturated Search into Account-Based Marketing Compresses Blended CAC Payback from 16 to 11 Months'). 3. Ensure all customer acquisition costs are fully loaded, incorporating media spend, martech infrastructure, agency retainers, and fully burdened marketing/SDR payroll on a gross margin basis. 4. Incorporate Media Mix Modeling (MMM) and matched-market geo-lift incrementality logic, explicitly separating baseline organic demand from marketing-driven revenue lift. 5. Establish bi-directional Sales-Marketing SLAs detailing MQL-to-SAL acceptance thresholds, minimum 3.8x pipeline coverage against quota, and Stage 2 opportunity velocity. 6. Defend the Binet & Field 60/40 investment ratio, balancing long-term brand equity and pricing resilience (~60%) against short-term sales activation (~40%). 7. Format slide content into clean executive visual structures: 3-column strategic choice cards, descending column charts with takeaways, branching issue trees, horizontal process flows, and maturity progression roadmaps. 8. Generate completely editable PowerPoint-compatible slides with executive typography, source citations, and clear decision blocks.