Executive Summary: The Boardroom Mandate for Scientific Revenue Predictability
Key Takeaways: Principles of High-Predictability Revenue Presentations
Exhibit 1: Net Pipeline Movement & Revenue Bridge Waterfall
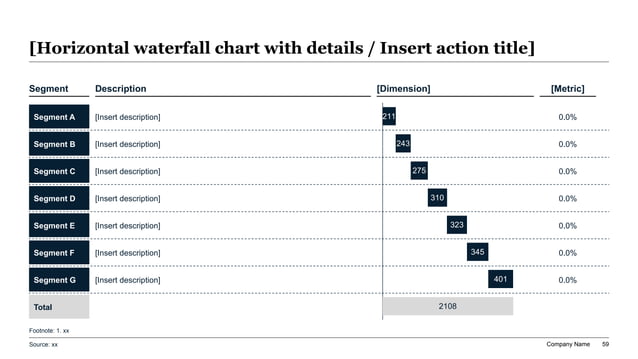
Deconstructing the Revenue Bridge: Analyzing Pipeline Inflow, Velocity, and Slippage
Pipeline Stage Health, Conversion Benchmarks, and Velocity Metrics
A comprehensive operational framework defining enterprise sales pipeline stages, verifiable buyer exit milestones, target days in stage, historical conversion benchmarks, and stall red flags.
Pipeline Coverage Ratios: Why 3x Is a Dangerous Fallacy in Enterprise Sales
Exhibit 2: Multi-Segment Pipeline Coverage & Stage Conversion Velocity
Stage Conversion Velocity and the Science of Deal Aging Friction
The Monday Morning Pipeline Inspection Checklist for RevOps and Sales Managers
The Deal Qualification Standard: Enforcing Objective MEDDPICC Rigor
Exhibit 3: Enterprise Opportunity Health & MEDDPICC Deal Qualification Scorecard
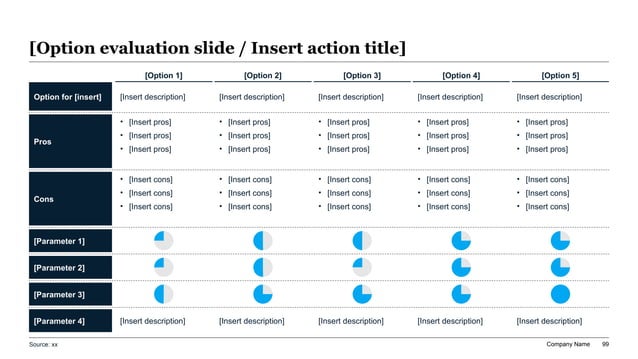
Deconstructing High-Impact Deals: The Anatomy of a Must-Win Enterprise Opportunity
MEDDPICC Evaluation Matrix and Objective Evidence Verification Standards
A formal inspection rubric detailing the core qualification questions, objective documentary verification required, red flag risk indicators, and forecast impact for each MEDDPICC dimension.
Forecast Triangulation: Moving Beyond Single-Point Estimates to Multi-Model Confidence Intervals
Exhibit 4: Multi-Scenario Revenue Forecast Triangulation: Closed Actuals vs. Multi-Tier Projections
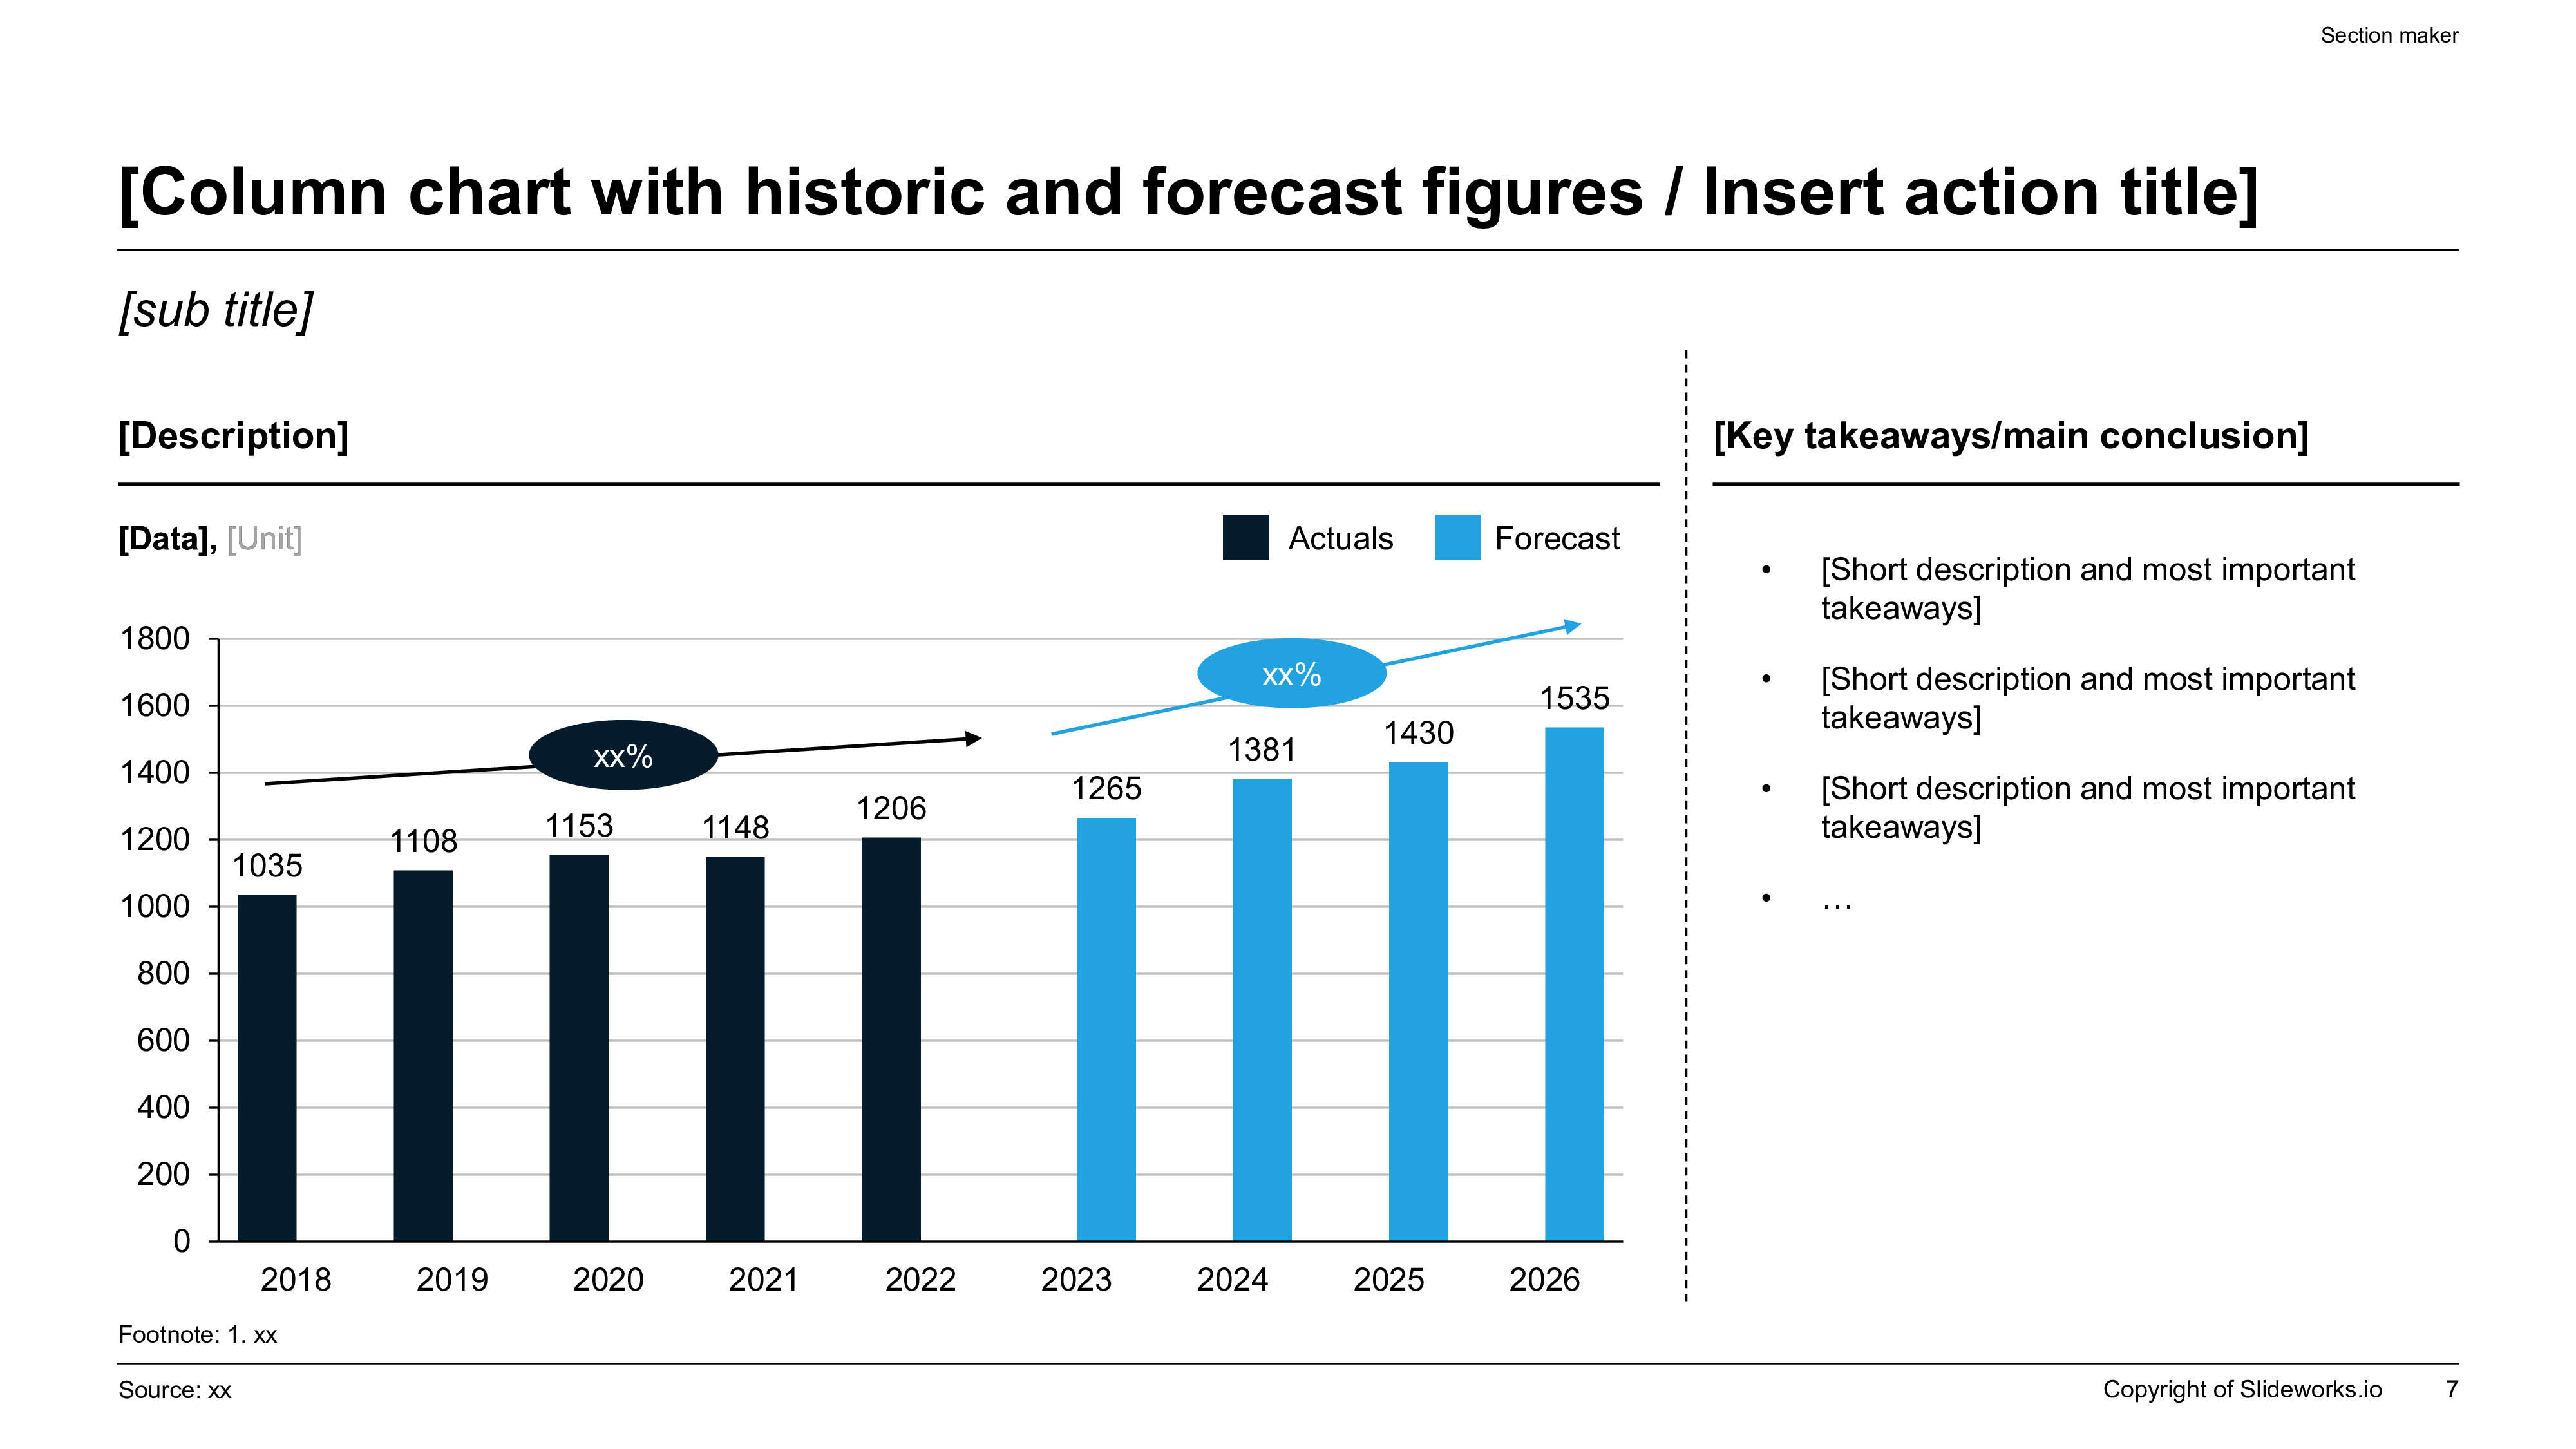
Reconciling the Forecast Gap: Building Defensible Mitigation Action Plans
Comparative Synthesis of the Four Core Revenue Forecasting Methodologies
An executive comparison evaluating the data inputs, operational strengths, inherent blindspots, and optimal boardroom application of the four primary commercial forecasting models.
Sales Capacity Economics: Reconciling Quota Distribution, Rep Ramp, and Headcount Productivity
The 10-Point Pre-Board Revenue Forecast Defense Governance Checklist
Exhibit 5: Rep Ramp Velocity & Sales Capacity Delivery Roadmap: 5-Phase Quota Productivity Architecture
Architecting the Boardroom Presentation Narrative: The 8-Slide Executive Deck Structure
XLSlides System Prompt Recipe: Generating Board-Ready Sales Pipeline & Forecast Decks
Act as a Senior Partner at a premier management consultancy (McKinsey, Bain, or BCG) specializing in B2B Commercial Excellence and Revenue Operations (RevOps). Analyze the provided raw sales pipeline data, CRM export, and quarterly revenue targets to generate a comprehensive, executive-ready 8-slide Sales Pipeline & Forecasting Presentation deck for the Executive Leadership Team and Board Audit/Finance Committee. ### INPUT DATA REQUIRED: 1. Target Operating Plan: Total quarterly bookings/revenue target ($), split by segment (Enterprise, Mid-Market, SMB). 2. Pipeline Movement Metrics: Starting pipeline, in-quarter newly created pipeline, out-quarter pull-ins, closed-won revenue, slipped/pushed deals, closed-lost attrition, and ending pipeline. 3. Top 10 Must-Win Opportunities: Opportunity name, deal size ($ ACV/TCV), current stage, days in stage, Economic Buyer status, Champion profile, paper process status, and identified competitors. 4. Forecasting Scenarios: Rep bottom-up commit, frontline manager adjusted call, historical weighted pipeline, and statistical run-rate projections. 5. Sales Capacity Metrics: Total AE headcount, fully ramped AE count, ramping AE count, average quota per rep, and trailing quota attainment distribution %. ### STRUCTURAL PRESENTATION RULES: - Lead with Answer-First Logic: Every slide must feature a declarative "Action Title" summarizing the primary strategic takeaway in 12–16 words, followed by bold lead-in category headers. - Enforce MECE Decomposition: Disaggregate gross pipeline into distinct, mutually exclusive segments (Enterprise, Mid-Market, SMB) and isolate deal slippage as an independent variance metric. - Enforce Objective Qualification Standards: Evaluate top deals using the MEDDPICC framework (Metrics, Economic Buyer, Decision Criteria, Decision Process, Paper Process, Implicated Pain, Champion, Competition) rather than subjective rep optimism. - Deliver Triangulated Forecasting Corridors: Never present an unsubstantiated single-point forecast; provide an auditable range contrasting Bottom-Up Commit, Statistical Run-Rate, and CFO Downside stress tests. - Format for Executive Readability: Use structured tables, clean waterfall bridges, Harvey Ball rating scorecards, and formatted financial data; avoid generic AI bullet points and marketing hype. ### GENERATE THE FOLLOWING 8-SLIDE DECK BLUEPRINT: - Slide 1: Executive Revenue Summary & Guidance Attainment (Closed Actuals vs. Triangulated Commit Corridor) - Slide 2: Net Pipeline Movement Waterfall Bridge (Starting Balance to Ending Qualified Pipeline) - Slide 3: Segmented Pipeline Coverage & Stage Conversion Velocity (Enterprise, Mid-Market, SMB Health) - Slide 4: Deal Stage Aging & Push Rate Friction Analysis (Isolating Stalled Zombie Pipeline) - Slide 5: Must-Win Enterprise Opportunities & MEDDPICC Qualification Scorecard (Top 10 Deal Teardowns) - Slide 6: Multi-Scenario Revenue Forecast Triangulation & Gap-to-Plan Mitigation Levers - Slide 7: Sales Capacity Economics, Rep Ramp Velocity & Quota Attainment Distribution - Slide 8: Strategic GTM Priorities & Next-Quarter Resource Allocation Commitments