Executive Summary: Why Most Product Strategy Presentations Fail in the Boardroom
In high-growth technology companies and private equity portfolio operations, few executive meetings derail faster than the annual or mid-year product strategy presentation. Chief Product Officers (CPOs), Heads of Product, and technical founders frequently enter the boardroom armed with 60-slide decks overflowing with feature release dates, UI wireframe mockups, Jira sprint velocity charts, and tactical bug burn-down metrics. To a board of directors, private equity operating partner, or Chief Financial Officer, this presentation format is not only unhelpful—it is alarming. The board does not evaluate engineering throughput; the board evaluates capital allocation, competitive defensibility, and return on invested R&D capital.
The fundamental disconnect lies in confusing a product development backlog with a product strategy. A product development backlog describes what engineering intends to build over the next two quarters. A product strategy, by contrast, is a commercial and architectural thesis that answers five non-negotiable executive questions: Where are market profit pools shifting? What structural moats prevent competitors from commoditizing our offering? How is R&D capital rationed across core optimization, adjacent market expansion, and transformational bets? How do product delivery horizons map directly to customer business outcomes and Net Revenue Retention (NRR)? And what specific governance decisions or resource commitments are required from executive leadership today?
When a product strategy presentation fails, the consequences reverberate across the enterprise: the CFO challenges engineering headcount requests, sales leadership complains about missing table-stakes features, customer success battles chronic churn, and the CEO is forced to mediate competing departmental priorities without an objective strategic anchor. Conversely, an institutional-grade product strategy presentation establishes unanimous executive consensus. It demonstrates that every dollar of R&D expenditure is directly tied to enterprise valuation expansion, defensible pricing power, and customer lifetime value (LTV).
This guide outlines the end-to-end blueprint for architecting, structuring, and delivering a decision-ready product strategy deck. Drawing on proven consulting frameworks from McKinsey, BCG, and top enterprise software operators, it provides exact slide structures, analytical exhibits, financial benchmarking tables, operational checklists, and AI prompt recipes to transform complex product roadmaps into high-conviction executive presentations.
Key Takeaways: Core Principles of Board-Ready Product Strategy Decks
- Anchor in Commercial Outcomes, Not Engineering Outputs: The boardroom measures product success in Net Revenue Retention (NRR), Gross Margin expansion, CAC payback velocity, and customer lifetime value—never story points, commit counts, or sprint velocity.
- Replace Calendar Commitments with Horizon Architecture: Date-driven roadmaps create a false sense of certainty and lead to broken executive trust. Structure roadmaps around Horizon 1 (Core Optimization), Horizon 2 (Adjacent Expansion), and Horizon 3 (Transformational Bets) tied to explicit validation gates.
- Audit Structural Moats Rather Than Feature Checklists: Competitors can replicate individual feature workflows within quarters. Executive presentations must demonstrate compounding structural moats: proprietary data network effects, workflow lock-in (systems of record), integration switching costs, or compliance certifications.
- Enforce Disciplined 70/20/10 Portfolio Capital Rationing: Explicitly allocate R&D investment across three distinct risk/return horizons (70% sustaining core ARR, 20% high-confidence adjacent product expansion, 10% experimental high-upside market bets) to prevent innovation starvation or core degradation.
- Expose Technical Debt as Balance Sheet Drag: Translate architectural debt into financial and operational terms: annual maintenance cost of carry, security vulnerability exposure, platform latency degradation, and R&D drag percentage that directly impairs gross margins.
- Synthesize the Ask on a Single Executive Decision Slide: Never conclude a product presentation without an explicit decision slide outlining required capital appropriations, headcount allocation by strategic pillar, commercial trade-offs, and board sign-off milestones.
Comparative Architecture: Tactical Feature Roadmap vs. Executive Product Strategy Deck
| Strategic Dimension | Tactical Feature Presentation (Failure Mode) | Executive Product Strategy Deck (Board-Ready Standard) | Boardroom Impact & Executive Perception |
|---|---|---|---|
| Primary Audience Focus | Engineering squads, designers, and scrum masters focused on execution mechanics. | Board of Directors, CEO, CFO, CRO, and Private Equity Operating Partners evaluating capital return. | Elevates product from a cost center executing tickets to an executive growth engine driving enterprise valuation. |
| Core Question Answered | 'What features are we coding and when will they be deployed to staging/production?' | 'Where are market profit pools shifting, how do we defend our pricing moat, and what is the return on R&D?' | Replaces defensive debates over delayed release dates with high-level alignment on market positioning and capital efficiency. |
| Roadmap Structuring Unit | Gantt charts with rigid monthly or quarterly feature release calendar dates. | Multi-horizon outcome framework (Now / Next / Later or H1 / H2 / H3) gated by customer validation metrics. | Eliminates artificial deadline pressure, manages executive expectations, and protects engineering integrity. |
| Financial & Operational Metrics | Jira story points completed, sprint velocity, bug burn-down rate, and ticket closure rates. | Net Revenue Retention (NRR), Gross Margin impact, CAC payback period, R&D spend as % of ARR, and LTV/CAC ratio. | Speaks the native language of the CFO and private equity sponsors, proving measurable commercial accountability. |
| Competitive Context | Superficial feature checklist grid with green checkmarks across every single row. | Analytical moat defensibility scatter plot highlighting switching costs, data gravity, and intentional non-goals. | Establishes deep boardroom credibility by acknowledging genuine trade-offs and competitor differentiation. |
| Resource Allocation Lens | Bottom-up headcount wish lists and capacity constraints without prioritization logic. | Top-down 70/20/10 portfolio investment envelope balancing core ARR defense against high-growth adjacent bets. | Provides clear governance for capital rationing, preventing fragmented engineering investment across pet projects. |
| Executive Action Requested | Passive informational update seeking general acknowledgment or sign-off on release dates. | Explicit decision gate seeking approval for R&D capital allocation, strategic trade-offs, and governance milestones. | Transforms the presentation into an active decision-making session that unblocks critical resources. |
Section 1: Market Landscape, Value Wedge, and Customer Inflection Dynamics
Every compelling product strategy begins with external market reality rather than internal product ambitions. Executive committees and boards expect product leaders to demonstrate a sophisticated understanding of macroeconomic tailwinds, regulatory shifts, technological inflections, and customer unit economics before presenting a single product initiative.
To establish immediate strategic gravitas, the opening section of the deck must define the 'Value Wedge.' Conceptualized in competitive strategy and corporate finance, the Value Wedge represents the unique commercial territory where customer willingness-to-pay intersects with proprietary capabilities that competitors cannot easily replicate. In enterprise software and technology markets, this wedge is constantly under threat from two forces: commoditization from point-solution startups and feature subsumption by incumbent hyperscalers (Microsoft, Salesforce, ServiceNow, AWS).
To articulate the market landscape effectively for senior leadership, structure the analysis around three rigorous pillars:
1. Macro Inflections & Market Shifts: What technological or structural changes (e.g., pervasive generative AI automation, API-first architecture, new data sovereignty laws) make our historical product paradigm vulnerable, and what new market opportunities do they unlock?
2. Customer Economic Pain Points: Rather than listing emotional user feedback, quantify the operational friction experienced by enterprise buyers. What is the annual dollar loss resulting from manual workflow fragmentation, data silos, or legacy software latency? Framing customer problems in terms of operational OpEx or revenue leakage provides an airtight economic rationale for our solution.
3. Total Addressable Market (TAM) Segmentation: Break down total market demand into defensible, bottom-up tranches. Avoid top-down industry reports quoting trillion-dollar generic markets. Segment the TAM into Serviceable Addressable Market (SAM) and Serviceable Obtainable Market (SOM) based on current ideal customer profile (ICP) penetration, average annual contract value (ACV), and gross revenue potential across target enterprise verticals.
By grounding the product strategy in quantified customer economics and macro market dynamics, the CPO demonstrates that the product roadmap is not an inward-looking engineering exercise, but an aggressive commercial strategy to capture market share.
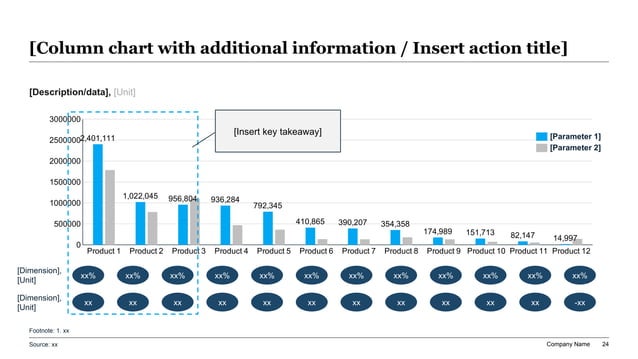
Exhibit 1: Product Portfolio Economics & Gross Margin Contribution
Section 2: Defensible Moat Architecture & Competitive Positioning
In software and digital business models, product features provide only temporary tactical advantage. A competitor with sufficient venture backing or engineering resources can clone a novel UI workflow or integration within six to nine months. Therefore, an executive product strategy presentation must articulate not merely what the product does, but what structural moats protect the business from competitive commoditization over a three-to-five-year holding period.
Top product strategists evaluate defensibility through the lens of four compounding structural moats:
1. System of Record & Workflow Lock-In: Does the product serve as the central repository of operational truth for critical enterprise workflows? When software sits in the direct path of core daily operations (e.g., ERP, CRM, core banking, clinical records), ripping and replacing it entails severe operational disruption, driving Gross Retention Rates (GRR) above 95%.
2. Data Gravity & Proprietary Network Effects: Does user interaction generate proprietary data assets that continuously improve algorithmic accuracy, workflow automation, or analytical insights? When the marginal cost of intelligence decreases with scale, early market leaders establish an insurmountable data moat.
3. Integration Ecosystem Switching Costs: Has the product established deep bi-directional integrations across the customer's enterprise tech stack? An application connected to 30 enterprise systems via authenticated APIs creates multi-stakeholder organizational inertia that thwarts point-solution displacement.
4. Regulatory, Security, and Compliance Moats: For enterprise buyers, certifications such as FedRAMP, SOC 2 Type II, HIPAA, ISO 27001, and GDPR compliance represent multi-million dollar table-stakes barriers to entry that protect incumbents from lightweight market entrants.
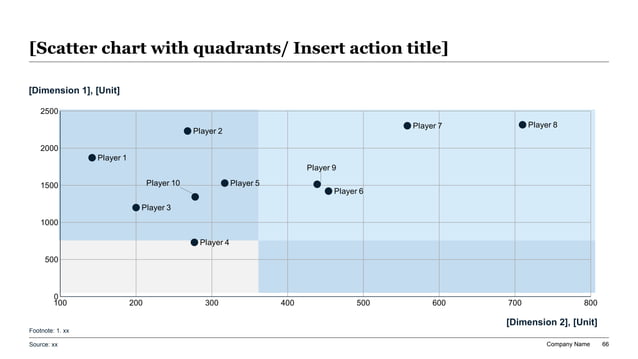
When presenting competitive positioning to the board, abandon the classic marketing slide that shows green checkmarks across every row for your product and red crosses for all competitors. Experienced board members recognize this as intellectual dishonesty. Instead, present an objective, nuanced competitive scatter plot that honestly delineates where competitors lead (e.g., enterprise customizability or legacy installed base) and where your product holds a decisive, defensible architectural advantage (e.g., real-time AI automation, low-code workflow orchestration, or superior time-to-value).
Exhibit 2: Competitive Positioning & Moat Defensibility Scatter Plot
The 7-Point Product Moat Audit & Defensibility Checklist
Section 3: Strategic Portfolio Allocation & R&D Capital Efficiency
One of the most consequential responsibilities of product leadership is rationing scarce engineering and design capacity. In high-growth environments, internal demand for product resources always exceeds available engineering hours by 3x to 5x. Sales demands custom one-off features to close end-of-quarter deals; customer success demands bug fixes to prevent account churn; engineering leadership demands architectural refactoring to retire technical debt; and the CEO envisions bold new product lines.
Without an explicit portfolio allocation model ratified by the board, product teams succumb to the 'peanut butter strategy'—spreading engineering resources thinly across dozens of competing requests without achieving escape velocity in any single area. To prevent this failure mode, institutional product leaders adopt the 70/20/10 Innovation Framework adapted for enterprise software:
- Horizon 1 (Core Optimization - 70%): Sustaining investments focused on protecting and expanding existing core ARR. This includes enterprise security, performance scalability, key workflow enhancements, UX friction removal, and critical retention-driving capabilities for primary customer cohorts.
- Horizon 2 (Adjacent Expansion - 20%): High-conviction growth investments targeting adjacent customer segments, new monetization modules, or international localization. These initiatives leverage the core platform architecture to expand Net Expansion Rate (NDR) across existing accounts.
- Horizon 3 (Transformational Bets - 10%): High-risk, high-upside experimental initiatives exploring disruptive architectural paradigms, proprietary AI reasoning engines, or novel market categories. These projects operate with lightweight discovery teams and explicit stage-gate funding hurdles.
In addition to the 70/20/10 framework, the executive presentation must address R&D efficiency metrics. CFOs and private equity sponsors track R&D expense as a percentage of revenue (typically 18%–25% for growth-stage SaaS, 12%–16% for mature scale). The CPO must demonstrate that engineering capacity is not merely expanding headcount, but increasing ARR yield per engineer and shortening the feedback loop from code commit to customer value realization.
Enterprise Product Portfolio Capital Allocation Matrix
| Portfolio Horizon | Strategic Objective & Mandate | Target R&D Spend % | Primary Financial & Operational Metrics | Representative Strategic Initiatives | Stage-Gate Governance Cadence |
|---|---|---|---|---|---|
| Horizon 1: Core Platform Optimization | Defend core revenue, maximize Gross Retention Rate (GRR), and lower platform cost-to-serve. | 65% – 70% | Gross Margin (target >80%), Platform Latency, Monthly Active Usage (MAU), Bug Escalation Rate (<2%). | Database partitioning, SOC 2 automation, multi-tenant performance optimization, core reporting UX refresh. | Monthly operational review with CTO and Head of Customer Success. |
| Horizon 2: Adjacent Market Expansion | Drive Net Revenue Retention (NRR) and increase Average Revenue Per Account (ARPA) via cross-sell. | 20% – 25% | Net Expansion Rate (>120%), New Module ARR Contribution, Feature Adoption Rate (>40% within 90 days). | Enterprise Workflow Automation add-on, Advanced Analytics module, European data residency architecture. | Quarterly strategic review with CEO, CRO, and product GM workstreams. |
| Horizon 3: Transformational Innovation | Position platform for long-term category leadership and explore breakthrough technological inflections. | 8% – 12% | Prototype Validation Velocity, Design Partner Conversion (>50%), Patent Applications, New TAM Unlocked. | Autonomous agent reasoning engine, zero-knowledge encryption protocol, next-generation mobile interface. | Bi-annual board milestone review with explicit kill/fund stage-gates. |
| Technical Debt & Architecture | Protect developer velocity, reduce architectural fragility, and eliminate security vulnerability drag. | 10% – 15% (Earmarked from H1) | Developer Deployment Velocity, Technical Debt Carry Cost, Mean Time to Recovery (MTTR), Infrastructure OpEx. | Monolith to microservices decoupling, legacy API deprecation, automated regression test suite overhaul. | Monthly architecture steering committee chaired by VP Engineering. |
Section 4: Enterprise Capability Benchmarking & Feature Moat Scorecards
When presenting product strategy to institutional investors and executive committees, high-level strategic narratives must be corroborated by granular capability benchmarking. Board members and PE operating partners conduct extensive commercial due diligence and customer referencing; any unsubstantiated claim of product superiority will be quickly dismantled.
To build an unassailable capability benchmark slide, product leaders should categorize platform features across three distinct strategic tiers:
1. Table-Stakes Foundations: Capabilities required simply to be considered in enterprise RFPs (e.g., SAML SSO, role-based access control, automated audit logs, data export). In these categories, the strategic goal is feature parity at minimal R&D cost.
2. Differentiating Core Capabilities: High-value workflows where our platform outperforms direct competitors in speed, user experience, automation, or integration depth. These capabilities drive initial sales conversion and justify premium tier pricing.
3. Structural Moat Innovations: Unique, defensible architectural capabilities that competitors cannot match without fundamentally re-architecting their underlying technology (e.g., real-time collaborative graph databases, proprietary AI model fine-tuning on domain data, patented security protocols).
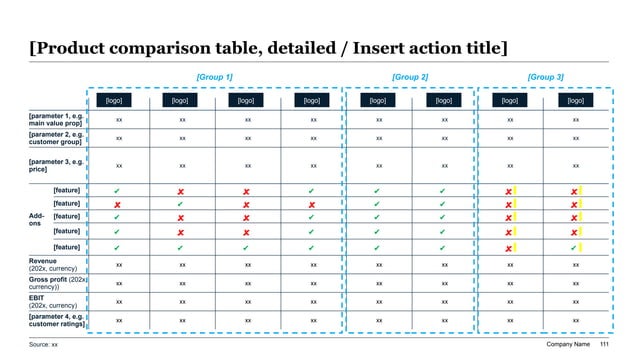
The slide must also evaluate technical capabilities against direct enterprise peers. By presenting a structured scorecard that evaluates functional completeness, API flexibility, deployment friction, and enterprise governance, the CPO demonstrates intellectual rigor and transparency. Acknowledging areas where competitors currently hold an edge—and explaining why closing that specific gap is either planned in Horizon 2 or an intentional strategic non-goal—inspires profound executive confidence.
Exhibit 3: Enterprise Capability & Moat Scorecard
Section 5: End-to-End User Journey & Value Realization Touchpoint Architecture
A product strategy is only as effective as the customer's ability to extract tangible business value from it. Too many product organizations suffer from the 'shelfware paradox'—building sophisticated, highly engineered software that customers purchase during initial enterprise sales cycles but fail to adopt across frontline teams, leading to catastrophic churn at contract renewal.
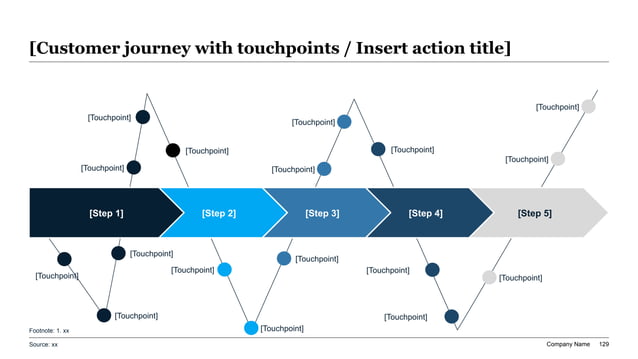
In an executive presentation, the CPO must bridge software architecture with customer value realization. This requires mapping the end-to-end user journey across five distinct organizational phases:
1. Tenant Provisioning & Technical Onboarding: The critical Day 1–14 window. How rapidly can enterprise IT configure security credentials, connect data pipelines, and provision user workspaces? The key metric is Time-to-First-Value (TTFV)—the elapsed time before an end user completes their first meaningful workflow.
2. Frontline Workflow Activation: The Day 15–45 window. How does the product guide the initial user cohort from passive observers to daily active operators? Self-serve interactive walkthroughs, automated workspace templates, and pre-built integrations minimize implementation friction.
3. Habitual Engagement & Organizational Sticking: The Day 46–90 window. The product transitions from an optional utility to an indispensable daily workspace. Collaboration hooks (e.g., real-time commenting, shared dashboards, automated executive alerts) pull cross-functional colleagues into the platform, creating internal virality.
4. Cross-Departmental Expansion & Monetization Triggers: The Day 91–180 window. Usage telemetry detects that secondary departments (e.g., finance, legal, sales operations) are accessing platform assets, automatically triggering commercial expansion workflows for the sales organization.
5. Executive Value Review & Contract Renewal: The Day 181–365 window. The platform autonomously generates quarterly executive summary reports proving the ROI delivered to C-level buyers (e.g., hours saved, revenue accelerated, operational risk mitigated), ensuring frictionless multi-year contract renewals.
Visualizing this touchpoint architecture reassures the board that product investments are designed end-to-end to drive customer retention and net revenue expansion.
Exhibit 4: Customer Value Realization Architecture & Touchpoint Map
Section 6: Outcome-Driven Multi-Horizon Roadmap Architecture
The central centerpiece of any product presentation is the strategic roadmap. Yet this is precisely where most product leaders commit boardroom career suicide. Committing to exact calendar release dates for complex software initiatives twelve to eighteen months in advance is an exercise in fiction. Unforeseen technical debt, security patches, enterprise customer escalations, and market shifts inevitably disrupt rigid delivery schedules. When features are delayed, the board perceives product management as undisciplined and untrustworthy.
To break this cycle, modern product executives replace calendar-based Gantt charts with an Outcome-Driven Multi-Horizon Roadmap. Instead of grouping slides by Q1, Q2, Q3, and Q4, organize initiatives into three phased horizons characterized by increasing levels of strategic abstraction and flexible execution:
- Horizon 1: Now (Committed / In Build - Next 90 Days): High-fidelity, deterministic execution. Engineering squads are actively writing code; specifications and UX designs are fully finalized. Initiatives in this horizon commit to specific customer outcomes (e.g., 'Reduce enterprise SSO onboarding time from 4 days to 15 minutes').
- Horizon 2: Next (Prioritized / In Discovery & Validation - 3 to 6 Months): High-confidence strategic initiatives currently undergoing customer discovery, technical prototyping, and pricing validation. Commitments describe target business problems to solve rather than exact UI specifications.
- Horizon 3: Later (Exploratory / Strategic Direction - 6 to 18 Months): Broad strategic focus areas aligned with long-term market trends and category vision. These initiatives represent options to invest rather than firm delivery promises, subject to stage-gate validation gates.
Every major initiative on the roadmap must include four metadata attributes: (1) Strategic Investment Pillar, (2) Primary Target Metric / KPI, (3) Key Technical Dependency, and (4) Stage-Gate Validation Criteria required before engineering resources are formally released.
Exhibit 5: Multi-Horizon Strategic Product Roadmap & Gating Architecture
Product Strategy KPI & Financial Metric Architecture
| Strategic Dimension | Core Operational Metric | Target Industry Benchmark | Board-Level Reporting Frequency | Direct P&L & Valuation Impact Mechanism |
|---|---|---|---|---|
| Customer Retention & Loyalty | Net Revenue Retention (NRR) & Gross Retention Rate (GRR) | NRR > 120% (Enterprise), GRR > 92% | Monthly & Quarterly Board Meetings | High NRR drives compounding enterprise valuation multiples; every 5% increase in NRR yields ~15% higher market cap. |
| Capital Efficiency & Payback | CAC Payback Period & LTV/CAC Ratio | CAC Payback < 14 months, LTV/CAC > 3.5x | Quarterly Operating Review | Short CAC payback enables aggressive reinvestment of operating cash flow into product R&D and sales distribution. |
| R&D Spend Productivity | R&D as % of ARR & Revenue per Engineer | R&D at 18%–24% of ARR, >$280k ARR/Engineer | Annual Operating Plan & Quarterly Review | Ensures engineering headcount growth translates linearly into scalable gross software revenue rather than overhead. |
| Feature Adoption Velocity | Core Workflow Adoption & Monthly Active Usage (MAU/DAU) | >60% of licensed users active weekly in core workflows | Monthly Product Review Dashboard | Deep workflow utilization directly thwarts competitor displacement and anchors annual renewal negotiations. |
| Platform Reliability & Cost-to-Serve | Infrastructure OpEx % of COGS & System Uptime | Hosting < 12% of revenue, 99.95% Availability | Monthly Executive Scorecard | Efficient multi-tenant cloud architectures protect 80%+ gross margins, leaving cash flow for discretionary innovation. |
| Time-to-First-Value (TTFV) | Days from Contract Execution to Live Enterprise Production | < 30 Days (Mid-Market), < 60 Days (Enterprise) | Quarterly GTM Steering Committee | Accelerates revenue recognition, reduces early implementation churn, and shortens sales billing cycles. |
Section 7: Executive Delivery, Boardroom Facilitation, and C-Suite Alignment
Constructing an exceptional product strategy deck is only half the battle; successfully facilitating the boardroom discussion is what secures strategic alignment and capital sign-off. When presenting to boards and senior executives, the CPO must govern the room with poise, brevity, and business acumen.
Mastering executive delivery requires adherence to five boardroom protocols:
1. The 10-Slide Rule for Executive Decks: Resist the temptation to present a 40-slide master deck during the formal presentation. Executive attention spans are brief. Limit the primary deck to exactly 10 to 12 high-impact slides: (1) Executive Summary & Problem Framing, (2) Market Dynamics & Value Wedge, (3) Moat Defensibility Scatter Plot, (4) 70/20/10 Portfolio Envelope, (5) Capability Benchmark Scorecard, (6) Customer Value Realization Map, (7) Multi-Horizon Roadmap, (8) Unit Economics & KPI Architecture, (9) Resource Allocation & Capital Ask, and (10) Risk Mitigation & Decision Gate. Move all detailed feature specifications, user research transcripts, and technical architecture diagrams into an indexed Appendix.
2. Lead with the 'Answer First' (Minto Pyramid Principle): Never structure a board presentation as a suspense novel where the big reveal arrives on slide 25. State the overarching strategic recommendation, requested capital envelope, and projected business impact on slide 1. Busy board members can absorb the strategic context immediately and evaluate subsequent slides as supporting evidence.
3. Pre-Wire Key Stakeholders Before the Meeting: Never walk into a board meeting with an unvetted product strategy. Two weeks prior to the meeting, schedule individual 30-minute alignment sessions with the CEO, CFO, and CRO. Review the R&D budget with the CFO, address commercial feature priorities with the CRO, and resolve architectural concerns with the CTO. By the time the formal board meeting convenes, all major points of friction have been resolved, and the meeting becomes a ceremonial ratification of pre-aligned strategy.
4. Welcome Tough Questioning with Data Discipline: When a board member questions a roadmap priority or challenges an architectural bet, avoid defensive posturing. Respond with empirical customer telemetry, win/loss sales data, or clear opportunity cost trade-offs (e.g., 'We evaluated accelerating that module, but it would require diverting 4 engineers from our core SOC 2 automation, exposing $8M in enterprise renewal pipeline to compliance risk').
Pre-Board Product Strategy Readiness & Sanity Checklist
Section 8: Accelerating Executive Slide Creation with XLSlides AI
For product executives and strategy teams, the process of synthesizing complex product strategy documents, PRDs, financial models, and customer interview findings into polished, executive-ready presentations is notoriously grueling. Product managers frequently spend 30 to 40 hours formatting slide shapes, aligning column widths, manually coloring status badges, and wrestling with PowerPoint layouts—time that should be spent on strategic customer discovery and architectural refinement.
This is where generic consumer AI slide generators fail disastrously. Tools like Gamma, Beautiful.ai, or standard LLM slide plugins are designed for lightweight marketing pitches or student presentations. When prompted with a complex enterprise product strategy, they generate cartoonish illustrations, simplistic bullet points, and superficial platitudes that destroy credibility in an executive boardroom. They lack the institutional consulting grammar—MECE issue trees, dual-parameter financial charts, quantitative feature benchmark matrices, and structured multi-horizon roadmaps—demanded by executive committees.
XLSlides is purpose-built to solve this enterprise workflow. By ingesting raw PRDs, strategic memos, financial spreadsheets, and customer feedback transcripts, XLSlides automatically structures content into consultant-grade slide architectures. It applies McKinsey-style action titles, enforces rigorous visual hierarchy, formats high-density comparative tables, and exports native, 100% editable PowerPoint (.pptx) files that seamlessly inherit your corporate master template.
By automating the mechanical friction of slide production, XLSlides allows product leaders to generate board-ready, mathematically sound product strategy decks in minutes, freeing leadership to focus on what truly matters: making high-conviction decisions that build durable, market-leading software businesses.
Institutional Product Strategy Deck Prompt Recipe
Role: Chief Product Officer (CPO) and Senior Partner in McKinsey's Technology & Enterprise Software Practice Context: You are preparing a high-stakes, decision-ready Product Strategy presentation for the Board of Directors, Chief Executive Officer, and Private Equity Operating Committee. The presentation must transition the board away from evaluating tactical feature backlogs and toward evaluating R&D capital allocation, defensible moats, multi-horizon outcome roadmaps, and Net Revenue Retention (NRR) expansion. Task: Generate a comprehensive, 10-slide executive Product Strategy presentation outline based on the following input parameters: Company Profile, Core Product Offering, Enterprise ICP, Annual Recurring Revenue (ARR), Gross Margin %, Target Growth Rate, Primary Competitors, and Proposed Strategic Initiatives. Core Instructions: 1. Enforce Answer-First Action Titles: Every slide must lead with a bold, complete-sentence action title summarizing the strategic takeaway, followed by a crisp sub-bullet quantifying the impact. 2. Structure the Deck Across 10 Core Slides: (1) Executive Summary & Strategic Mandate, (2) Market Landscape & Value Wedge, (3) Moat Defensibility Scatter Plot, (4) 70/20/10 R&D Portfolio Allocation, (5) Enterprise Capability & Moat Scorecard, (6) Customer Value Realization Architecture, (7) Multi-Horizon Strategic Roadmap (H1/H2/H3), (8) KPI & Financial Metric Architecture, (9) Resource & Capital Request, and (10) Boardroom Decision Gate & Risk Mitigation. 3. Ban Tactical Feature Lists: Frame all roadmap initiatives in terms of customer outcomes, business problem solved, and expected financial impact (e.g., 'Automated Multi-Tenant Provisioning yielding 75% reduction in onboarding latency and +350 bps Gross Margin expansion'). 4. Include Quantitative Data Tables & Matrices: Define specific rows, columns, and metric benchmarks for portfolio allocation, competitive benchmarking, and financial metrics. 5. Format for Native PowerPoint Export: Structure output using structured slide containers, clear hierarchy, bold emphasis, and data-dense layouts optimized for executive review. Output Format: A structured, slide-by-slide executive presentation plan with slide titles, visual layout blueprints, core analytical content, data tables, and speaker talking points.
Curated Internal Resources & Strategic Toolkits
Frequently Asked Questions: Product Strategy Presentations for C-Level & Boards
How many slides should be included in an executive product strategy presentation?
For an executive committee or board meeting, the primary presentation should strictly contain between 10 and 12 slides. Executive boards evaluate strategic direction, capital allocation, and business outcomes—not granular sprint details. A disciplined 10-slide deck covers: Executive Summary, Market Dynamics & Value Wedge, Moat Defensibility, 70/20/10 Portfolio Envelope, Capability Benchmark, Customer Value Realization Map, Multi-Horizon Roadmap, KPI Architecture, Capital Request, and Decision Gate. All supplementary documentation—detailed technical architecture diagrams, customer interview transcripts, win/loss analyses, and user persona deep dives—should be placed in an indexed Appendix.
How should product leaders handle missed roadmap commitments when presenting to the board?
Never attempt to gloss over or conceal missed delivery milestones. Executive boards immediately detect evasion, which permanently erodes trust. Address missed commitments on Slide 1 or 2 with extreme transparency and analytical discipline. Deconstruct the variance across three components: (1) Root Cause (e.g., unexpected architectural debt discovered in legacy billing API, emergency diversion of 3 engineers to patch critical zero-day vulnerability), (2) Commercial Impact (quantify pipeline or customer churn risk, if any), and (3) Corrective Action & Trade-offs (explain what non-essential initiatives were deprioritized to stabilize the core). When product leaders demonstrate rigorous command of trade-offs, boards treat setbacks as mature operational management rather than execution failure.
What is the difference between a product strategy presentation and a product roadmap?
A product roadmap is an operational schedule that communicates what capabilities engineering squads plan to build and release across specific timeframes. A product strategy, by contrast, is the overarching business thesis that explains why those capabilities matter, how they defend against competitors, how they unlock market share, and what return they generate on invested capital. A roadmap without a strategy is merely an unvetted feature wishlist; a strategy without a roadmap is an ungrounded hallucination. An executive product strategy presentation incorporates both: it establishes the strategic moat and portfolio allocation, then illustrates execution through an outcome-driven multi-horizon roadmap.
How do you present technical debt to non-technical board members and CFOs?
Never present technical debt using low-level engineering jargon such as 'refactoring database schemas', 'upgrading React versions', or 'decoupling legacy microservices'. CFOs and board members hear these terms as non-productive overhead. Instead, translate technical debt into balance sheet and P&L terminology: (1) Cost of Carry (annual maintenance dollars spent patching brittle legacy code), (2) Operational Drag (quantify that 30% of sprint capacity is consumed by bug triage rather than high-margin revenue features), (3) Customer Churn Risk (uptime degradation and latency SLAs), and (4) Compliance Vulnerability. Frame debt retirement as an investment with an explicit financial return: 'Allocating 12% of R&D to decouple the billing engine recovers $1.2M in annual engineering capacity and protects 99.98% uptime SLAs for enterprise renewals.'
How should a CPO present generative AI capabilities without sounding hype-driven?
In recent years, boardrooms have grown deeply cynical of superficial AI claims and generic chatbot demos. To present AI capabilities with executive credibility, ground them in proprietary workflow automation and customer economic outcomes. Contrast generic commodity wrappers with your proprietary system: 'Unlike consumer LLMs, our AI reasoning engine operates on 8 years of encrypted customer transaction logs, delivering 94% automated compliance verification and reducing manual auditor hours by 18 hours per account.' Focus on unit economics: model the gross margin impact of automated workflows, compute API token cost per transaction, and explain how data network effects create a self-reinforcing competitive barrier that generic AI vendors cannot penetrate.
How frequently should an enterprise product strategy be updated and presented to executive leadership?
The overarching strategic product vision (TAM, value wedge, structural moats) should be reviewed and refreshed annually as part of the corporate strategic planning and budgeting cycle. However, the operational execution layer—specifically Horizon 1 delivery velocity, Horizon 2 validation gates, and portfolio R&D allocation—should be reviewed quarterly with the executive committee and board. In addition, monthly product steering meetings between the CPO, CTO, CRO, and CFO ensure continuous alignment on commercial trade-offs and emergent market risks.
Can XLSlides export product strategy decks into fully editable native PowerPoint files?
Yes. Unlike web-first presentation tools that trap content in proprietary browser viewers or export static, uneditable PDF and image files, XLSlides exports native Microsoft PowerPoint (.pptx) files. Every shape, table cell, data chart, text block, and callout badge remains 100% editable vector objects. This allows enterprise product leaders and corporate strategy teams to incorporate generated slides directly into existing corporate PowerPoint master templates, tweak financial models, and adhere strictly to enterprise brand guidelines before stepping into the boardroom.
Transform Raw Product Strategy into Board-Ready Executive Decks in Minutes
Stop wasting 40 hours per quarter wrestling with PowerPoint formatting, misaligned table grids, and superficial slide bullets. XLSlides transforms your PRDs, strategic memos, financial spreadsheets, and customer research into institutional, McKinsey-grade product strategy decks that command boardroom conviction.
Methodology And Sources
- The Five Competitive Forces That Shape Strategy & The Discipline of Strategy(Harvard Business Review • 2008)
Foundational academic framework for analyzing industry structure, competitive defensibility, customer switching costs, and sustainable economic moats.
- How to Turn a Product Strategy into an Executive Decision Document(McKinsey & Company • 2024)
Strategic guidelines on structuring technology and product roadmaps around capital efficiency, commercial outcomes, and executive governance.
- The 70-20-10 Rule for Innovation and Product Portfolio Management(Boston Consulting Group (BCG) • 2023)
Framework for balancing core sustaining software investments (Horizon 1), adjacent product expansion (Horizon 2), and transformational R&D bets (Horizon 3).
- State of the Cloud: Unit Economics, CAC Payback, and Net Retention Benchmarks(Bessemer Venture Partners (BVP) • 2024)
Institutional benchmarking study establishing enterprise SaaS metrics: Net Revenue Retention (>120%), Gross Margin (>80%), and R&D efficiency hurdles.
- Transformed: Moving from Feature Teams to Product Strategy & Outcome Ownership(Silicon Valley Product Group (SVPG) • 2024)
Authoritative product leadership methodology detailing the transition from tactical delivery roadmaps to outcome-based executive product governance.