Executive Summary: The Boardroom Shift from Green Marketing to Fiduciary Capital Allocation
Key Takeaways: 6 Tenets of Executive ESG & Sustainability Presentations
- Double Materiality Over Single-Pillar Narrative: Mandate both Financial Materiality (outside-in impact on corporate enterprise value and cash flows) and Impact Materiality (inside-out impact on society and ecosystems) per EFRAG ESRS standards.
- Marginal Abatement Cost Curve (MACC) Discipline: Rank every decarbonization initiative by net dollar cost per metric ton of CO2 equivalent ($/tCO2e), demonstrating that energy efficiency and waste heat recovery fund higher-cost renewable transitions.
- Scope 3 Transparency & Value Chain Realism: Explicitly address the 70% to 85% of emissions sitting in upstream procurement (Category 1) and downstream product usage rather than obscuring value-chain exposure behind direct Scope 1/2 operations.
- Capital Allocation & Internal Carbon Shadow Pricing: Stress-test all major CapEx investments (> $5M) against an internal shadow carbon price of $75 to $125 per metric ton, proving long-term asset viability against future carbon taxes and CBAM tariffs.
- Assurance Readiness & Internal Controls: Establish an Audit Committee bridge for limited (and upcoming reasonable) third-party assurance over non-financial ESRS datapoints, mirroring Sarbanes-Oxley (SOX) internal control rigor.
- Executive Compensation Linkage: Tie 10% to 20% of executive short- and long-term incentive plans (STIP/LTIP) to verified, audited ESG reduction milestones to align management execution with board oversight.
The 5 Board ESG Presentation Archetypes: Audience, Mandate, and Core Exhibits
Exhibit 1: CSRD Double Materiality Matrix: Financial Materiality vs. Impact Materiality Across Strategic ESG Dimensions
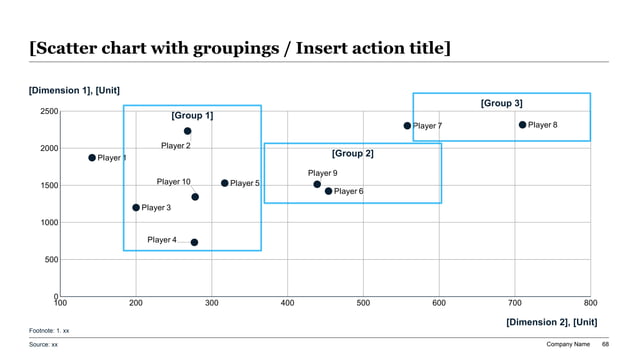
Deconstructing CSRD Double Materiality: How to Present Inward vs. Outward Impact Without Drowning in Datapoints
Pre-Board Double Materiality Verification Gate: 8 Tests Before Distributing Committee Decks
ESRS Topic Assessment & Quantitative Financial Impact Ledger
Exhibit 2: Enterprise Decarbonization Trajectory & Net-Zero Science-Based Milestones (2025–2035)
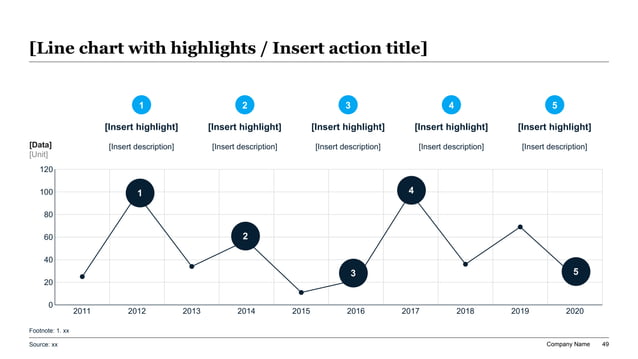
The Decarbonization Roadmap: Translating Net-Zero Science into 3 Distinct Abatement Horizons
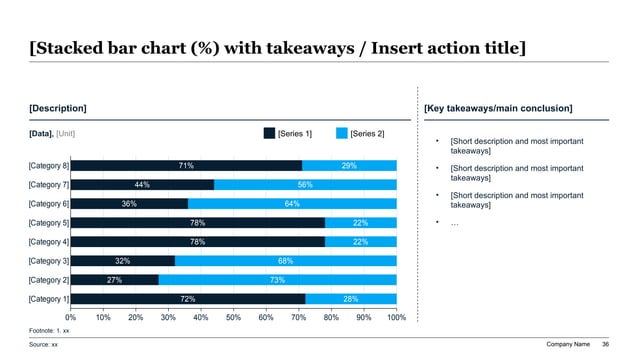
Exhibit 3: Scope 1, Scope 2, and Scope 3 Emissions Distribution Across Upstream and Downstream Categories
Marginal Abatement Cost Curve (MACC) Project Ledger: Prioritizing Capital for Maximum Carbon Efficiency
Exhibit 4: Transition CapEx Allocation & Marginal Abatement Cost Curve (MACC) by Operating Unit
ESG Rating Agencies & Institutional Investor Scrutiny: Defending Valuation and Cost of Capital
ESG Rating Agency Benchmark & Score Optimization Action Plan
Board Governance Architecture & Executive Compensation: Aligning Incentives with Statutory Fiduciary Duty
Exhibit 5: Board Sustainability Governance Architecture: Committee Mandates & Statutory Assurance Loop
Director Presentation Readiness Audit: 10 Fiduciary Pressure Tests for Board Sustainability Packets
Executive ESG Board Presentation Prompt Recipe for XLSlides
Act as a seasoned Chief Sustainability Officer (CSO) and elite management consulting partner (McKinsey Sustainability practice, BCG Climate, Bain & Company). Generate a comprehensive, 10-slide executive ESG and sustainability presentation for the Board of Directors and Sustainability Committee. Key Guidelines: 1. Executive Tone: Write with strategic authority, fiduciary rigor, and absolute absence of marketing fluff or greenwashing platitudes. Treat sustainability as a core balance-sheet capital allocation, enterprise risk management, and regulatory compliance discipline. 2. Structure & Flow: Follow the standard 10-slide executive board arc: - Slide 1: Executive Summary & State of Sustainability Fiduciary Governance (3-card overview of regulatory status, carbon velocity, and capital deployment) - Slide 2: CSRD Double Materiality Matrix (2-axis scatter matrix plotting Financial Materiality vs. Impact Materiality across core ESRS domains) - Slide 3: Scope 1, Scope 2, and Scope 3 Emissions Baseline & Value Chain Exposure (100% stacked horizontal bar chart breaking down upstream and operational emissions) - Slide 4: Science-Based Net-Zero Trajectory & Milestone Gating (10-year decarbonization line chart across Horizons 1, 2, and 3 with decision gates) - Slide 5: Marginal Abatement Cost Curve (MACC) & Transition CapEx Allocation (Project ledger ranking initiatives from -$78/tCO2e to +$58/tCO2e) - Slide 6: Supply Chain Scope 3 Decarbonization & Supplier Partnership Strategy (Top 150 supplier data onboarding, primary data capture, green procurement criteria) - Slide 7: Physical Climate Risk & Asset Hardening Assessment (IPCC climate scenario modeling, coastal PP&E Value at Risk, adaptation CapEx) - Slide 8: ESG Rating Agency Scorecard & Capital Market Impact (MSCI, S&P, CDP score gaps, borrowing spread linkage, passive ETF defense) - Slide 9: Audit Assurance & Internal Controls Over Sustainability Data (EFRAG/SEC readiness, internal controls environment, external limited assurance status) - Slide 10: Strategic Decisions & Capital Approvals Requested (Formal board voting resolutions on CapEx release and executive compensation ESG metrics) 3. Quantitative Grounding: Include realistic enterprise metrics: Scope 1-3 baseline (1.25M tCO2e), 2030 reduction target (-45%), 3-year transition CapEx ($42M), weighted average abatement cost (-$14/tCO2e), shadow carbon price ($100/tCO2e), and borrowing spread linkage (25 bps on $500M facility). 4. Slide Design: Use structured executive card panels, clean data tables, Harvey ball matrices, and clear bold takeaways. Ensure every slide features a bold action headline summarizing the executive conclusion.
Frequently Asked Questions: Executive ESG & Boardroom Sustainability Presentations
How should management handle the difference between European CSRD double materiality and SEC climate disclosure rules in a board deck?
For multinational enterprises operating in both jurisdictions, present a unified disclosure architecture where European CSRD represents the comprehensive superset. In the board presentation, clearly explain that CSRD ESRS mandates double materiality (both financial materiality and outward societal/environmental impact materiality), whereas the SEC climate rule focuses strictly on financial materiality (how climate physical and transition risks materially impact financial statements, business operations, and strategy). Provide a clean reconciliation exhibit demonstrating that data collected for ESRS E1 (Climate) fully satisfies SEC Scope 1 and Scope 2 disclosure requirements, preventing duplicate workstreams and eliminating board confusion.
What is the most common reason corporate boards reject sustainability transition CapEx requests, and how can CSOs overcome it?
Boards reject sustainability CapEx when it is presented in isolation as an unbudgeted compliance expense with vague qualitative benefits. CSOs overcome this resistance by presenting investments through a Marginal Abatement Cost Curve (MACC) framework. By bundling high-ROI energy efficiency projects (which have negative abatement costs and pay back in under 2 years) together with higher-cost renewable transitions, management presents a self-funding multi-year capital package. Furthermore, incorporating an internal shadow carbon price ($75 to $125/tCO2e) into discounted cash flow models directly demonstrates the downside financial risk of retaining legacy carbon-intensive equipment against future carbon border tariffs (CBAM) and emission trading penalties.
How should a board deck address Scope 3 emissions when supplier data is incomplete or based on industry estimates?
Never conceal Scope 3 data limitations from the board. Present Scope 3 emissions using a transparent data maturity tiered hierarchy: Tier 1 (certified supplier-specific activity data and product carbon footprints), Tier 2 (hybrid physical activity data such as kilowatt-hours or fuel liters), and Tier 3 (spend-based industry economic input-output modeling). Explicitly state the percentage of emissions covered by each tier (e.g., 'Currently 35% supplier-specific, 65% spend-based') and present a clear 3-year roadmap to increase Tier-1 supplier data coverage to > 75% for key categories like Purchased Goods and Services.
What role should carbon offsets play in an executive board presentation on decarbonization?
Carbon offsets must be strictly segregated from operational carbon abatement in executive slide presentations. Under Science Based Targets initiative (SBTi) standards and ESRS guidelines, corporate net-zero targets require at least 90% direct gross emissions reduction across Scopes 1, 2, and 3. Carbon credits cannot be counted as progress toward intermediate milestone reductions. In board decks, confine carbon credits to a clearly labeled 'Residual Neutralization' category reserved for the final 5% to 10% of emissions that are technologically impossible to abate by 2040–2050, and emphasize permanent, high-durability carbon removals (such as direct air capture or biochar) rather than cheap avoided-deforestation offsets.
How can the Audit Committee and Sustainability Committee collaborate effectively on non-financial reporting without duplicating effort?
Establish a formal joint liaison charter. The Sustainability Committee retains primary governance over strategic target-setting, stakeholder double materiality assessments, decarbonization technology roadmaps, and executive compensation ESG metrics. The Audit Committee assumes oversight of the internal control environment, ERP data integration, whistleblower hotlines regarding environmental claims, and external auditor relationship for limited/reasonable statutory assurance. A semi-annual joint committee session ensures that disclosures in the audited sustainability statement exactly match the risk disclosures in the Form 10-K or annual statutory financial accounts.
How much weight should be assigned to ESG metrics in executive incentive plans (STIP and LTIP)?
Governance best practices endorsed by major institutional asset managers recommend allocating 10% to 20% of the Short-Term Incentive Plan (STIP) annual cash bonus and 15% to 25% of the Long-Term Incentive Plan (LTIP) performance share units (PSUs) to audited sustainability metrics. Metrics must be formulaic, objective, and auditable (e.g., verified reduction in Scope 1/2 gross emissions, supplier engagement percentage, or lost-time injury rates). Avoid subjective qualitative milestones, and ensure that incentive awards are subject to standard compensation clawback provisions if underlying environmental data is subsequently restated.
Transform Complex ESG Disclosures into Boardroom-Ready Presentations
Methodology And Sources
- European Sustainability Reporting Standards (ESRS) under Corporate Sustainability Due Diligence and Reporting Directive (CSRD / Directive 2022/2464/EU)(European Financial Reporting Advisory Group (EFRAG) & European Commission)
- The Enhancement and Standardization of Climate-Related Disclosures for Investors (Release Nos. 33-11275; 34-99678)(U.S. Securities and Exchange Commission (SEC))
- Greenhouse Gas Protocol: Corporate Accounting and Reporting Standard & Corporate Value Chain (Scope 3) Standard(World Resources Institute (WRI) & World Business Council for Sustainable Development (WBCSD))
- IFRS S1 General Requirements for Disclosure of Sustainability-related Financial Information & IFRS S2 Climate-related Disclosures(International Sustainability Standards Board (ISSB))
- The Triple Play: Growth, Profit, and Sustainability in Corporate Strategy(McKinsey & Company Sustainability Practice & Harvard Business Review)