 XLSlides
Start with a magnet and a question
A rare earth map is most useful when a location leads to a question you can check. A mine can ship its concentrate to another continent before a single element is separated. A separation plant can sit thousands of kilometres from the magnet factory that buys its oxide. A border gate can carry most of a country's output without appearing in any production table. Begin with one asset, read the selected record and decide what the map actually establishes before drawing a wider conclusion.
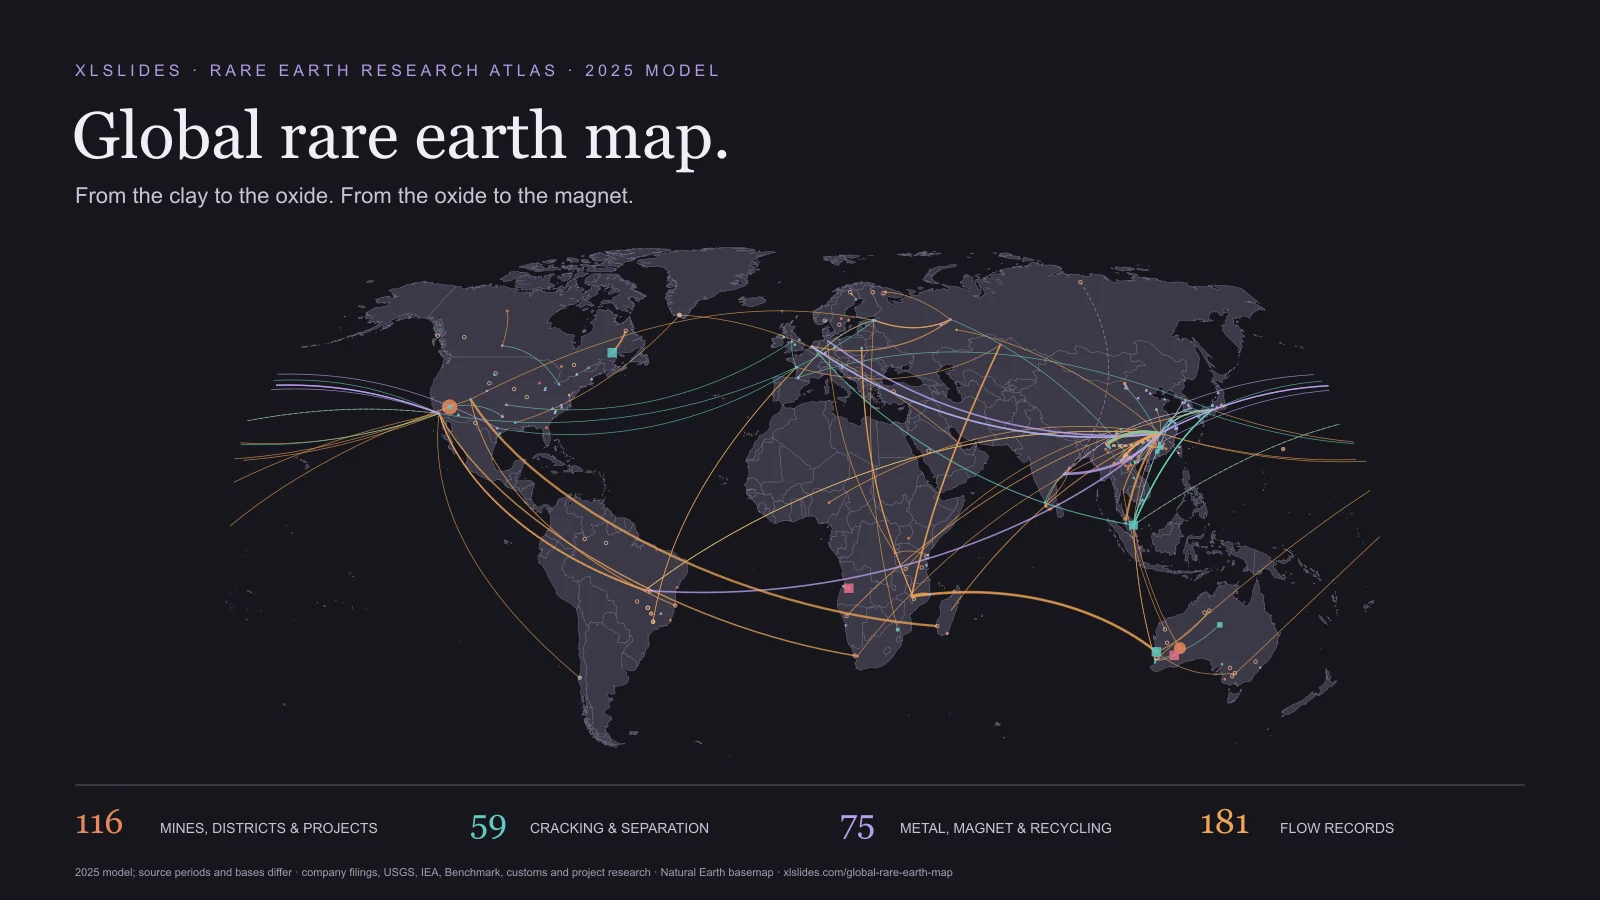
The atlas brings together the owner's documentary research on rare earth mines, ionic-clay mining districts and projects, concentrators and residue stores, cracking plants that turn mineral concentrate into mixed chemicals, separation plants that split those chemicals into individual oxides, metal and alloy plants, magnet factories and recycling plants. It adds ports, rail lines, border crossings, stockpiles, research sites and the headquarters of the companies and agencies involved, plus ore, oxide and magnet flows, money items such as royalties, state support and deals, and a table of sourced facts. Search for a mine, company, plant, port or country; select a result; then switch off the layers that are not relevant to your question.
The reference model is 2025, built into this explorer on 19 November 2026. That does not mean every number is a calendar-2025 observation. Some records use fiscal years ending in June 2026, some use part-year customs data, and some describe plans for 2027 and later. The page keeps those distinctions visible rather than presenting a live market monitor. It does not track prices, quotas, licences or shipments in real time.
Read rare earth oxide, NdPr and product weight
The rare earths are seventeen elements: the fifteen lanthanides plus scandium and yttrium. The name is misleading. In the USGS's words they are relatively abundant in the Earth's crust, but minable concentrations are less common. Most of the money is in four of them: neodymium and praseodymium, which make the strongest permanent magnets, and dysprosium and terbium, which are added in small amounts so those magnets keep working at high temperatures in motors.
The standard unit is tonnes of rare earth oxide, abbreviated REO (or TREO, total rare earth oxide). It measures the rare earth content of a product as if every element were an oxide, not the weight of the product itself. The USGS puts 2025 world mine output at about 390,000 tonnes of REO, up from 380,000 tonnes in 2024. Companies also report in other bases. NdPr oxide counts only the two magnet elements. Magnet tonnages count finished or semi-finished NdFeB blocks. Customs data usually record product weight: the gross weight of a concentrate, a mixed carbonate or a compound, which can be far larger than its oxide content.
The atlas keeps every figure in the basis the research wrote, and the selected panel names that basis. A plant recorded at 20,000 tonnes a year of mixed rare earth carbonate and a plant recorded at 4,440 tonnes a year of NdPr oxide are not comparable numbers, even though both are tonnes. Ore tonnages, rates per day or month and figures for heavy minerals or feed are shown as text only.
Follow the layers from clay to magnet
Mines and mining districts appear as rust circles. Only those with a single-site 2025 figure in tonnes of REO are drawn larger; everything else keeps the smallest size. Projects are open rings sized by planned REO capacity where the research gives one; many are years from production. Concentrators and residue stores are small diamonds beside the mines and plants they serve.
Cracking plants are rose squares and separation plants are teal squares, sized by recorded output or capacity in REO, NdPr oxide or mixed carbonate. Metal and alloy plants, magnet plants and recycling plants are blue, violet and green triangles, sized by metal or magnet tonnes. Ports, rail lines and border crossings are blue triangles pointing down, and stockpiles and bonded warehouses are gold diamonds. Research sites and headquarters and agencies are switched off by default because a laboratory or head office is not where rare earths are produced.
Flows are curves. Orange curves carry ore, concentrate, mixed carbonate and other raw material, teal curves carry separated oxides, metals and compounds, violet curves carry magnets, and dashed brown curves carry reagents, scrap and mixed shipments. Line width follows the recorded tonnage where there is one, whatever its basis.
Separate mining, separation, metal and magnets
China's position differs at every step, and each share comes from a different publisher and year. The owner's fact-check settles the ladder this way. Mining: about 69 percent in 2025, or 270,000 of 390,000 tonnes of REO (USGS). Separation and refining: about 85 percent in 2025, down from over 90 percent in 2023 (IEA Global Critical Minerals Outlook 2026; Benchmark Mineral Intelligence gives the same share of separated oxide). Sintered NdFeB magnets: about 94 percent (IEA, 2024 data). Dysprosium and terbium oxide: 99 percent in 2025 (Benchmark). For rare earth metal there is no primary figure; the IEA says that outside China only about 18,000 tonnes of rare earth metals, alloys and magnets are made, on a rare earth content basis.
The shares rise as the chain moves downstream, which is the main story the map tells. Ore from Myanmar, Laos, Malaysia and the United States has gone to Chinese separators. Australia's Mount Weld concentrate is separated in Malaysia, at Lynas's plant in Kuantan, which the fact-check describes as the biggest separation plant outside China. Mountain Pass in California mined a record 50,692 tonnes of REO in concentrate in 2025 and separated 2,599 tonnes of NdPr oxide on site, according to MP Materials. The model's magnet records outside China are mostly new, small or planned.
Separation is difficult to copy because it is a chemistry problem at industrial scale. The research cites one flowsheet model that needs 62 solvent-extraction stages just to split praseodymium from neodymium, and one study that took 379 stages to separate four elements to 99.99 percent purity. In December 2023 China rewrote its technology export catalogue to ban exporting extraction and separation know-how, formalising an older ban.
Read export controls as dated events
Export controls shape the 2025 and 2026 records, so read them with their dates. Since 4 April 2025, MOFCOM and customs Announcement 18 has required licences for samarium, gadolinium, terbium, dysprosium, lutetium, scandium and yttrium and for magnets containing them; those licences remain in force. On 9 October 2025 China issued six further measures, four of them on rare earths, including a rule that would have required a Chinese licence for foreign-made magnets and sputtering targets containing Chinese-origin controlled rare earths worth 0.1 percent or more of their value. Those measures were suspended on 7 November 2025 to 10 November 2026, and Announcement 58 of 2026, issued on 9 November 2026, extends the suspension to 10 January 2027.
The IEA estimates that if China fully enforced its October 2025 rules, about US$6.5 trillion a year of production outside China, in cars, electronics, defence and energy, could be at risk. That is an exposure estimate, not a loss. The model records concrete effects instead: China's magnet exports fell to 1,238 tonnes in May 2025 after the April licences, yet the 2025 total was 57,392 tonnes, only 1.3 percent below 2024 (Chinese customs via Reuters). Chinese customs recorded no dysprosium or terbium oxide shipments to Japan from late 2025 through June 2026.
Controls also produce two prices for one element. In early November 2026 dysprosium oxide cost about US$215 to 220 a kilogram in China and US$3,300 to 4,200 in bonded warehouses in Rotterdam, roughly 15 to 19 times more (SMM, 6 November 2026). Benchmark's measure of the gap reached 16.3 times at the end of September. Treat any price in the tables as a dated quote on a stated basis.
Read flows as documented relationships
A flow record links an origin and a destination named in the research: a mine to its port, a plant to a buyer, or a country to a country. Many tonnages are customs totals in product weight; others are contract volumes, planned offtakes or a part-year figure the research annualised and marked as modelled. The tables keep the basis and the period with every number.
The model gives endpoints as words, not coordinates. This explorer places an endpoint at a model site when the wording names one, otherwise at a country hub point taken from the owner's video build. The selected panel says how each end was placed, including where the match was made on name words. Endpoints such as "World", overseas buyers, unnamed customers or several countries at once are not drawn, so about a quarter of the flow records appear only in the table. A drawn line is a documented relationship or trade total between representative points, not a traced shipment.
Customs data have their own blind spots. China's imports include large volumes logged as "unlisted rare earth oxides", much of it mixed material from Myanmar and Laos. Myanmar supplied about 56 percent of China's rare earth raw material imports in 2025 and Laos about 25 percent, according to Antaike figures cited by the research. Several USGS country estimates, including Myanmar, Thailand and Madagascar, are themselves derived from China's import data. Avoid summing flows into a balance; origins, periods and bases differ.
Treat quotas, totals and modelled values carefully
China does not publish mine-by-mine output. It issues production quotas to its two state groups, China Northern Rare Earth and China Rare Earth Group, and in 2025 it issued them without publishing the numbers. The USGS carries China's figure forward from the last published quota. As a result the model's Chinese mines and clay districts carry wording such as "part of the national quota" but no site figure, and the atlas draws them at the smallest size. Small symbols in China therefore mean an unpublished figure, not a small mine.
Companies report in many ways too: by plant, by group, by fiscal year, at 100 percent or attributable share. The research keeps that wording. This explorer reads a number only when the text gives the record's own tonnage. Group, cluster and company totals are shown in full but do not set symbol size or enter sums. Two mine records, Mount Weld in Australia and Serra Verde in Brazil, carry a national USGS estimate that the research attributes to them as the only or main producer; the selected panel says so.
Values the research modelled are its own estimates: an annualised part-year figure, a share of a total, or a conversion of tonnes at a price. Values flagged for checking were not confirmed against a primary source in the research run. The selected panel spells out each modelled value in words and names every flagged field.
Separate reserves, resources and output
Output is what was produced in a period. Reserves are the part of a deposit that can be mined at a profit under stated price, cost and permitting assumptions. Resources are larger and less certain; resources are not reserves. The site records carry resource and grade figures where the research found them, with their own dates and reporting codes, so the atlas does not map or sum them.
The USGS puts world reserves at more than 75 million tonnes of REO, of which China holds about 44 million. Reserves move with reporting as well as geology. The research notes that the USGS cut Brazil's reserves to 11 million tonnes and Vietnam's to 3.5 million tonnes, which explains much of the fall in the world figure from earlier editions. Large announced discoveries, such as Kazakhstan's 2025 claim, are often ore tonnages rather than rare earth content; the fact-check reworks that claim to about 14,000 tonnes of contained rare earths, a modelled figure.
Keep the period, basis and verification beside the number
Only 3 of the 60 mine and mining-district records carry a single-site 2025 figure in tonnes of REO: Mountain Pass, Mount Weld and Serra Verde. Together they sum to about 81.7 thousand tonnes, against about 390 thousand tonnes of world mine output in the USGS estimate. The gap is coverage, not a correction: China publishes quotas rather than mine output, Myanmar's clay districts are estimated from Chinese customs data, and many records are projects. Treat the sum as an indicator of how much of the world the named records describe, never as a total.
Eighteen site records have no coordinates in the owner's model because their locations are undisclosed or not yet chosen, such as India's planned magnet plants and the Saudi refinery joint venture. They are in the tables and marked as not mapped. Confidence is uneven: most site records are rated low or medium by the research, and the research flags at least one field in most of them, most often notes, owner stakes, next products and capacities. A flag is not a correction; it tells you which fields need a primary source before they carry weight in a decision.
Use four starting points to test a story
Start with Bayan Obo in Inner Mongolia: an iron mine whose by-product made it the world's largest rare earth source. Its records show how output is reported through Baotou Steel's concentrate, about 314,000 tonnes of 50 percent REO concentrate in the first nine months of 2025, rather than by pit. Then open the Kachin clays at Pang War on the Myanmar–China border, where heavy rare earths are leached from clay and cross into Yunnan, and where control passed to the Kachin Independence Army in late 2024.
Use Lynas Kuantan to follow Australian ore through a Malaysian separation plant to buyers in Japan, including a March 2026 agreement under which Japan's JARE takes 5,000 tonnes a year of NdPr at a floor price of US$110 a kilogram. Then select Mountain Pass to read the largest producing mine outside China in the model, its 2025 output, its separation records and the July 2025 US Defense Department investment that came with a price floor for NdPr.
These starting points follow the documentary's path from deposit to magnet. They do not establish that a particular cargo made that journey. When an argument needs that connection, add contract, customs or company evidence appropriate to the claim.
Build a presentation around inspectable evidence
Choose one decision question before exporting a map image: dependence on Chinese separation, exposure to dysprosium and terbium licences, the gap between planned magnet capacity outside China and China's output, or the effect of a single border closure. Use the map for location and relationships, then a small table for quantities. Keep the unit, basis, period and verification status next to the conclusion, and date every share and price.
Avoid a crowded slide that asks a reader to infer the whole model. Show the relevant region or layer, state the observation in the headline and keep the source limitation in a legible note. The consulting presentation guide can help structure the argument; the global copper atlas, global gold atlas, global oil atlas, global gas atlas and global coal atlas provide companion views of other commodity systems.
Retain attribution when reusing the downloadable snapshot. The JSON contains the rendered atlas, the parsed readings and the provenance notes, not every research file in the source project, such as the price, control, history and demand tables. Review publisher terms and verify the inputs central to your conclusion.