 XLSlides
Start with an ounce and a question
A gold map is most useful when a location leads to a question you can check. A mine can sit near a refinery without sending its doré there. A vault can hold metal owned by central banks, exchange members and private investors at the same time. A smuggling line can describe a documented corridor without showing who carried which bar. Begin with one asset, read the selected record and decide what the map actually establishes before drawing a wider conclusion.
The atlas brings together the owner's documentary research on named mines and projects, small-scale mining areas, refiners, vaults, trading hubs and buying centres, doré routes, selected customs trade flows and documented smuggling or sanctions-bypass routes. Search for a mine, company, refiner, vault, route or country; select a result; then switch off the layers that are not relevant to your question. The full explorer adds searchable and sortable tables for reserves, countries and companies that are not drawn on the map.
The reference model is 2025, imported on 7 November 2026. That does not mean every number is a calendar-2025 observation. Some mine inputs describe fiscal years, some smuggling estimates describe earlier years or multi-year averages, and vault holdings carry their own reporting dates. The page keeps those distinctions visible rather than presenting a live gold market monitor. It does not track prices, shipments or holdings in real time.
Read tonnes, ounces, grade and cost
Mine output in the atlas is expressed in metric tonnes of gold, abbreviated t, and for mines also in thousand troy ounces, koz. One troy ounce is 31.1035 grams, so one tonne is about 32,151 troy ounces. Company reports usually publish ounces; national statistics and the World Gold Council usually publish tonnes. Converting between them is arithmetic, but rounding in either source can make two honest figures look slightly different.
Reserves and resources are usually reported in million troy ounces, Moz. Grade is reported in grams of gold per tonne of ore, g/t. A grade describes rock, not metal: a large low-grade open pit and a small high-grade underground mine can produce similar amounts of gold from very different volumes of ore. Recovery rates, processing routes and dilution all sit between the grade in the ground and the ounces poured.
All-in sustaining cost, often written AISC and quoted in US dollars per ounce, is a company-defined industry metric. It typically includes operating costs, sustaining capital and some overheads, but definitions differ between companies and between by-product and co-product accounting. Treat an AISC value as the operator's own disclosure for its reporting period, not as a harmonised global cost curve. Company revenue and profit in the companies table describe whole groups, which often mine copper, silver or other metals too.
Follow the layers from mine to vault
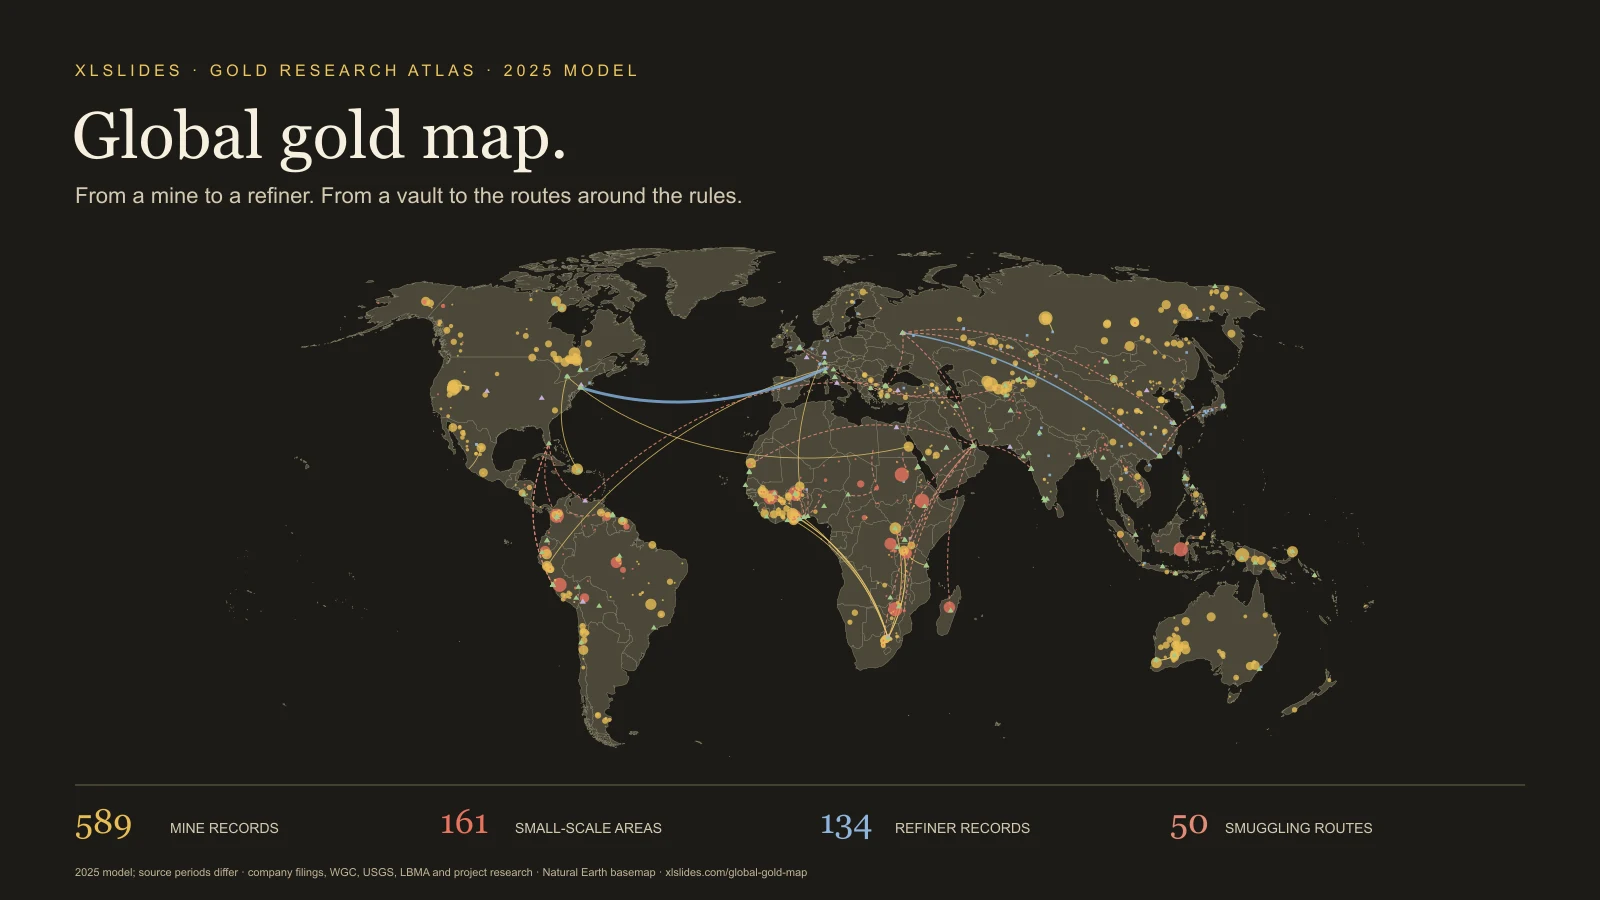
Gold mines appear as gold circles. A point can represent one mine, a mining complex or a project that is under construction, ramping up or on care and maintenance. Many projects carry no 2025 output. The selected panel shows status, reference output, source input year, basis, reserves, grade, cost, deposit type, process route, operator, owners, confidence, research notes and the source.
Small-scale mining areas appear as red circles. Most are hotspots or national aggregates rather than individual sites; the next section explains why their numbers need special care.
Refiners appear as blue squares. The layer combines the LBMA Good Delivery lists, including former listings, with national and regional refineries from the research. Refiner capacity, output and ownership come from different sources and often conflict; the panel keeps the source wording. Symbol size is a display scale only.
Hubs, vaults and buying centres appear as triangles. Exchanges and trading hubs, central-bank and commercial vaults, and national buying or export points have very different roles. A vault holding is a stock on a stated date. A buying centre describes a channel through which gold is purchased, not a measured annual throughput unless the record gives one.
Routes appear as curves. Gold curves are doré routes from mines to refiners and selected 2025 customs trade flows between hubs. Dashed dark-red curves are documented smuggling or sanctions-bypass routes. All of them are drawn between representative locations.
Treat small-scale mining as an estimate
Artisanal and small-scale gold mining is a large share of the gold story in West Africa, the Sahel, East Africa, the Andes and Southeast Asia, and it is the hardest to measure. Much of it is informal or illegal, paid in cash and sold through traders who report little. The atlas records the estimate its research found for each area: from a government buying agency, a central bank, a non-governmental organisation, a satellite study or a press report.
Those tonnages are rough. Most small-scale records are labelled low confidence, and many areas carry no number at all. A national aggregate drawn at a single coordinate is a way of putting a country estimate on the map, not the location of one pit. Do not add small-scale estimates from different methods into a precise regional total, and do not read an empty value as zero production.
Each small-scale record also lists the legal status, mercury use, who controls the activity and the buyers and export routes where the research found them. These are descriptive fields drawn from reports of varying quality. They indicate where to look for evidence, not a verified finding about a named group or person.
Separate reserves, resources and output
Output is what was produced in a period. Reserves are the part of a deposit that a company or agency judges economic to mine under stated assumptions about price, cost and permits. Resources are a broader estimate of mineralisation, including material that may never be mined. Resources are not reserves, and neither is a measure of annual supply.
Reserves move with the gold price. When the price rises, lower-grade material can become economic and reported reserves can grow without a single new hole being drilled. A reserve life can also end because a licence ends rather than because the rock does. Company reserves are generally reported on a 100% basis, regardless of how much the reporting company owns.
The atlas includes company reserves for named deposits and country reserve totals from the USGS Mineral Commodity Summaries 2026. The owner's fact-check records that the USGS 2026 country figures were transcribed in research and not re-read from the source PDF; treat them as provisional until checked against the publication. The world reserve headline in the explorer is labelled accordingly.
Read refiners and vaults as institutions
Refiners turn doré, scrap and small-scale gold into bars of a known purity. The LBMA Good Delivery list sets standards for bars accepted in the London market. A current listing is a statement about accreditation and audit requirements; it is not proof of the origin of every bar a refiner handles. Former listings matter too, because a refiner can be removed, suspended or choose to leave, and some records describe exactly that.
Vaults hold stock. The London vault figure, 9,821 tonnes at 30 September 2026, is a reported total for LBMA members' vaults including the Bank of England. It mixes central-bank, institutional and exchange-traded fund holdings. Central-bank vault figures come from different publications and dates, and some are long-standing approximations. Read the date in the selected record before comparing two vaults.
A hub such as an exchange or trading centre describes market activity, not a single warehouse. A buying centre or export point describes a channel, frequently state-controlled, through which gold leaves a producing country. Record these as institutions with roles, not as interchangeable dots of the same quantity.
Read routes as documented relationships
A doré route links a mine to the refiner named in a filing or report. In most cases its tonnage is the mine's 2025 output, which the research marks as modelled, not a measured shipment. A mine can sell to several refiners over time, and a tender can change the buyer from one period to the next.
Trade flows are selected 2025 customs totals between countries, drawn between representative cities. Customs data records declared movements; a large flow can reflect bar recasting, vault rebalancing or a tariff scare rather than new mine supply.
Smuggling lines run from an origin to the first documented stop, not a traced path. Their volumes are estimates, often for earlier years, multi-year averages or cumulative periods, and some routes are lawful flows shown because they bypass sanctions. The selected panel gives the period, controller, note, confidence and source for each. Avoid summing these estimates into an annual total.
Keep the period, basis and verification beside the number
The atlas keeps mixed source periods. Most named mine records use 2025, but others use fiscal years ending in 2025 or 2026, 2024 values or a modelled calendar-2025 figure. Each named mine also carries a basis: reported by the company, read from a secondary source, modelled from a national total, or not recorded, which is common for projects without output.
Country comparisons on this page use the owner's best country estimates, which add small-scale estimates to mine output. They sum to 3,551.5 tonnes against the World Gold Council's 3,671.6 tonnes for 2025. Some countries deliberately use official statistics that differ from the WGC figure; Mexico and Mali are the clearest cases, and the gap in Mali is attributed to unrecorded artisanal output.
The owner's research marks many records for checking, and some cite background knowledge that was not re-verified in the research run. The original companion map hid those markers. This adaptation shows them in a Verification field and turns modelled markers into plain words. A flag is not a correction; it tells you which records need a primary source before they carry weight in a decision.
Use four starting points to test a story
Start with Muruntau to read a large mine record whose output is modelled from its operator's group total. Compare the reference output, the basis, the input year and the notes. Then open Valcambi to see how capacity, accreditation, ownership and conflicting sources sit in one refiner record.
Use London vaults to read a stock on a stated date and its context. Then select the Ghana → Togo route to see how a smuggling estimate describes a multi-year average from one research source, with its period, controller and confidence alongside.
Together these starting points follow the documentary's ounce from a mine, through a refiner and a vault, and around the rules. They do not establish that a particular ounce made that journey. When an argument needs that connection, add contract, customs, refinery due-diligence or enforcement evidence appropriate to the claim.
Build a presentation around inspectable evidence
Choose one decision question before exporting a map image: concentration of supply, exposure to small-scale or conflict-affected sources, refining and vaulting geography, or a country's reliance on informal exports. Use the map for location and relationships, then a small table for quantities. Keep the unit, period, basis and verification status next to the conclusion.
Avoid a crowded slide that asks a reader to infer the whole model. Show the relevant region or layer, state the observation in the headline and keep the source limitation in a legible note. The consulting presentation guide can help structure the argument; the global oil atlas, global gas atlas and global coal atlas provide companion views of other commodity systems.
Retain attribution when reusing the downloadable snapshot. The JSON contains the rendered atlas and its provenance notes, not every research CSV in the source project, such as the control, demand, price and stock tables. Review publisher terms and verify the inputs central to your conclusion. This page makes the model easier to inspect; the strength of a recommendation still depends on matching the evidence to the question.