STEM Education Impact Report Presentation Template

Stop wasting hours on manual formatting. Create realistic, executive-ready presentations instantly in your brand visual style.

Skill gain and participation outcome slides
Equity, access, and career-pathway dashboards
Funding ROI and KPI status report pages

1What a STEM Education Impact Report Needs to Prove

A STEM education impact report needs to prove that the program reached the intended learners, improved meaningful skills, supported equitable access, and created a credible path toward future education or careers. The opening section should define the program mission, target population, intervention model, reporting period, and evaluation question. It should show whether the program focuses on classroom enrichment, after-school learning, robotics, coding, career exposure, teacher training, scholarships, or workforce pathways. A strong impact report connects activities to measurable outcomes and explains evidence quality. This gives education leaders, program directors, funders, school partners, teachers, evaluators, workforce boards, community organizations, PMOs, and consultants enough evidence to assess reach, skill gains, equity outcomes, teacher capacity, pathway progress, funding ROI, and improvement priorities. The narrative should also define data sources, cohort rules, comparison points, KPI owners, reporting cadence, and decision gates for each program year and annual funder reporting cycle before funding renewal decisions and board planning.
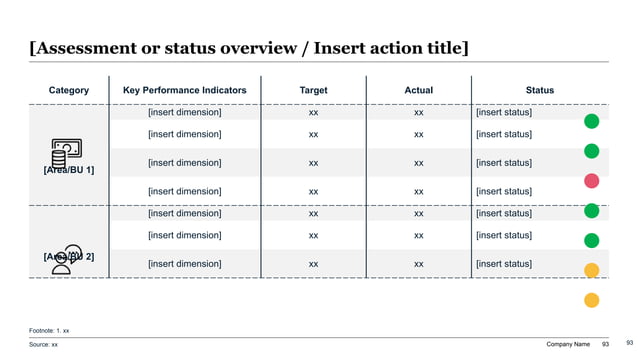
Strategic KPI status table slide for STEM education impact reporting with targets, actuals, skill gains, equity metrics, and funding ROI.
Template Design LayoutSTEM Education Impact Report Presentation Template

2Who This Template Is Built For

This template is built for teams that need to communicate STEM education outcomes with rigor and clarity. Nonprofit program teams can use it to report reach, engagement, and student growth. School districts can use it to evaluate enrichment, intervention, and career-readiness initiatives. Funders can use it to understand whether grants improved access and outcomes for priority learners. University outreach teams can use it to document community impact and pipeline development. Evaluators and consultants can use it to structure findings, methods, limitations, and recommendations. This gives education leaders, program directors, funders, school partners, teachers, evaluators, workforce boards, community organizations, PMOs, and consultants enough evidence to assess reach, skill gains, equity outcomes, teacher capacity, pathway progress, funding ROI, and improvement priorities. The narrative should also define data sources, cohort rules, comparison points, KPI owners, reporting cadence, and decision gates for each program year and annual funder reporting cycle before funding renewal decisions and board planning.

3Program Model and Theory of Change

The program model section should explain how STEM activities are expected to produce outcomes. Slides can map inputs, activities, outputs, short-term outcomes, medium-term outcomes, and long-term impact. Inputs may include funding, curriculum, mentors, equipment, teacher training, school partnerships, industry volunteers, and technology platforms. Activities may include labs, projects, competitions, tutoring, workshops, internships, teacher coaching, and family engagement. Outcomes may include STEM confidence, problem-solving, computational thinking, math readiness, science achievement, course enrollment, credential completion, or career interest. The theory of change should make assumptions explicit. This gives education leaders, program directors, funders, school partners, teachers, evaluators, workforce boards, community organizations, PMOs, and consultants enough evidence to assess reach, skill gains, equity outcomes, teacher capacity, pathway progress, funding ROI, and improvement priorities. The narrative should also define data sources, cohort rules, comparison points, KPI owners, reporting cadence, and decision gates for each program year and annual funder reporting cycle before funding renewal decisions and board planning.

4Participation, Reach, and Equity Metrics

The reach section should show who participated and whether the program served the intended communities. Useful slides include student count, school count, grade level, geography, demographic profile, socioeconomic indicators, first-generation status, English learner status, disability status, gender representation, attendance, completion, and repeat participation. Equity pages should compare access and outcomes across groups while respecting privacy and sample-size limitations. The deck should also show where outreach did not reach target learners and what barriers remain. Impact is stronger when participation data is connected to program design and community need. This gives education leaders, program directors, funders, school partners, teachers, evaluators, workforce boards, community organizations, PMOs, and consultants enough evidence to assess reach, skill gains, equity outcomes, teacher capacity, pathway progress, funding ROI, and improvement priorities. The narrative should also define data sources, cohort rules, comparison points, KPI owners, reporting cadence, and decision gates for each program year and annual funder reporting cycle before funding renewal decisions and board planning.

5Skill Gains and Learning Outcomes

The outcomes section should show whether learners improved in the skills the program intended to build. Useful metrics include pre- and post-assessments, project rubrics, coding challenges, science reasoning tasks, math readiness, engineering design performance, collaboration, problem-solving, confidence, persistence, and interest in STEM subjects. The deck should explain how outcomes were measured, what comparison points are available, and where evidence is directional rather than causal. It should also include examples of student work or project artifacts when appropriate. Strong impact reporting makes learning gains specific and measurable. This gives education leaders, program directors, funders, school partners, teachers, evaluators, workforce boards, community organizations, PMOs, and consultants enough evidence to assess reach, skill gains, equity outcomes, teacher capacity, pathway progress, funding ROI, and improvement priorities. The narrative should also define data sources, cohort rules, comparison points, KPI owners, reporting cadence, and decision gates for each program year and annual funder reporting cycle before funding renewal decisions and board planning.

6Teacher Capacity and Implementation Quality

STEM programs often depend on educators and facilitators, so the report should explain implementation quality. Slides can cover teacher training hours, facilitator readiness, curriculum fidelity, coaching participation, classroom adoption, lesson completion, equipment availability, technology access, mentor engagement, and implementation barriers. The deck should show which sites implemented the model strongly and which need more support. It should also summarize teacher feedback, observed challenges, and capacity-building priorities. Implementation quality matters because weak delivery can hide the potential of a strong program design. This gives education leaders, program directors, funders, school partners, teachers, evaluators, workforce boards, community organizations, PMOs, and consultants enough evidence to assess reach, skill gains, equity outcomes, teacher capacity, pathway progress, funding ROI, and improvement priorities. The narrative should also define data sources, cohort rules, comparison points, KPI owners, reporting cadence, and decision gates for each program year and annual funder reporting cycle before funding renewal decisions and board planning.

7Career Pathways and Long-Term Outcomes

The pathway section should connect near-term STEM learning to longer-term education and workforce outcomes. Useful slides include advanced course enrollment, STEM club participation, certifications, internships, mentorship, dual enrollment, college applications, major interest, credential completion, job placement, and alumni tracking. For younger students, pathway metrics may focus on confidence, exposure, identity, and continued participation. The deck should be honest about which outcomes can be measured during the reporting period and which require longitudinal tracking. Funders and partners need to see how short-term program activity contributes to a larger talent pipeline. This gives education leaders, program directors, funders, school partners, teachers, evaluators, workforce boards, community organizations, PMOs, and consultants enough evidence to assess reach, skill gains, equity outcomes, teacher capacity, pathway progress, funding ROI, and improvement priorities. The narrative should also define data sources, cohort rules, comparison points, KPI owners, reporting cadence, and decision gates for each program year and annual funder reporting cycle before funding renewal decisions and board planning.

8Funding ROI and Partner Contribution

The funding section should explain how resources translated into program delivery and outcomes. Useful pages include budget allocation, cost per participant, cost per completion, staff time, technology cost, equipment investment, volunteer hours, partner contributions, in-kind support, and funding restrictions. ROI slides should connect funding to reach, skill gains, teacher capacity, equity access, and pathway outcomes without overstating causality. The deck should also identify where additional funding would expand capacity, improve quality, or deepen measurement. Clear funding logic helps grantmakers and boards decide whether to renew, scale, or redesign support. This gives education leaders, program directors, funders, school partners, teachers, evaluators, workforce boards, community organizations, PMOs, and consultants enough evidence to assess reach, skill gains, equity outcomes, teacher capacity, pathway progress, funding ROI, and improvement priorities. The narrative should also define data sources, cohort rules, comparison points, KPI owners, reporting cadence, and decision gates for each program year and annual funder reporting cycle before funding renewal decisions and board planning.

9KPI Dashboard and Evidence Quality

The KPI section should summarize performance against targets in a way leaders can act on. Metrics may include students served, completion rate, attendance, assessment gain, confidence gain, teacher participation, partner engagement, pathway conversion, cost per learner, and equity reach. Each KPI should have a baseline, target, actual, status, owner, data source, and interpretation note. Evidence quality pages should explain sample size, missing data, survey limitations, comparison groups, and measurement improvements planned for next year. A transparent impact report is more credible when it acknowledges limits and improves methods. This gives education leaders, program directors, funders, school partners, teachers, evaluators, workforce boards, community organizations, PMOs, and consultants enough evidence to assess reach, skill gains, equity outcomes, teacher capacity, pathway progress, funding ROI, and improvement priorities. The narrative should also define data sources, cohort rules, comparison points, KPI owners, reporting cadence, and decision gates for each program year and annual funder reporting cycle before funding renewal decisions and board planning.

10Recommendations and XLSlides Workflow

The recommendations section should translate findings into the next program cycle. Actions may include expanding high-performing sites, improving recruitment, revising curriculum, increasing teacher coaching, strengthening partner engagement, improving data collection, adding pathway supports, or changing funding allocation. The roadmap should define immediate fixes, next-year priorities, and longer-term scale decisions. XLSlides helps teams convert surveys, assessment results, participation files, budget notes, partner updates, and evaluation findings into a structured STEM impact report. The generated draft can then be refined with exact program data, student stories, funder language, and board-ready recommendations. This gives education leaders, program directors, funders, school partners, teachers, evaluators, workforce boards, community organizations, PMOs, and consultants enough evidence to assess reach, skill gains, equity outcomes, teacher capacity, pathway progress, funding ROI, and improvement priorities. The narrative should also define data sources, cohort rules, comparison points, KPI owners, reporting cadence, and decision gates for each program year and annual funder reporting cycle before funding renewal decisions and board planning.