Direct Answer: What A Spreadsheet-To-Presentation Workflow Must Deliver
A spreadsheet-to-presentation workflow should do more than move numbers from Excel into PowerPoint. Serious teams already have the arithmetic. What they usually lack is a fast way to convert that arithmetic into a decision document that a board member, investment committee, executive sponsor, or operating partner can read in minutes. The workflow has to surface the answer, show the bridge from raw data to conclusion, and make the resulting deck editable enough for finance, strategy, and leadership review.
That means the best output is not a screenshot of tabs, a dump of rows, or a chart gallery with descriptive headings. It is a narrative sequence where each slide answers a business question. One page may explain why revenue beat plan but gross margin still compressed. Another may show which assumptions create most of the valuation range. Another may turn a monthly KPI pack into three management interventions. The spreadsheet remains the evidence source, but the presentation becomes the operating artifact.
For XLSlides, the product fit is direct. Finance teams already work in spreadsheets because that is where the data lives: actuals, forecasts, scenario cases, peer comps, valuation tabs, KPI exports, and budget bridges. The expensive part is translating those files into investor-ready slides with action titles, reviewable visuals, and source-note discipline. AI should accelerate the translation layer, not replace financial judgment. The human owner still decides what belongs in the main story, what stays in appendix backup, and which conclusion is strong enough to present.
When A Workbook Has To Become A Decision Deck
The same spreadsheet can support very different presentations. The audience determines what the deck must prove and which exhibits belong in the main flow.
| Situation | What The Spreadsheet Usually Contains | What The Slide Deck Must Add | What Reviewers Will Challenge |
|---|---|---|---|
| Board reporting | Monthly actuals, forecast updates, KPI exports, bridge tabs | Answer-first summary, performance drivers, explicit management asks, and decision timing | Whether the deck explains the change or only reports the number |
| Investment committee review | Valuation model, sensitivity tabs, peer set, downside cases | Price posture, risk framing, assumption hierarchy, and confidence level by exhibit | Whether the case depends on a fragile assumption hidden in the model |
| Investor update | Runway, growth metrics, retention, product milestones, cash plan | Narrative discipline, selective exhibit choice, and a clean bridge from traction to funding story | Whether management is showing signal or overwhelming investors with operating detail |
| Operating review | Budget vs actual data, team commentary, action logs, regional cuts | Variance logic, owner-based interventions, and clear priorities for leadership attention | Whether the misses have causes and named actions |
| Consulting or strategy recommendation | Market model, scenario math, cost cases, benchmark tables | Storyline, trade-off framing, action titles, and recommendation logic | Whether the deck moves from analysis to an explicit decision |
| Fundraising or diligence preparation | Data room extracts, operating model tabs, customer cohorts, cap table details | Audience filtering, coherent sequencing, and appendix discipline | Whether the materials feel defensible outside the finance team |
From Spreadsheet Tabs To Board-Level Narrative
Workbook Intake Checklist Before AI Drafting
Why Raw Spreadsheet Exports Break Down In Executive Reviews
Teams often assume that if the workbook is correct, the deck is almost finished. In practice, that is where most of the work starts. A spreadsheet is optimized for calculation, reconciliation, and scenario flexibility. An executive deck is optimized for fast interpretation under time pressure. The same information architecture rarely serves both jobs. Rows that are useful for the analyst become clutter for the board member. A carefully linked model can still create a confusing slide if nobody decides what one page is supposed to prove.
This is why many spreadsheet-based decks feel unready even when the numbers are right. They inherit the structure of the workbook: tabs become sections, labels become headlines, and charts appear because the data is available rather than because the exhibit advances the decision. The audience then has to do the synthesis live. Executives end up asking basic questions such as what changed, why it changed, which variable matters most, and what management wants approved. When the deck cannot answer those questions quickly, confidence in the analysis drops even if the model itself is solid.
The better approach is to treat the spreadsheet as raw material and the presentation as an editorial product. Start with the decision, rank the supporting evidence, and decide which visuals deserve page-level attention. The deck should summarize what the workbook implies, not reproduce the workbook mechanically. AI becomes useful only after that editorial frame exists. Without it, the model is likely to generate a technically plausible but strategically weak deck.
Bridge Analysis Into A Slide-Level Message
Recommended 10-Slide Sequence For Spreadsheet-Driven Decks
This sequence works for finance, board, and investor contexts because it moves from answer to proof to action instead of following workbook tab order.
| Slide | Purpose | Question It Answers |
|---|---|---|
| Executive answer | State the recommendation or performance conclusion in plain language | What should I believe before I open the detail? |
| Decision frame | Explain why this topic matters now | Why is leadership reviewing this now? |
| Headline scorecard | Show the small number of metrics that define the story | Which numbers matter most? |
| Variance or value bridge | Translate line items into causal movement | What moved the result up or down? |
| Scenario or sensitivity page | Show how much the answer depends on key assumptions | How robust is the conclusion? |
| Evidence exhibit 1 | Present the strongest supporting chart or table | What proof best supports the answer? |
| Evidence exhibit 2 | Add the next-most important supporting angle | What else would a skeptical reviewer ask to see? |
| Risks and caveats | Surface what the model does not fully solve | Where is judgment or uncertainty still material? |
| Implication and next step | Turn the analysis into an action boundary or decision request | So what should management, the board, or investors do? |
| Appendix and sources | Preserve workbook detail, metric definitions, and backup tables | Where can I verify the support if I want to go deeper? |
Prompt Recipe For Turning Spreadsheet Analysis Into Investor-Ready Slides
Create a 10-slide spreadsheet-to-presentation deck for a CFO, CEO, and board finance committee reviewing Q2 performance and the updated second-half outlook. Inputs come from spreadsheet tabs containing actuals versus budget, a revenue bridge, EBITDA bridge, cash forecast, customer retention cohorts, and three scenario cases. Build an answer-first executive summary, decision frame, headline KPI scorecard, bridge slide, scenario sensitivity slide, two supporting exhibits, explicit risk notes, and a final management ask. Rewrite spreadsheet labels into action titles, keep every exhibit editable in PowerPoint style, add source-note placeholders, and avoid dumping worksheet structure directly onto slides.
Map Each Spreadsheet Output To The Right Slide Type
The fastest way to improve deck quality is to stop treating every tab as if it deserves the same presentation format.
| Spreadsheet Output | Best Slide Type | Why It Works | What To Avoid |
|---|---|---|---|
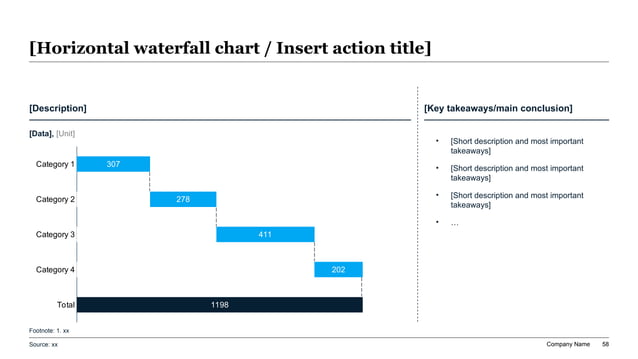
| Budget vs actual bridge | Waterfall or driver bridge | Shows movement and causality instead of raw variance lines | Large tables with no visual explanation |
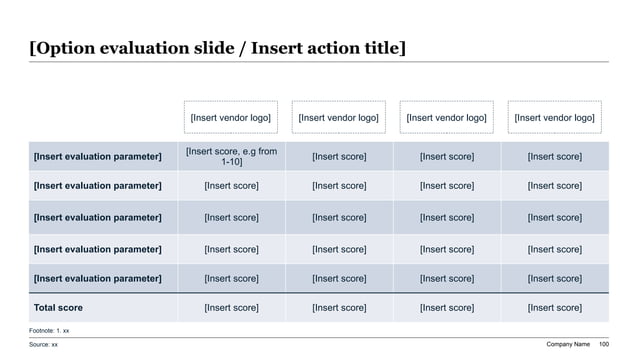
| Scenario case tabs | Sensitivity matrix or scenario comparison page | Makes assumption differences visible and decision-relevant | Presenting three full financial statements side by side |
| Peer or market comp tables | Prioritized comparison table or positioning chart | Helps the reader see relative standing quickly | Copying the entire comp sheet into the main story |
| Monthly KPI exports | Executive scorecard with a small set of metrics | Filters reporting noise down to management signal | Fifteen charts competing for attention on one page |
| Retention or cohort data | One focused chart with takeaway callouts | Lets the audience see the pattern before reading the math | Dense cohort heatmaps without interpretation |
| Valuation or return model | Summary range, bridge, and scenario slide set | Separates the answer from supporting mechanics | A single screenshot of the DCF tab |
Evidence Scoring Reference For Exhibit Selection
Final Review Checklist Before Circulation
Rewrite Spreadsheet Labels Into Action Titles
Spreadsheet exports tend to inherit worksheet labels. Executive decks need conclusion headlines instead.
| Worksheet Label | Executive Action Title | Why The Rewrite Is Better |
|---|---|---|
| Revenue bridge | Price discipline offset volume softness, keeping revenue above plan despite slower enterprise conversion | It states the conclusion rather than naming the artifact |
| Scenario analysis | Only two assumptions meaningfully change the downside case: churn and implementation margin | It tells the reader what matters in the scenario page |
| Cash forecast | Collections timing, not spend growth, is now the main constraint on second-half liquidity | It turns a forecast into a management implication |
| Valuation sensitivity | The valuation range remains defensible unless margin recovery slips beyond Q4 | It connects model output to a decision boundary |
| Regional performance | North America carried the quarter while EMEA execution drift created most of the forecast risk | It narrows attention to the business split that matters |
| Next steps | Management should lock the cost response this month and revisit the growth plan after two pipeline checkpoints | It converts summary bullets into a concrete ask |
Drafting Workflow Reference For Recurring Finance Reporting
XLSlides Resources For Finance And Executive Reporting
What AI Should Automate And What Finance Leaders Must Still Judge
AI is valuable in spreadsheet-to-presentation work because the input environment is fragmented and repetitive. There are workbook tabs, scenario cuts, notes from finance, comments from operating teams, prior board feedback, and often several versions of the same export. XLSlides can help by consolidating those inputs into a first-pass storyline, recommending slide groupings, drafting action titles, and laying out charts in a format that is readable rather than spreadsheet-shaped. That removes a large amount of manual formatting work without forcing the team to start from a blank page.
What AI should not decide on its own is the final business judgment. It cannot know whether a management team is comfortable elevating a soft forecast into the main narrative, whether a one-time cost should stay normalized, whether a downside scenario is politically sensitive, or whether the audience will prefer a detailed operating view versus a narrow decision summary. Those choices depend on trust, governance, and the exact context of the meeting. The finance owner, operator, or consultant must still decide what claim is defensible.
The right operating model is therefore asymmetric. Let AI handle the first-pass assembly and the conversion of raw workbook structure into a coherent deck scaffold. Then let finance leaders pressure-test the headlines, validate every metric, cut unsupported exhibits, and sharpen the final ask. That is how a spreadsheet-to-presentation workflow becomes faster without becoming careless.
Executive Considerations Reference
Failure Modes That Make Spreadsheet-Based Decks Look Unready
Most poor finance decks do not fail because the math is wrong. They fail because the presentation still behaves like a workbook.
| Failure Mode | What It Looks Like | Better Standard |
|---|---|---|
| Worksheet inheritance | The deck follows tab order instead of decision logic | Re-sequence the pages around the answer, proof, and action |
| Label headlines | Titles say Revenue, Margin, Scenario, or Cash Forecast | Rewrite every title as a message the audience can test |
| Chart overproduction | Every possible export becomes a slide even when signal is low | Promote only the exhibits that materially change the conclusion |
| No uncertainty framing | The deck shows one base case as if it were settled fact | Make the sensitive assumptions visible and show the range |
| Appendix collapse | Main story and backup support are mixed together | Keep the core deck tight and move verification detail into appendix space |
| Missing source discipline | Finance reviewers cannot trace a page back to a tab or export | Preserve source-note placeholders and a clean exhibit lineage |
Recurring Reporting Cadence Reference
Turn The Workbook Into An Executive Draft In XLSlides
Use XLSlides to convert spreadsheet exports, scenario tabs, finance commentary, and decision notes into an editable slide draft with action titles, bridges, scorecards, and appendix-ready backup structure.
Generate Spreadsheet-To-Deck Draft