Executive Summary: Why S&OP Decks Fail in the Boardroom and How to Fix Them
Sales and Operations Planning (S&OP)—and its strategic evolution, Integrated Business Planning (IBP)—represents the operational heartbeat of enterprise manufacturing, consumer packaged goods (CPG), industrial technology, life sciences, and omni-channel retail corporations. At its core, S&OP is not a software system, an inventory calculation, or a supply chain department routine; it is an executive decision-making governance process designed to synchronize commercial market demand, plant manufacturing capacity, distribution logistics, and financial budget commitments into a single, binding operating plan.
Yet despite multi-million-dollar enterprise resource planning (ERP) and advanced planning system (APS) investments (SAP IBP, Kinaxis, Blue Yonder, OMP), the monthly Executive S&OP review remains notoriously dysfunctional across Global 2000 enterprises. Corporate executives routinely experience the same recurring boardroom pathology: Commercial Sales enters with unconstrained, hockey-stick revenue targets designed to ensure quota buffer; Manufacturing Operations presents defensive plant utilization constraints and labor shift limits; Finance presents an annual operating plan (AOP) variance reconciliation that neither side recognizes; and the Chief Supply Chain Officer (CSCO) is left moderating an contentious, 80-slide presentation filled with 7pt font Excel spreadsheet screenshots and microscopic pivot tables.
When an S&OP presentation degenerates into an audit of competing spreadsheet formulas, executive decision-making collapses. Board members, Chief Executive Officers (CEOs), and Chief Financial Officers (CFOs) tune out. Unresolved operational bottlenecks are swept under the rug, leading to the dual corporate penalties of supply chain failure: catastrophic stockouts on high-margin strategic product lines alongside millions of dollars in trapped working capital, finished goods inventory write-downs, and expedited freight premiums.
An institutional, consultant-grade S&OP presentation solves this governance failure by enforcing answer-first executive communication. Instead of dumping raw data onto slides, an effective S&OP deck is structured around three foundational axioms: First, establish a single version of operational truth where demand, supply, and financial numbers are pre-reconciled prior to the executive session. Second, translate physical operational trade-offs (machine hours, lead times, safety stocks, minimum order quantities) into dollarized P&L outcomes (gross margin impact, cash flow burn, EBITDA variance). Third, replace passive operational status updates with structured, scenario-driven decision requests that require formal C-suite sign-off.
This comprehensive guide details the institutional architecture required to build high-stakes S&OP and IBP presentations. Designed for Chief Supply Chain Officers, Chief Operating Officers, Heads of Demand Planning, S&OP Directors, FP&A leaders, and operations consulting practitioners, this playbook outlines the standard 5-stage monthly meeting cadence, slide-by-slide deck architectures, quantitative metric formulas, rough-cut capacity planning scorecards, scenario reconciliation frameworks, and executive governance checklists necessary to drive C-suite alignment.
Core Principles of Executive-Ready S&OP Presentations
The 5-Stage Monthly S&OP Meeting Cadence, Deliverables, RACI Owners & Escalation Triggers
A disciplined S&OP cycle operates on a rigid 4-week monthly rhythm where each stage generates an auditable deliverable that feeds the subsequent review.
| S&OP Stage | Timing in Month | Primary Executive Owner | Core Deck Deliverable | Mandatory Attendees | Key Governance Escalation Triggers |
|---|---|---|---|---|---|
| Stage 1: Product Management Review (Portfolio / NPI) | Days 1-5 (Week 1) | VP Product Management / Head of R&D | NPI Phase-In / Phase-Out Roadmap, cannibalization models, and SKU rationalization list | Product Managers, R&D Leads, Marketing Directors, Supply Chain Engineering | NPI launch date slippage > 4 weeks; SKU tail generating < 2% revenue but consuming 15% plant changeover capacity; regulatory homologation delays. |
| Stage 2: Demand Review (Unconstrained Consensus) | Days 6-10 (Week 2) | VP Sales Operations / Head of Commercial Demand Planning | Unconstrained Consensus Demand Plan, statistical baseline, commercial uplift waterfall, and WAPE/Bias scorecard | Regional Commercial Sales VPs, Channel Marketing Leads, Demand Planners, Key Account Managers | Forecast bias exceeding +/- 5% for three consecutive cycles; key customer promotion volume surge > 25% without contractual volume commitments; major contract win/loss. |
| Stage 3: Supply Review (Constrained Capability) | Days 11-15 (Week 3) | VP Global Manufacturing / VP Supply Chain Logistics | Rough-Cut Capacity Plan (RCCP), plant utilization heatmap, supplier Tier-1 risk matrix, and inventory projection bridge | Plant Managers, Procurement Directors, Logistics Leads, Master Production Schedulers (MPS) | Plant bottleneck line utilization > 92% across a 12-week window; single-source raw material supplier force majeure; container freight transit delays > 14 days. |
| Stage 4: Financial Pre-S&OP (Gap Reconciliation) | Days 16-19 (Week 4) | Director of S&OP / VP Corporate FP&A | Dollarized P&L Gap Analysis against AOP/Budget, 3 reconciled operating scenarios, and executive decision memo | S&OP Director, Corporate Controller, VP FP&A, Supply Chain Operations VP, Sales Operations VP | Projected quarterly revenue shortfall against budget > $5M; gross margin dilution > 150 bps due to overtime/expedites; inventory build exceeding bank covenant working capital caps. |
| Stage 5: Executive S&OP (C-Suite Consensus Sign-Off) | Days 20-22 (Week 4) | Chief Executive Officer (CEO) / Chief Operating Officer (COO) | Binding Executive Operating Plan, approved capital allocation / overtime authorizations, and signed escalation record | CEO, CFO, COO, CSCO, Chief Revenue Officer (CRO), General Counsel | Customer allocation rationing across tier-1 vs. tier-2 accounts; unbudgeted multi-million dollar CapEx for tooling; second-source qualification expenditures. |
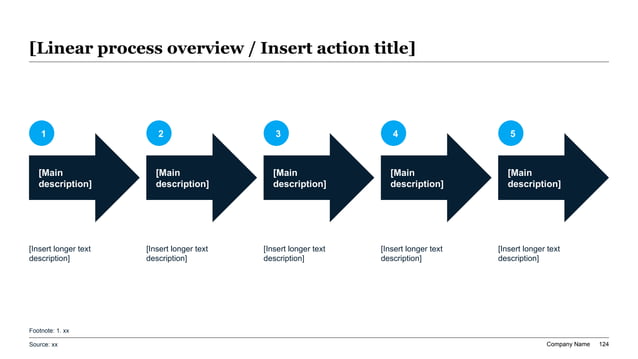
Exhibit 1: The 5-Step Monthly S&OP Governance Cycle & Cross-Functional Cadence
The Demand Review Slide Architecture: Unconstrained Forecasts, WAPE, and Commercial Bias
The Demand Review represents the critical commercial foundation of the S&OP process. Its single overriding objective is to determine true, unconstrained market demand over an 18-to-24 month rolling horizon. In corporate practice, however, the Demand Review is plagued by two destructive commercial behaviors: commercial 'sandbagging' (artificially lowering demand forecasts to guarantee sales incentive target achievement) and end-of-quarter 'hockey-stick optimism' (speculative pipeline inflation entered to appease executive leadership).
An executive-ready Demand Review deck eliminates subjective bias by enforcing a multi-layered forecasting architecture. The presentation must disaggregate the demand signal into three auditable mathematical components: First, the Statistical Baseline Forecast, generated via time-series econometric algorithms (ARIMA, Holt-Winters, machine learning models) based strictly on historical point-of-sale (POS) consumption, order patterns, and seasonal indices. Second, Commercial Intelligence Uplifts, representing verified customer promotions, marketing campaigns, price adjustments, and tender bids documented with win-probability weightings. Third, New Product Introduction (NPI) incremental volumes reconciled directly with Stage 1 portfolio timelines.
To establish commercial accountability, the Demand Review deck must present two foundational forecasting metrics at both the aggregate family and regional SKU level: Weighted Absolute Percentage Error (WAPE) and Forecast Bias Tracking. WAPE measures absolute forecast deviation weighted by product volume, preventing low-volume erratic SKUs from distorting the aggregate supply picture:
WAPE = (SUM |Actual Demand - Forecast Demand|) / (SUM Actual Demand)
Forecast Bias measures directional tendency over a 3-month to 6-month trailing rolling period, mathematically proving whether commercial teams systematically over-forecast (generating excess inventory and write-downs) or under-forecast (causing line starvation, stockouts, and emergency logistics expedites):
Forecast Bias = (SUM (Forecast Demand - Actual Demand)) / (SUM Actual Demand)
When presenting the Demand Review to executive leadership, slides must never present a single static forecast line. The core exhibit must be a Demand Waterfall Bridge that traces the walk from the prior cycle's consensus demand to the current proposal. The bridge isolates structural demand changes: baseline statistical shifts, market expansion, customer churn, promotional cannibalization, and macro headwinds. By making the forecast walk transparent, sales leadership is forced to explain specific volume variances rather than retreating behind general market volatility.
Core S&OP Operating Metrics & Governance Thresholds
Rigorous S&OP governance requires establishing quantitative thresholds that automatically trigger operational root-cause deep-dives and executive escalations.
| Operating Metric | Measurement Formula / Definition | Best-in-Class Target | Amber / Warning Zone | Red / Escalation Trigger | Governance Action Required |
|---|---|---|---|---|---|
| Weighted Absolute Percentage Error (WAPE) | (SUM |Actual - Forecast|) / SUM Actual (Measured at 1-month and 3-month lag) | < 12% at family level; < 20% at SKU level | 12% - 18% family; 20% - 30% SKU | > 18% family; > 30% SKU | Commercial sales lead must submit formal demand attribution report detailing customer churn or promotion failure. |
| Forecast Bias (Directional Skew) | (SUM (Forecast - Actual)) / SUM Actual (Evaluated over trailing 3-month rolling window) | Within +/- 3% (Balanced) | +/- 4% to +/- 8% | > +8% (Over-forecasting) or < -8% (Under-forecasting) | Executive override of commercial forecast; algorithmic statistical baseline automatically enforced as supply planning input. |
| Rough-Cut Plant Utilization (OEE) | Overall Equipment Effectiveness = Availability x Performance x Quality Rate | 82% - 88% (Optimal balance of productivity and surge flexibility) | 88% - 92% (Limited buffer for unplanned downtime) | > 92% (Imminent stockouts) or < 65% (Severe fixed cost under-absorption) | Stage 4 Pre-S&OP escalation to authorize weekend shifts, third-party contract manufacturing (co-packing), or capital equipment tooling. |
| On-Time In-Full (OTIF) Delivery | (Orders Delivered on Customer Request Date with Complete Quantities) / Total Orders | >= 98.0% for Tier-1 Strategic Accounts; >= 95.0% for Tier-2 | 92.0% - 94.9% | < 92.0% | Immediate CSCO executive deep-dive into warehouse fulfillment bottlenecks, stockout attribution, and carrier linehaul performance. |
| Days of Inventory Outstanding (DIO) | (Average Finished Goods + Raw Material Inventory / COGS) x 365 Days | Target Policy Window +/- 5 Days (e.g., 45-50 Days) | Policy Window +/- 6 to 12 Days | > 15 Days Above Target Policy (Trapped Cash) or < 15 Days Below (Stockout Risk) | CFO and VP Supply Chain review of safety stock parameters, slow-moving inventory reserves, and promotional liquidation programs. |
| Master Production Schedule (MPS) Adherence | (Actual Units Produced Matching Planned MPS Within Frozen Horizon) / Total Planned Units | >= 95.0% adherence within frozen 2-week window | 88.0% - 94.9% | < 88.0% | Plant operations audit of machine breakdown frequency, raw material shortages, and unauthorized emergency production schedule breaks. |
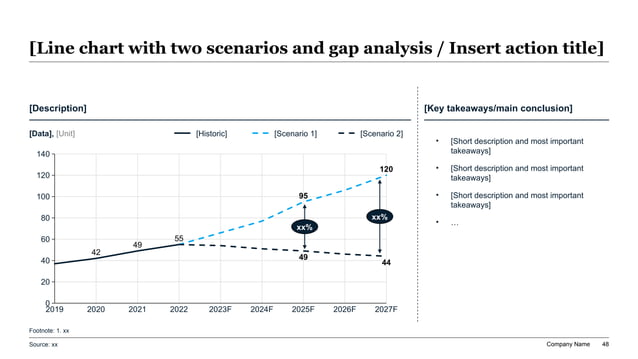
Exhibit 2: Demand vs. Supply Reconciliation: Unconstrained Forecast vs. Plant Capacity Constraints
The Supply Review Architecture: Rough-Cut Capacity Planning (RCCP) and Critical Bottlenecks
While the Demand Review establishes what the commercial market wishes to buy, the Supply Review establishes what the enterprise can realistically produce, package, procure, and distribute. In elite supply chain organizations, the Supply Review deck does not attempt to display granular shop-floor machine routing or daily dispatch sequences. Instead, it operates at the Rough-Cut Capacity Planning (RCCP) level across a 3-to-18 month tactical planning horizon.
Rough-Cut Capacity Planning evaluates aggregate manufacturing and logistics capability across four critical constraint dimensions: First, Machine Tooling and Asset Availability, evaluating rated line speeds, planned preventive maintenance windows, and tooling changeover downtime. Second, Direct Labor Headcount and Shift Patterns, modeling regular 5-day shifts, overtime allowances, weekend shifts, and local labor market hiring/training lead times. Third, Tier-1 and Tier-2 Raw Material and Component Supply Constraints, mapping supplier contractual capacity caps, minimum order quantities (MOQs), and component lead times. Fourth, Warehouse Storage and Logistics Distribution Capacity, evaluating pallet storage positions, cold-chain capacity, and regional distribution center (DC) cross-dock throughput.
The showpiece exhibit of an institutional Supply Review deck is the Plant Bottleneck Utilization Heatmap. Rather than reporting average plant utilization (which dangerously obscures localized line starvation), the heatmap maps demand load against demonstrated effective capacity across every manufacturing facility, production line, and critical work center over the rolling 12-month schedule. Lines operating in the 'Green Zone' (70% to 85% utilization) demonstrate healthy operating margins and sufficient surge capacity. Lines entering the 'Amber Zone' (85% to 92%) signal emerging risk where minor equipment breakdowns or raw material delays trigger delivery failures. Lines in the 'Red Zone' (> 92%) represent structural operational failure points where demand exceeds physical throughput.
When line utilization breaches the Red Zone, the Supply Review deck must present the operational levers available to expand capacity along with their direct financial costs: Authorizing overtime shifts (calculating premium wage rates and margin drag); Adding weekend production crews (factoring in 4-to-6 week hiring and onboarding cycles); Qualifying third-party co-manufacturers or external tollers (analyzing transfer pricing premiums, freight differentials, and quality audit timelines); or Pre-building inventory during seasonal valley months (calculating warehouse holding costs, working capital financing interest, and inventory obsolescence risks).
The Pre-Meeting Operational Hygiene & Data Reconciliation Checklist
Exhibit 3: Rough-Cut Capacity Planning (RCCP) & Plant Bottleneck Utilization Scorecard
The Pre-S&OP Financial Bridge: Reconciling Operational Constraints with Budget and P&L Targets
Stage 4, the Financial Pre-S&OP meeting, represents the pivotal analytical bridge in the entire monthly cycle. This is where the unconstrained demand ambitions of Stage 2 and the physical manufacturing constraints of Stage 3 collide with the corporate Profit and Loss (P&L) statement. If the Pre-S&OP meeting is conducted effectively, 90% of cross-functional operational disputes are resolved before the Chief Executive Officer and executive committee ever walk into the boardroom.
The primary failure mode of traditional supply chain presentations is expressing operational trade-offs purely in physical volume units (e.g., 'We are short 45,000 cases in Facility B due to Line 4 motor downtime'). To a Chief Financial Officer or Board Director, physical units lack decision-making context. The Pre-S&OP deck must translate every physical operational imbalance into four dollarized financial metrics: Revenue at Risk ($ millions in unfulfilled customer orders); Gross Margin Dilution (basis point contraction resulting from expedited air freight, overtime labor premiums, or contract packaging fees); Inventory Holding Carrying Cost (cash consumed by pre-building safety stocks in external 3PL warehousing); and Operating Working Capital Impact (movement in Days Sales Outstanding [DSO] and Days Inventory Outstanding [DIO] against banking credit facility covenants).
The centerpiece of the Pre-S&OP presentation is the Annual Operating Plan (AOP) Gap-Closing Waterfall. This bridge starts with the current fiscal year budget commitment, walks through unconstrained commercial demand adjustments, strips out capacity-constrained volume shortfalls, factors in product mix shifts, and incorporates operational cost variances to arrive at the projected net EBITDA landing point.
When the projected financial outcome falls short of corporate targets, the Pre-S&OP team must not present a passive list of grievances. Instead, the team must construct three mutually exclusive, fully evaluated operating scenarios for C-suite decision: Scenario A (Growth Maximization), Scenario B (Balanced Base Operating Plan), and Scenario C (Margin and Cash Protection). Each scenario must clearly specify which customer orders are fulfilled, which plants operate overtime, what working capital is required, and what net EBITDA is delivered.
Pre-S&OP Scenario Planning Framework: Evaluating Operational and Financial Trade-Offs
When demand and supply diverge, Pre-S&OP must present executive leadership with three fully costed operational scenarios rather than an unresolved debate.
| Decision Parameter | Scenario A: Unconstrained Growth Maximization | Scenario B: Constrained Balanced Operating Plan | Scenario C: Margin & Cash Protection (Defensive) |
|---|---|---|---|
| Commercial Fulfillment Strategy | Fulfill 100% of unconstrained demand across all customer tiers; accept all spot promotional volumes and speculative tenders. | Prioritize Tier-1 Strategic Accounts (100% fulfillment); enforce contractual volume caps on Tier-2 and spot accounts. | Ration supply exclusively to top-margin Tier-1 SKUs; actively de-commit unprofitable low-margin promotional volumes. |
| Manufacturing & Logistics Operating Posture | Run all domestic plants at maximum 7-day 24/7 overtime; engage premium third-party co-packers; authorize transatlantic expedited air freight. | Run 6-day scheduled production across primary plants; utilize pre-qualified co-manufacturers within agreed volume tranches; standard ocean/intermodal freight. | Strict 5-day production schedule; zero overtime authorized; eliminate external co-packing; enforce strict full-truckload (FTL) shipping rules. |
| Gross Margin % & EBITDA Impact | Revenue: $148.5M (+12% vs. Budget); Gross Margin: 36.2% (-280 bps vs. Budget); EBITDA: $22.4M (-$1.8M vs. Budget due to expedites and overtime). | Revenue: $139.0M (+5% vs. Budget); Gross Margin: 38.6% (-40 bps vs. Budget); EBITDA: $25.2M (+$1.0M vs. Budget via disciplined operating leverage). | Revenue: $128.0M (-3% vs. Budget); Gross Margin: 41.5% (+250 bps vs. Budget); EBITDA: $26.8M (+$2.6M vs. Budget via mix optimization and cost discipline). |
| Working Capital & Inventory Profile | DIO: 58 Days (+12 Days above policy); Trapped Cash: $18.5M; Substantial risk of post-quarter finished goods obsolescence write-downs. | DIO: 48 Days (+2 Days above policy); Trapped Cash: $3.2M; Balanced safety stock buffers preserving delivery SLAs across core product families. | DIO: 41 Days (-5 Days below policy); Trapped Cash: -$8.4M (Cash generated); Highly lean inventory; vulnerability to unexpected supplier disruptions. |
| Customer SLA & Strategic Relationship Risk | Zero delivery cuts; strong commercial relationship expansion; high risk of internal plant fatigue, equipment breakdown, and quality scrap. | Tier-1 OTIF maintained at 98.2%; Tier-2 OTIF drops to 91.5%; managed commercial communication required for unfulfilled spot demand. | High customer friction on deprioritized accounts; potential loss of shelf-space in secondary retail channels; pristine Tier-1 service levels. |
| Executive Decision Required (Stage 5 Ask) | CEO & CFO approval of $3.2M unbudgeted overtime and co-packing budget; waiver on quarterly DIO working capital targets. | Executive sign-off on commercial demand rationing rules for Tier-2 accounts; authorization of $650K standard overtime pool. | Executive sign-off on formal SKU rationalization and commercial price increase notifications to deprioritized product accounts. |
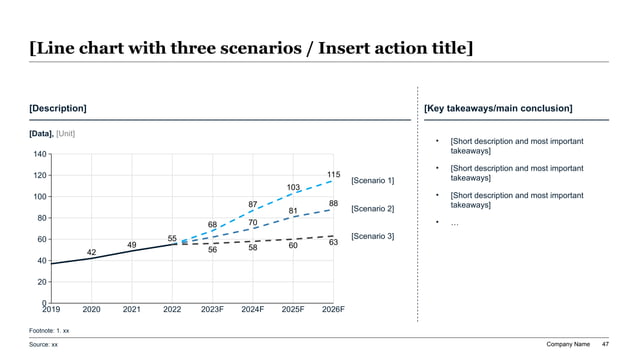
Exhibit 4: Pre-S&OP Multi-Scenario Trade-Off Evaluation: Base Plan vs. Commercial Upside vs. Constrained Allocation
Executive S&OP Boardroom Protocol: Presenting Trade-Offs, Escalations, and Capital Decisions
Stage 5, the Executive S&OP review, is the apex of corporate operational governance. It is a 45-to-60 minute structured decision session chaired by the Chief Executive Officer or Chief Operating Officer and attended by the executive leadership team: CFO, CSCO, Chief Revenue Officer, Chief Marketing Officer, and General Counsel. The most common boardroom disaster is treating Executive S&OP as a 60-slide technical presentation where department heads take turns reading operational metrics.
In world-class organizations, the Executive S&OP deck is ruthlessly concise—rarely exceeding 8 to 12 core slides. Pre-read materials, detailed plant bottleneck analyses, and statistical forecasting variance tables are relegated to the technical appendix. The executive deck adheres to a strict four-part narrative protocol:
Part 1: The Executive One-Pager (Dashboard of Consensus Numbers). A single consolidated slide displaying the agreed consensus demand volume, supply capability, projected ending inventory, cash flow impact, and P&L bridge against budget for the rolling 18-month horizon. It highlights critical variances that developed over the trailing 30 days and confirms performance against prior-month executive commitments.
Part 2: Strategic Assumptions & Market Shifts. A structured review of major macro shifts: material commodity price fluctuations (crude, steel, resins, agricultural inputs), interest rate/currency swings, key competitor actions, customer contract tenders won or lost, and regulatory policy updates.
Part 3: Cross-Functional Escalations & Scenario Decisions. This is the heart of the meeting, consuming 70% of the executive agenda. The S&OP Director presents the pre-evaluated operational scenarios (Scenario A vs. Scenario B vs. Scenario C from Stage 4). The deck frames the exact decision required: 'Does executive leadership authorize $1.8M in premium overtime and co-packing to capture $9.5M in unconstrained commercial upside, or do we enforce Tier-2 customer allocation rationing to protect gross margin % and working capital cash?'
Part 4: Capital Allocation & Policy Sign-Off. Formal approval of multi-million dollar capital expenditure requests (tooling molds, packaging automation), major supplier allocation commitments, seasonal pre-build inventory financing, and customer allocation prioritization rules. At the conclusion of the meeting, the CEO and functional heads formally sign off on the Consensus Operating Plan, which becomes the single legally binding baseline for procurement purchase orders, plant schedules, and financial earnings guidance.
The Executive S&OP Meeting Decision Readiness & C-Suite Governance Audit
Enterprise Prompt Recipe: Transforming Disjointed ERP, CRM, and Supply Chain Spreadsheet Exports into an Executive-Ready S&OP Presentation Deck
Act as an expert supply chain management consultant and executive presentation strategist specializing in Oliver Wight Integrated Business Planning (IBP) and APICS S&OP methodology. I need you to convert raw operational data and functional spreadsheet exports into an institutional, decision-ready Executive S&OP presentation deck for the CEO, CFO, COO, and CSCO. Context & Inputs: 1. Demand Review Data: Unconstrained commercial sales forecast vs. statistical baseline by product family, 3-month trailing WAPE, and Forecast Bias metrics. 2. Supply Review Data: Plant line utilization percentages across 6 manufacturing sites, critical equipment bottleneck hours, supplier Tier-1 component delivery lead times, and projected finished goods inventory DIO. 3. Financial Plan Data: Current fiscal year Annual Operating Plan (AOP) revenue, gross margin %, and EBITDA commitments vs. unconstrained demand projections. Deliverables: 1. Executive Summary Action Slide: Write a one-page answer-first executive summary with a strong action title, summarizing the net operational-financial imbalance, root causes, and three strategic choices. 2. 5-Stage S&OP Cadence Walk: Outline the monthly governance deliverables, showing where operational friction was resolved and what requires C-suite escalation. 3. Three Detailed Operating Scenarios: Structure Scenario A (Unconstrained Growth), Scenario B (Balanced Base Plan), and Scenario C (Margin/Cash Protection) comparing Revenue ($M), Gross Margin (%), EBITDA ($M), Inventory DIO (Days), and Tier-1 Customer OTIF (%). 4. Action Titles & Slide Architecture: Draft crisp, consultant-grade action titles for 10 slides that tell a complete decision narrative without reading body bullets. 5. Boardroom Escalation Memorandum: Draft the exact executive decision request detailing required capital expenditure approvals, overtime authorizations, customer allocation rules, and named executive owners.
What AI Should Automate in S&OP Decks vs. What Demands Human Executive Judgment
Artificial intelligence and automated slide generation tools like XLSlides are fundamentally transforming how corporate supply chain organizations prepare for monthly S&OP cycles. Historically, senior demand planners, supply chain analysts, and FP&A managers squandered hundreds of hours each month performing mundane manual tasks: copying data from ERP exports, reformatting Excel pivot tables, aligning text boxes, and manually updating recurring waterfall slides.
AI excel at automating data synthesis, structural consistency, and visual layout generation. Specifically, AI should automate: First, Data Ingestion and Cleansing: Consolidating disparate data feeds across CRM pipelines, ERP master production schedules, and warehouse management systems (WMS) into normalized analytical structures. Second, Automated Metric Calculation: Instantly computing statistical variance, WAPE, forecast bias, and OEE utilization across hundreds of SKU families. Third, Dynamic Bridge and Waterfall Generation: Automatically rendering consensus demand-to-supply bridges, margin dilution walks, and inventory trajectory curves directly from spreadsheet inputs. Fourth, Consultant-Grade Action Title Drafting: Translating quantitative operational deviations into crisp, takeaway-first headlines that instantly inform executive readers.
However, AI must never be mistaken for a substitute for human executive judgment. In high-stakes supply chain governance, several critical responsibilities demand human leadership: Strategic Trade-Off Decisions: An algorithm can calculate the gross margin differential between air freight and ocean transit, but only the executive leadership team can evaluate whether disappointing a strategic Tier-1 customer will destroy a multi-year commercial partnership. Managing Human and Organizational Trust: Resolving the political tension between a high-performing sales VP who demands inventory buffer and a plant manager fighting to avoid unbudgeted overtime requires emotional intelligence, executive negotiation, and cross-functional leadership. Scenario Stress-Testing and Black Swan Risk: AI models extrapolate from historical training distributions. They cannot anticipate unprecedented geopolitical embargoes, cross-border tariff impositions, or emerging supplier insolvencies. The role of AI is to eliminate manual presentation toil, empowering supply chain leaders to focus 100% of their energy on strategic analysis, cross-functional alignment, and decisive boardroom leadership.
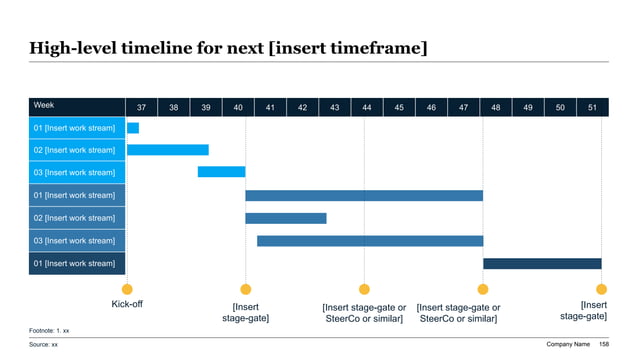
Exhibit 5: Executive S&OP Consensus Decision Tracker & Rolling Implementation Calendar
Transitioning from Traditional S&OP to Mature Integrated Business Planning (IBP)
A critical responsibility of modern supply chain executives is leading the organizational evolution from traditional Stage 1-2 operational S&OP to Stage 3-4 enterprise Integrated Business Planning (IBP). While conventional S&OP focuses primarily on balancing physical unit volumes over a tactical 3-to-6 month horizon, mature IBP connects the entire business enterprise—commercial sales, product R&D, supply chain operations, human resources, and corporate finance—into a rolling 24-to-36 month strategic value creation engine.
The S&OP-to-IBP maturity journey progresses across four well-defined institutional stages: Stage 1: Siloed Operational Reactivity. Characterized by disjointed spreadsheets, lack of formal meeting discipline, sales forecasting disconnected from plant realities, and constant executive finger-pointing during unexpected stockout crises. Stage 2: Tactical Supply-Demand Balancing. A formal 5-step S&OP cadence is established, but discussions remain focused almost entirely on physical units and short-term manufacturing scheduling, with minimal financial integration or C-suite engagement. Stage 3: Integrated Business Planning (IBP). Commercial, operational, and financial data are fully linked in dollarized terms; the planning horizon extends to 24 months; product portfolio reviews govern NPI introductions; and meetings focus on closing gaps against multi-year strategic plans. Stage 4: Synchronized Enterprise Orchestration. Real-time digital supply chain twins, automated AI scenario modeling, dynamic customer profitability allocation, and continuous cross-functional risk hedging embedded directly into boardroom strategic governance.
To reflect this maturity in your presentation decks, transition slide terminology from tactical supply chain jargon (e.g., 'safety stock days', 'line changeovers', 'case counts') to enterprise executive language (e.g., 'working capital velocity', 'return on invested capital [ROIC]', 'customer lifetime value preservation', 'gross margin resilience'). Presenting S&OP through the lens of enterprise value creation elevates supply chain leaders from tactical cost-center managers to indispensable strategic business partners in the eyes of the CEO and Board of Directors.
Frequently Asked Questions About S&OP and IBP Presentations
XLSlides Resources for Supply Chain, Operations, and Corporate Planning
Turn Operational Complexity into Executive Clarity with XLSlides
Your executive committee deserves presentations that drive decisive operational alignment, not 80-slide technical spreadsheet dumps that obscure supply chain bottlenecks. XLSlides transforms fragmented ERP outputs, commercial demand forecasts, and plant capacity constraints into clean, institutional consulting decks in minutes.Experience the power of automated, logic-driven presentation generation designed specifically for serious operations, finance, and corporate strategy leaders. Build your next executive-ready S&OP presentation with XLSlides today.