Executive Summary: The Strategic Mandate of Investor Day & Analyst Day Presentations
Key Strategic Takeaways for CFOs, IROs & Executive Management
- Multi-Year Destination Framing Over Quarterly Noise: Anchor the entire presentation on a 3-to-5 year strategic holding horizon. Use the Investor Day to elevate discourse above transient 90-day supply chain or currency headwinds, demonstrating how secular tailwinds and product moats drive sustainable top-line compounding.
- Empirical Addressable Market (TAM) Triangulation: Abandon speculative, top-down trillion-dollar marketing TAMs that sell-side analysts immediately discount to zero. Present rigorous bottom-up addressable market models based on verifiable customer unit counts, annualized contract value (ACV) tiers, and segment wallet expansion.
- Deconstructed Operating Margin Expansion Waterfalls: Provide an explicit bridge connecting current baseline margins to 3-year target operating margins. Decompose operating leverage into distinct, quantifiable buckets: Gross Margin expansion, Sales & Marketing productivity, and R&D/G&A scale economies.
- Disciplined Capital Allocation Hierarchy: Eliminate balance sheet ambiguity by establishing an unequivocal capital deployment framework. Transparently articulate hurdle rates (ROIC > WACC + 500 bps), organic reinvestment envelopes, investment-grade leverage targets (<2.0x Net Debt/EBITDA), programmatic M&A boundaries, and shareholder return commitments (dividends and anti-dilutive share buybacks).
- Statutory Governance & Regulation FD Rigor: Pre-engineer strict compliance with SEC Regulation FD, PSLRA Safe Harbor forward-looking protections, and Regulation G Non-GAAP reconciliation rules. Ensure simultaneous public webcast broadcasting, Form 8-K filings, and disciplined rehearsal protocols that prevent accidental disclosure of material non-public information (MNPI) during unscripted Q&A.
- Consulting-Grade Visual & Model Alignment: Discard text-dense bullet point marketing slides in favor of data-dense, MECE financial exhibits, waterfall bridges, and Marimekko market charts. Ensure every visual features an assertive action title that communicates the primary investment conclusion directly to busy institutional portfolio managers.
The 6-Part Master Agenda: Anatomical Architecture of a Wall Street Capital Markets Day
Exhibit 1: Master Investor Day Agenda: The 6-Stage Chronological Presentation Architecture
Comprehensive Structural Matrix: The 6 Core Sections of an Institutional Investor Day Deck
An institutional architectural framework detailing presenter roles, narrative objectives, essential slide exhibits, and sell-side modeling impacts across each phase of a Wall Street Analyst Day.
| Agenda Segment | Primary Executive Presenter | Core Strategic Narrative & Key Exhibits | Wall Street Scrutiny & Modeling Impact |
|---|---|---|---|
| 1. Strategic Vision & Enterprise Transformation | Chief Executive Officer (CEO) | The overarching investment thesis, multi-year secular growth drivers, corporate mission, and 3-Horizon Transformation Roadmap (Horizon 1 Core, Horizon 2 Adjacent, Horizon 3 Platform). | Anchors the terminal valuation multiple; shifts analyst perception from short-term cyclicality to durable long-term franchise compounding. |
| 2. Market Headroom & TAM Expansion | Chief Strategy Officer (CSO) / Chief Marketing Officer (CMO) | Empirical bottom-up TAM / SAM / SOM sizing, industry vertical Marimekko penetration charts, customer wallet expansion, and macro regulatory tailwinds. | De-risks top-line terminal growth assumptions (g) in sell-side DCF models; proves company has decades of reinvestment runway before saturation. |
| 3. Technology Moat & Product Innovation Pipeline | Chief Technology Officer (CTO) / Chief Product Officer (CPO) | Proprietary architectural differentiation, R&D patent portfolio, multi-year product roadmap, AI enablement, and platform stickiness / switching cost evidence. | Justifies gross margin durability (75%+ in software, 45%+ in industrial tech); defuses competitive threats from hyperscalers or venture-backed disruptors. |
| 4. Go-to-Market Execution & Commercial Velocity | Chief Revenue Officer (CRO) / Head of Global Sales | Direct enterprise sales productivity, partner ecosystem leverage, Net Revenue Retention (NRR) cohorts, Customer Acquisition Cost (CAC) payback, and pipeline coverage. | Validates Sales & Marketing operating leverage assumptions; proves sales capacity and quota attainment support multi-year revenue CAGR targets. |
| 5. Multi-Year Financial Model & Capital Allocation | Chief Financial Officer (CFO) | 3-to-5 year organic revenue CAGR, Non-GAAP operating margin expansion waterfall, Free Cash Flow (FCF) conversion %, ROIC hurdles, and capital return commitments. | The core quantitative input for sell-side spreadsheet updates; sets consensus EPS, EBITDA, and free cash flow benchmarks for the next 12 to 24 quarters. |
| 6. Executive Q&A & Sell-Side Deep-Dive | CEO, CFO, and Executive Leadership Team | Unscripted, comprehensive interrogation addressing top bear arguments, macro sensitivity, pricing power, customer concentration, and downside stress tests. | Validates management alignment, intellectual honesty, and strategic agility under pressure; establishes overall executive credibility score. |
Empirical Addressable Market Sizing: De-Risking the TAM / SAM / SOM Expansion Narrative
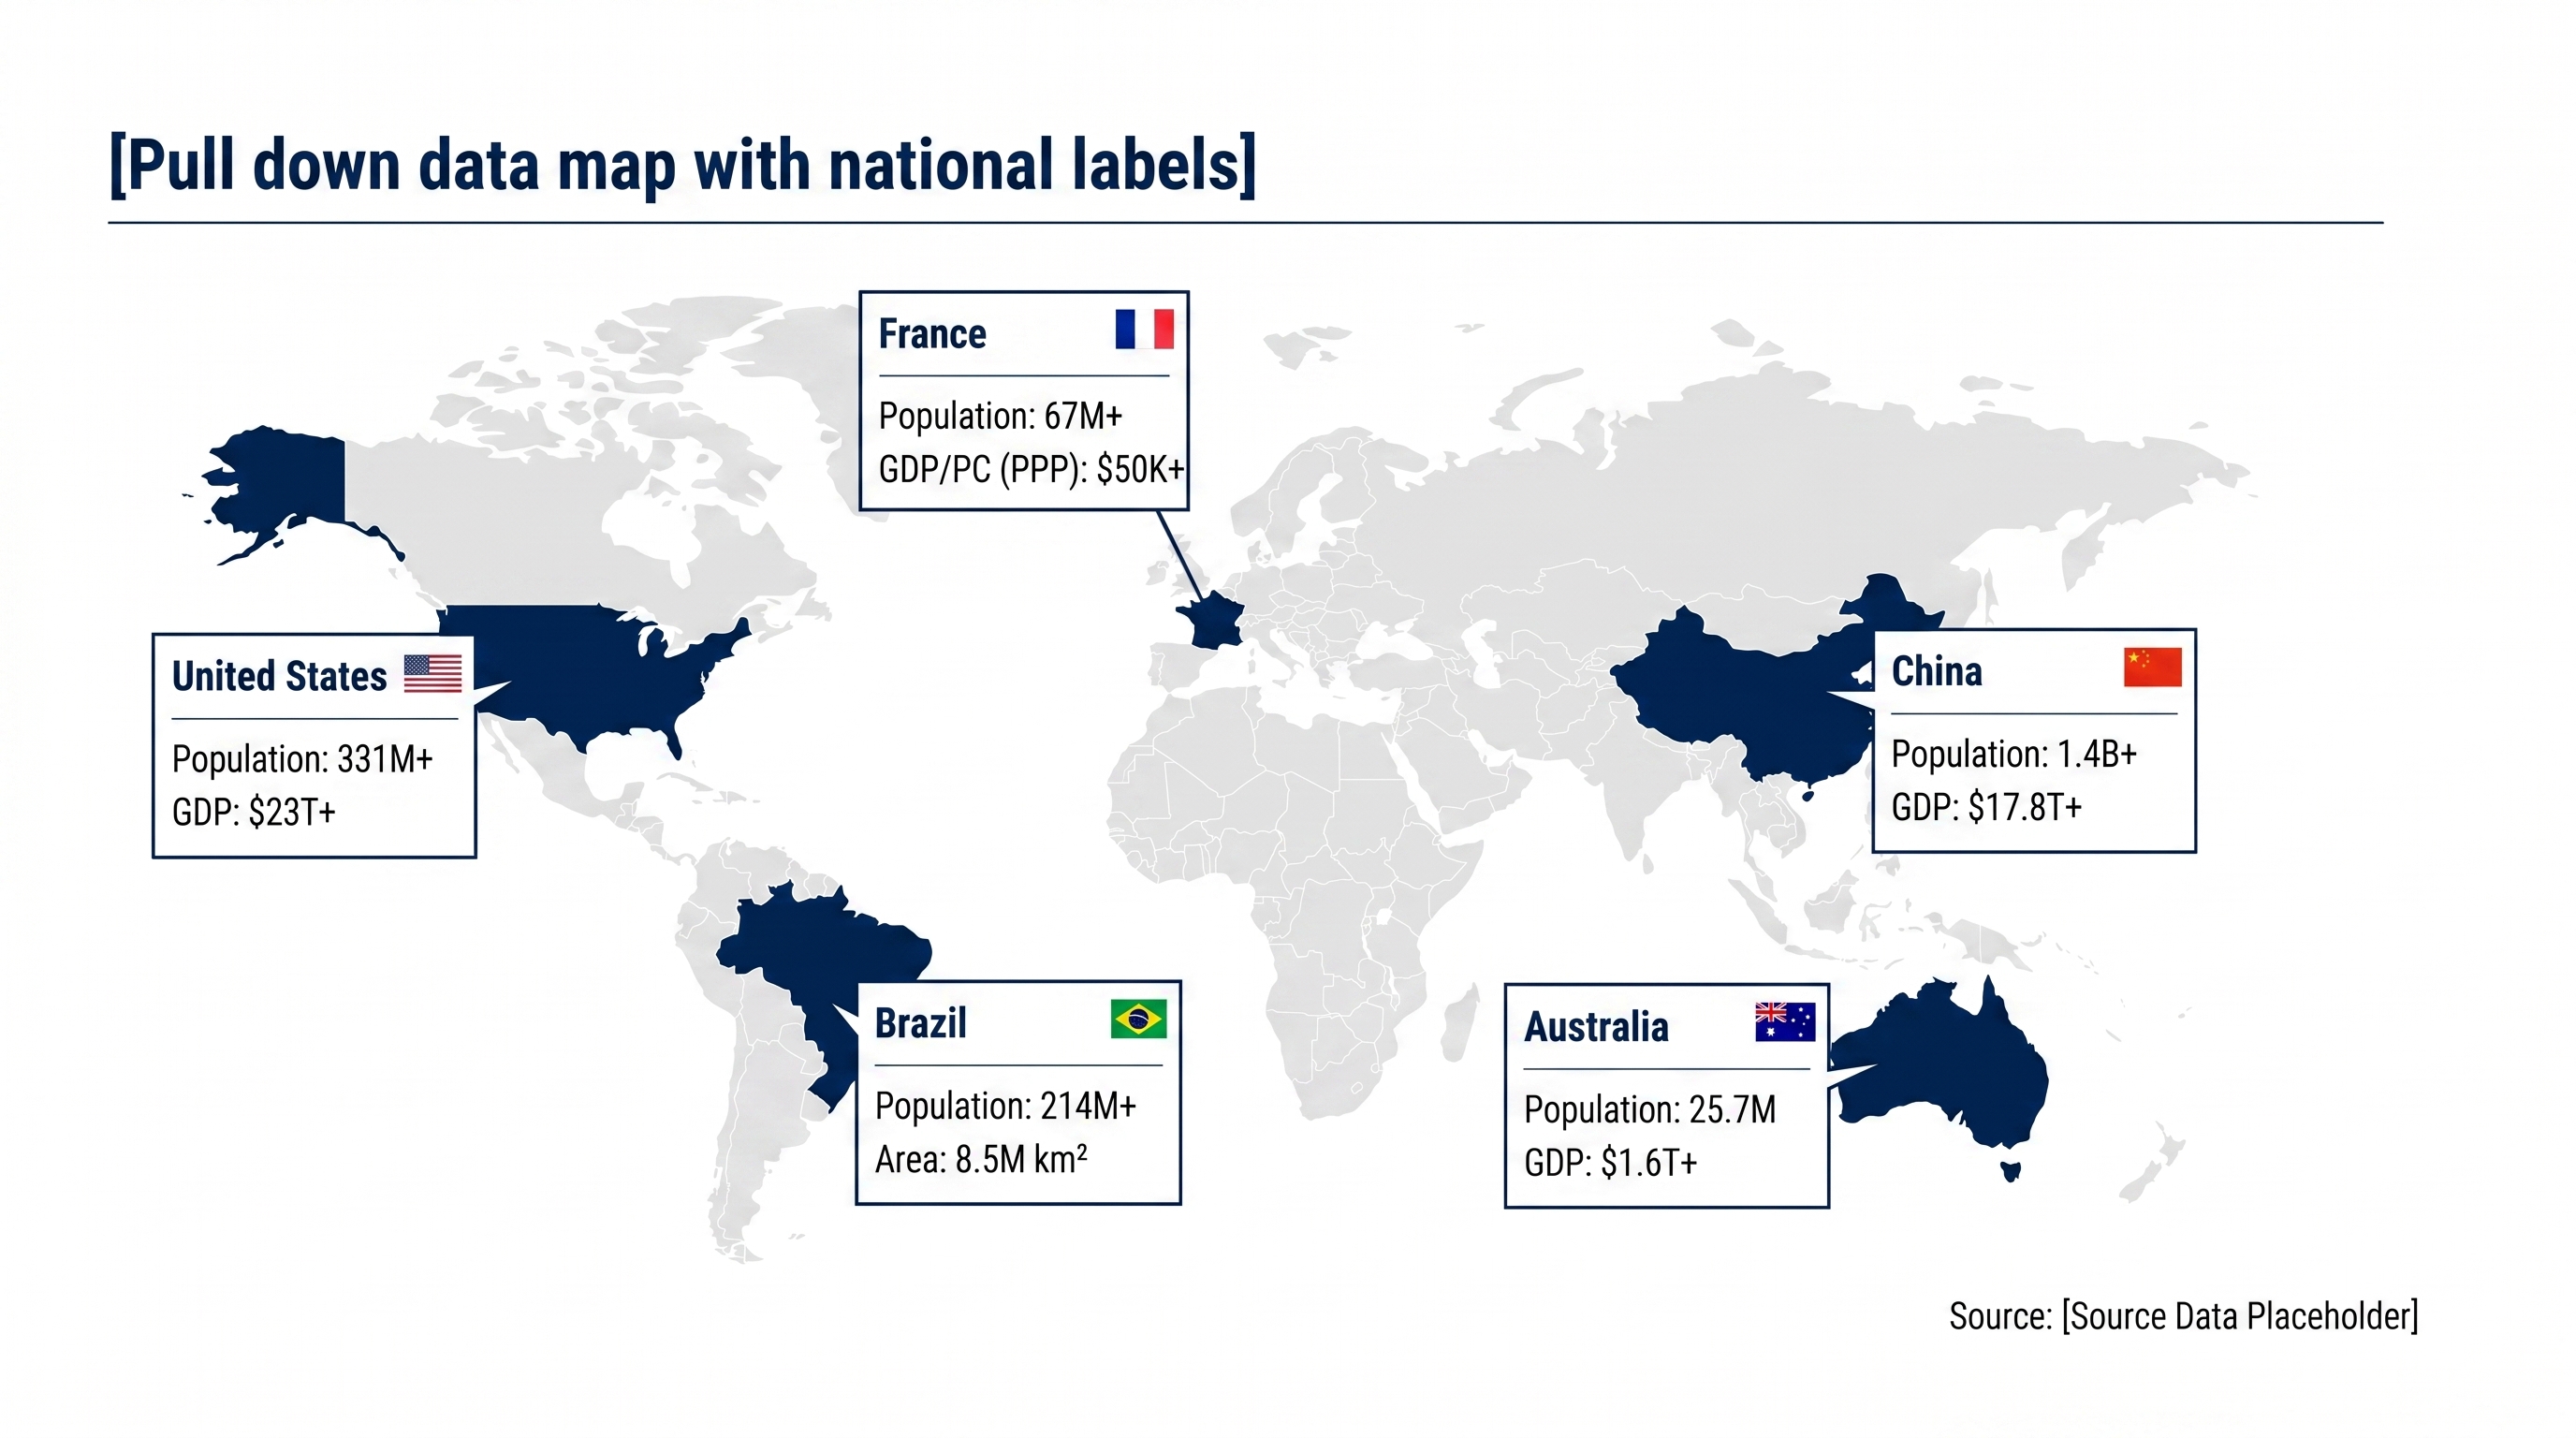
Exhibit 2: Multi-Country Geographic Market Footprint & International Revenue Expansion
Pre-Event Sell-Side Consensus & Buy-Side Perception Audit Checklist
Deconstructing Revenue Evolution: High-Margin Recurring Software & Customer Retention Velocity
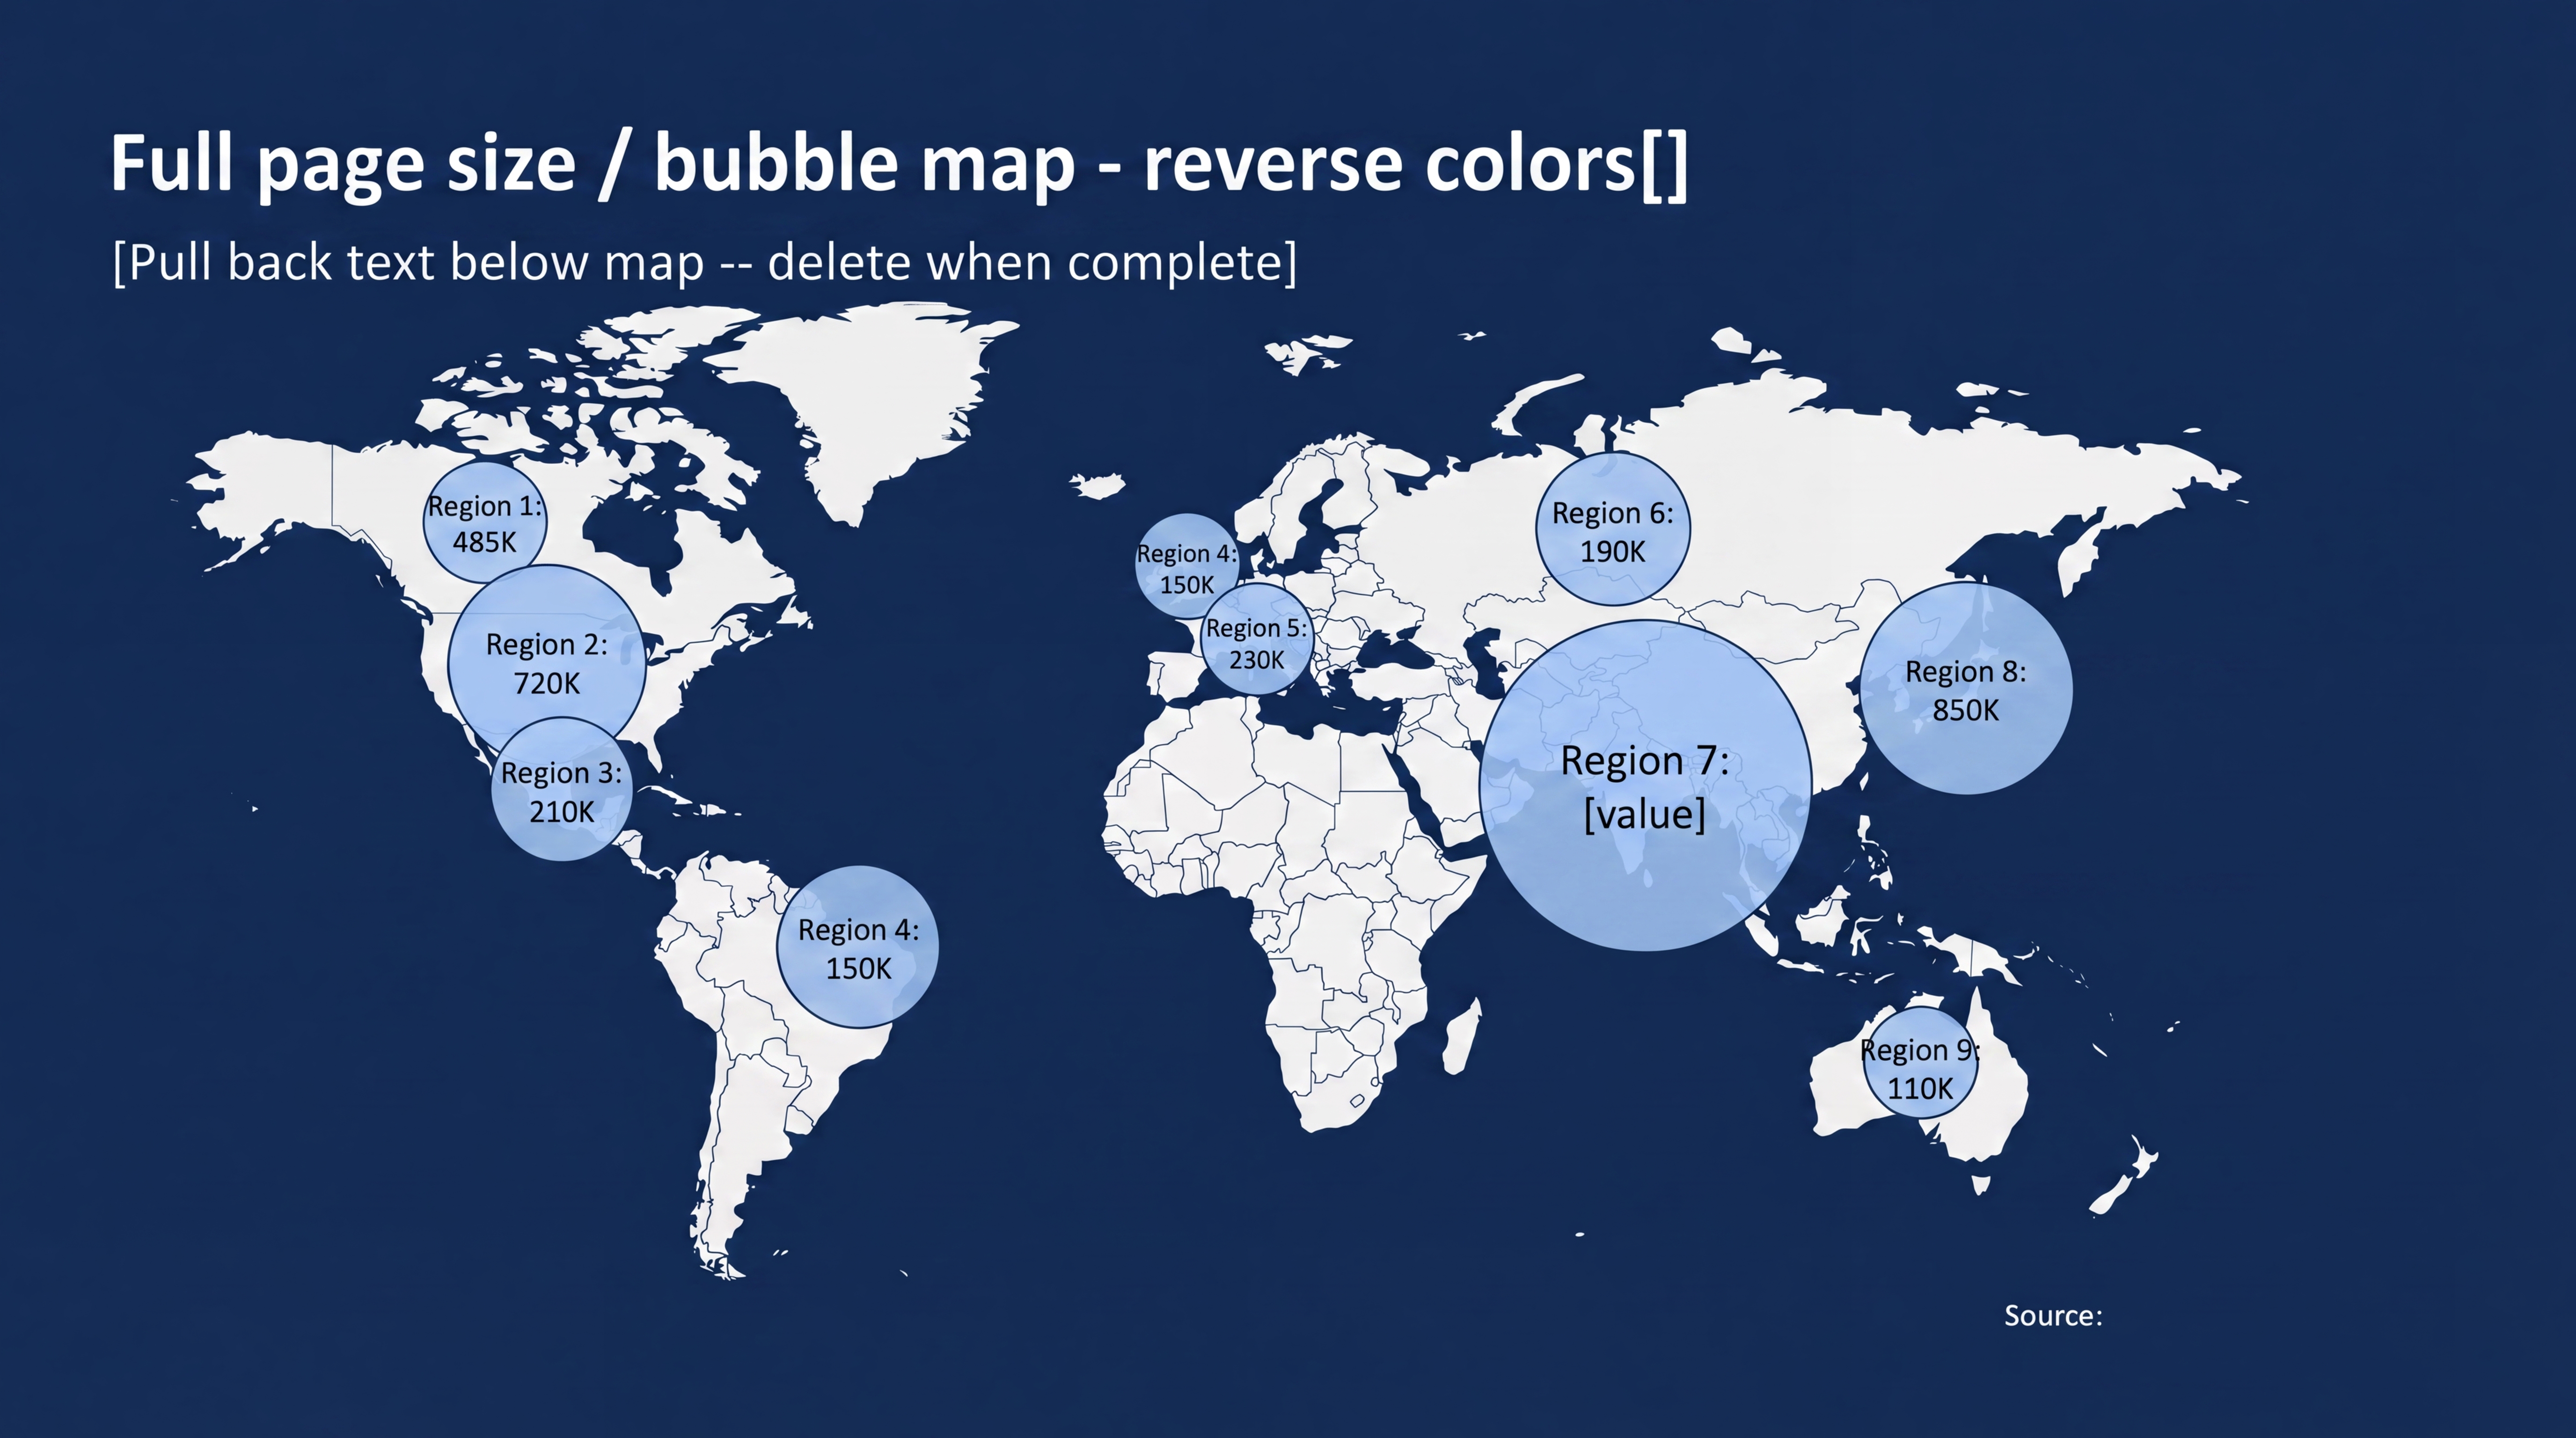
Exhibit 3: Global Addressable Market Opportunity & Regional Headroom Sizing
Sell-Side Equity Research vs. Buy-Side Institutional Portfolio Manager Evaluation Rubric
A comparative behavioral matrix analyzing the disparate analytical priorities, modeling sensitivities, risk tolerances, and evaluation criteria of Wall Street sell-side analysts versus buy-side portfolio managers.
| Analytical Dimension | Sell-Side Equity Research Analysts | Buy-Side Institutional Investors (Long-Only & Hedge Funds) | Optimal Investor Day Slide Strategy |
|---|---|---|---|
| Primary Mandate & Incentives | Publishing differentiated research notes, generating institutional trading commissions, establishing consensus EPS benchmarks, and setting 12-month target prices. | Generating absolute and benchmark-relative alpha, preserving capital, compounding portfolio returns over 3-to-5 years, and managing liquidity/drawdown risk. | Provide both near-term building blocks (for sell-side 12-month models) and 5-year strategic terminal value drivers (for buy-side multi-year underwriting). |
| Financial Model Sensitivity | Granular P&L line-item modeling: quarterly revenue cadence, gross margin basis points, SG&A spend, tax rates, and GAAP-to-Non-GAAP EPS reconciliation. | Cash flow generation and balance sheet quality: Unlevered Free Cash Flow (FCF) yield, Return on Invested Capital (ROIC), net leverage, and working capital intensity. | Include an exhaustive Non-GAAP operating margin waterfall alongside a 5-year Free Cash Flow conversion schedule and ROIC bridge. |
| Guidance Format Preference | Prefers explicit, bounded numeric guidance ranges for revenue and EPS to minimize earnings estimate revision volatility. | Prefers transparent unit economics, structural margin corridors, and directional multi-year targets tied to clear operational milestones. | Deliver 3-year financial targets as disciplined ranges (e.g., '12-14% Revenue CAGR, 26-28% Operating Margin') rather than rigid single-point numbers. |
| Risk & Downside Underwriting | Focuses on near-term headline risk: competitive pricing wars, customer contract renewals, macro demand slowdowns, and earnings miss vulnerability. | Focuses on structural franchise durability: moat decay, customer concentration, technological obsolescence, management integrity, and capital destruction. | Dedicate a prominent slide to competitive differentiation, customer diversification (no single client >3% of ARR), and downside recession stress testing. |
| Executive Credibility Gating Criteria | Historical track record of meeting or beating quarterly guidance; transparency regarding operational headwinds; access to divisional leadership. | Intellectual honesty regarding past mistakes; disciplined capital allocation history; executive compensation aligned with shareholder returns (ROIC/TSR). | Showcase past Investor Day scorecard tracking performance against prior commitments; highlight management incentive alignment with multi-year TSR. |
| Core Q&A Interrogation Focus | Technical modeling questions: specific pricing changes, headcount additions, tax rate step-ups, and quarterly seasonality patterns. | Strategic capital allocation questions: M&A integration hurdles, organic R&D ROI, share buyback philosophy, and succession planning. | Arm executive presenters with a hyperlinked 50-slide appendix covering granular modeling mechanics, while reserving main stage for strategic debate. |
Operating Margin Expansion: The Quantitative Bridge from Baseline to Target Year
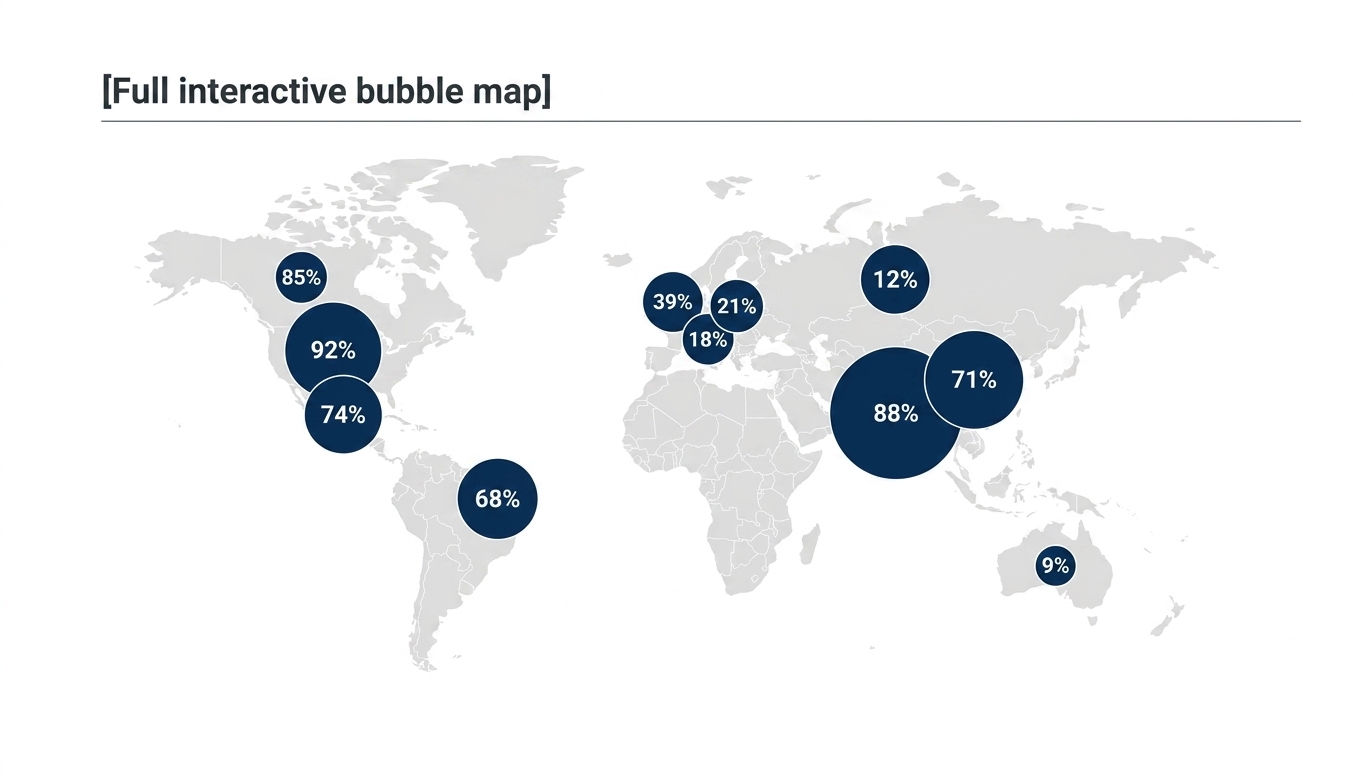
Exhibit 4: Global Enterprise Account Penetration & Fortune 500 Market Share
The 3-to-5 Year Long-Term Financial Model: Growth CAGR, Margin Targets, and Free Cash Flow Conversion
Exhibit 5: Corporate Governance Axioms & Long-Term Shareholder Value Creation Framework
Statutory Governance & Compliance: SEC Regulation FD, Safe Harbor & Non-GAAP Reconciliations
Executive Stage Presence, Q&A Rehearsal & Live Presentation Protocol
How Enterprise IR Teams Build Investor Day Presentations in XLSlides
Institutional AI Prompt Recipe: Investor Day Executive Script to Slide Deck
Act as an elite Corporate Investor Relations Advisor and Chief Financial Officer presentation strategist preparing a Fortune 500 Investor Day presentation for Wall Street equity research analysts and institutional portfolio managers. Analyze the following corporate background, strategic planning documents, and long-range financial model: [INSERT RAW CORPORATE STRATEGY, HISTORICAL 10-K METRICS, LONG-RANGE FINANCIAL TARGETS, AND PRODUCT PIPELINE DATA] Generate an institutional 20-slide Investor Day presentation adhering to the following structural requirements: 1. EXECUTIVE NARRATIVE ARC: Organize the presentation into 6 distinct sections: (1) Strategic Vision & Enterprise Transformation, (2) TAM/SAM/SOM Headroom & Market Capture, (3) Technology Architecture & Competitive Moat, (4) Go-to-Market Velocity & Cohort Retention, (5) Multi-Year Financial Model & Capital Allocation, and (6) Comprehensive Appendix. 2. ACTION TITLES: Every single slide must feature an assertive, complete-sentence action title (lead-in) articulating the primary strategic conclusion, not generic topic titles (e.g., use 'Multi-Year Revenue Mix Shifts Toward 85% High-Margin Recurring ARR, Expanding Gross Margins by 450 bps' instead of 'Revenue Breakdown'). 3. FINANCIAL RIGOR & WATERFALLS: In the financial section, detail an explicit Operating Margin Expansion Waterfall decomposing margin leverage into Gross Margin Uplift, Sales Productivity, and G&A Scale, while accounting for targeted R&D reinvestment. 4. LONG-TERM FINANCIAL TARGETS: Formulate a 5-pillar target dashboard establishing commitments across Organic Revenue CAGR (3-year range), Non-GAAP Operating Margin corridor, Rule of 40 performance, Free Cash Flow Conversion %, and minimum ROIC hurdle rate. 5. CAPITAL ALLOCATION HIERARCHY: Structure a clear 5-tier capital deployment framework balancing organic reinvestment (Tier 1), balance sheet leverage targets (<2.0x Net Debt/EBITDA, Tier 2), disciplined bolt-on M&A (Tier 3), growing cash dividend (Tier 4), and anti-dilutive/opportunistic share repurchases (Tier 5). 6. REGULATION FD & NON-GAAP CITATIONS: Embed formal Safe Harbor forward-looking disclaimer language and comprehensive footnotes specifying Non-GAAP adjustments, excluding Stock-Based Compensation and intangible asset amortization. Output the complete presentation structure with slide titles, visual exhibit layouts (waterfall, column chart, Mekko, process chevrons), speaker notes for the CEO and CFO, and quantitative data tables.
Frequently Asked Questions: Investor Day & Analyst Day Presentations
What is the primary structural difference between an Investor Day and a quarterly earnings call?
A quarterly earnings call is a tactical, 45-minute retrospective review focused on the prior 90 days of operational performance, comparing reported GAAP and Non-GAAP results against short-term consensus estimates and updating annual guidance. In contrast, an Investor Day is a multi-hour strategic summit held every 1 to 2 years that steps back from quarterly noise to unveil the company's 3-to-5 year strategic transformation, secular market tailwinds, technology product roadmap, long-term operating margin targets, and comprehensive capital allocation framework.
How far into the future should management provide long-term financial targets?
The institutional standard for public companies is a 3-to-5 year strategic holding horizon. Providing targets shorter than three years fails to elevate discourse above the near-term quarterly cycle, while forecasting beyond five years is heavily discounted by institutional investors as speculative and unreliable. Presenting targets as multi-year Compound Annual Growth Rates (CAGR) and terminal operating margin corridors provides the ideal balance between strategic direction and financial flexibility.
How should executive leadership handle a sudden macroeconomic downturn right before a scheduled Investor Day?
Never cancel or abruptly postpone an Investor Day due to macro headwinds; cancellation signals panic, lack of visibility, and operational distress, triggering severe equity selloffs. Instead, lean into the downturn by framing the presentation around structural resilience, counter-cyclical product demand, variable cost flexibility, and balance sheet strength. Present scenario-based sensitivities showing how the business maintains strong free cash flow and solvency even under downside stress conditions.
What is the recommended ratio between scripted executive presentation time and audience Q&A?
The institutional rule of thumb is a 60/40 time split: formal scripted executive presentations should consume no more than 60% of total event time (e.g., 2 to 2.5 hours of a 4-hour event), preserving a full 40% (at least 60 to 90 minutes) for interactive, unscripted audience Q&A. Institutional portfolio managers view management's poise, candor, and alignment during live Q&A as the ultimate test of executive conviction.
How should IR teams address Stock-Based Compensation (SBC) in Non-GAAP operating targets given rising investor scrutiny?
Institutional investors and sell-side analysts increasingly push back against aggressive Non-GAAP adjustments that exclude massive Stock-Based Compensation (SBC) expenses from operating earnings. To maintain credibility, management should provide full transparency: present Non-GAAP Operating Margins alongside GAAP Operating Margins, establish an explicit target for SBC as a declining percentage of revenue over the 3-year horizon (e.g., trending from 12% down to <6%), and implement a disciplined share repurchase program that completely offsets annual dilution.
How many slides should an Investor Day presentation contain, and how should the appendix be structured?
A premier Investor Day presentation typically contains between 75 and 120 total slides in the core presentation deck across all executive presenters, averaging approximately 15 to 25 slides per speaker. In addition, the deck should feature a hyperlinked defense appendix containing 40 to 60 supplementary exhibits detailing historical financial reconciliations, customer cohort heatmaps, accounting definitions, and micro-vertical market breakdowns that can be instantly projected during Q&A.
What legal filings are strictly required under SEC Regulation FD before hosting an in-person Analyst Day?
Under SEC Regulation FD, management must ensure that all material presentation materials are publicly disseminated before or simultaneously with the event. This requires filing a Current Report on Form 8-K containing the complete slide deck and event press release with the SEC prior to the opening remarks, hosting a publicly accessible, unrestricted live audio/video webcast, and archiving an exact webcast recording and written transcript on the corporate investor relations portal within hours of conclusion.
Relevant Financial Guides, Modeling Tools & Executive Presentation Templates
Generate Institutional Investor Day & Wall Street Presentations with XLSlides
Stop spending hundreds of grueling hours formatting PowerPoint charts, rebuilding margin waterfalls, and wrestling with slide layouts. XLSlides empowers CFOs, Heads of Investor Relations, and corporate strategy teams to transform raw financial models, earnings transcripts, and strategy memos into Wall Street-ready, fully editable PowerPoint decks in minutes.
Methodology And Sources
- Standards of Practice for Investor Relations: Investor Days & Capital Markets Events(National Investor Relations Institute (NIRI) • 2024)
Authoritative professional practice guidelines outlining structural planning, perception study methodology, disclosure protocols, and sell-side engagement standards for corporate Analyst Days.
- Regulation FD (Fair Disclosure) & Non-GAAP Financial Measures Guidance (Regulation G & Item 10(e))(U.S. Securities and Exchange Commission (SEC) Division of Corporation Finance • 2023)
Statutory compliance guidelines establishing mandatory public dissemination standards, Form 8-K filings, prominence requirements, and GAAP-to-Non-GAAP reconciliation rules for corporate investor presentations.
- Communicating with Wall Street: How High-Performing Companies Master Investor Days and Long-Term Guidance(McKinsey & Company Strategy & Corporate Finance Practice (Marc Goedhart & Tim Koller) • 2023)
Empirical corporate finance research analyzing equity valuation multiples pre- and post-Investor Day, demonstrating how transparent margin waterfalls and ROIC commitments drive multiple rerating.
- Best Practices for Public Company Investor Days: Managing Analyst Expectations, Governance, and Forward-Looking Guidance(Harvard Law School Forum on Corporate Governance (Wachtell, Lipton, Rosen & Katz) • 2024)
Rigorous corporate governance analysis examining PSLRA Safe Harbor disclaimers, Q&A liability management, shareholder register engagement, and board communications alignment.
- The Anatomy of a Successful Capital Markets Day: Valuation Multiples, Consensus Alignment, and Buy-Side Engagement(Morgan Stanley Institutional Equity Research & Corporate Advisory • 2024)
Wall Street investment banking and equity research benchmark report evaluating over 300 global Capital Markets Days across S&P 500 and FTSE 100 issuers, detailing analyst model update behaviors.