Direct Answer: What An Earnings Presentation Should Actually Do
An earnings presentation should do three jobs at once. First, it should summarize the quarter in a way that lets investors, directors, and analysts understand the result without reading forty pages of filings in real time. Second, it should explain the drivers behind the result: what moved in revenue, margin, cash generation, segment mix, and guidance. Third, it should frame the next question before the market asks it on the call. If management does not control that narrative, the discussion gets pulled toward the noisiest metric or the most confusing line item.
That is why a serious earnings deck is different from a board deck or a monthly operating review. A board deck is built for oversight, scenario discussion, and private debate. An earnings presentation is built for external scrutiny. It has to align with the earnings release, stay consistent with the 10-Q or 10-K, handle non-GAAP measures carefully, and present enough structure that sell-side and buy-side readers can extract the message quickly. The deck is not just a visual aid for the call. It is part of the market communication package that shapes how the quarter is interpreted.
The best earnings presentations are answer-first. Slide one should tell the market the economic conclusion of the quarter, not just repeat the company name and date. The supporting pages should show the few metrics that actually explain the result, the changes that matter by segment or business line, the guidance posture, and the operational proof behind management's confidence. XLSlides fits this workflow when finance teams want to turn messy filings, transcript notes, KPI packs, and commentary drafts into a clean first deck that is still editable enough for CFO and IR review.
Earnings Deck Takeaways
- Lead with the quarter's conclusion, not a generic title page.
- Keep the release, deck, and call script aligned around the same narrative hierarchy.
- Show the bridge from reported numbers to the business explanation investors care about.
- Use visuals to accelerate interpretation, not to decorate finance data.
- Let AI compress drafting time, but keep management judgment on guidance, non-GAAP framing, and disclosure risk.
Earnings Presentation Vs. Board Deck Vs. Investor Update Vs. Budget Review
Teams often recycle one finance deck for every audience. That is usually the source of confusion. These formats overlap on metrics, but they answer different questions and operate under different standards of disclosure and speed.
| Format | Primary audience | Core question | What the deck should emphasize |
|---|---|---|---|
| Earnings presentation | Public investors, analysts, media, directors listening externally | What happened this quarter and how should the market interpret it? | Quarter headline, KPI drivers, segment narrative, guidance, and disciplined commentary |
| Board deck | Directors and senior management | What decisions, risks, and capital tradeoffs require oversight? | Private debate, scenario implications, capital allocation, and follow-through |
| Investor update | Private investors, founders, and close stakeholders | How is the company progressing and what needs support next? | Milestones, confidence signals, operating progress, and selective asks |
| Budget review | Finance leadership and operating managers | Why is performance above or below plan and what action is required? | Variance bridges, accountability, plan changes, and near-term corrective action |
Why The Earnings Deck Is A Market Communication Asset, Not Just A Finance Recap
Quarterly earnings materials are one of the few recurring moments when management gets concentrated market attention. That means the deck has a burden that internal reporting packs do not have. It must communicate clearly to readers with very different levels of familiarity: long-only investors who know the business well, new analysts covering the name for the first time, journalists extracting the headline, and directors who want to hear whether the external message truly matches the internal operating picture. A weak deck treats the exercise as a compliance attachment. A strong deck treats it as a credibility instrument.
The market does not reward volume. It rewards coherent interpretation. If the quarter beat expectations but the mix quality deteriorated, that tension must be visible. If revenue was soft but cash conversion improved meaningfully, that deserves the headline. If management is maintaining guidance because the pipeline remains strong despite near-term margin pressure, the deck should connect those ideas explicitly. The point is not to hide volatility. The point is to explain it in a way that sounds like management understands the business better than anyone else in the room.
This is also why action-title discipline matters in earnings decks. Investors scan faster than most internal stakeholders. They often read the headlines before they study the chart. If the titles say Revenue, Segment Update, Margins, and Outlook, the deck wastes that attention. If the titles instead say Enterprise subscription growth offset slower services revenue, Gross margin expanded because mix and pricing improved, or Full-year guide holds because renewals and backlog remain intact, the reader can reconstruct the earnings story quickly. That is the standard XLSlides should support: a finance narrative that is fast to draft, rigorous to review, and still usable in PowerPoint-style workflows after legal and executive edits.
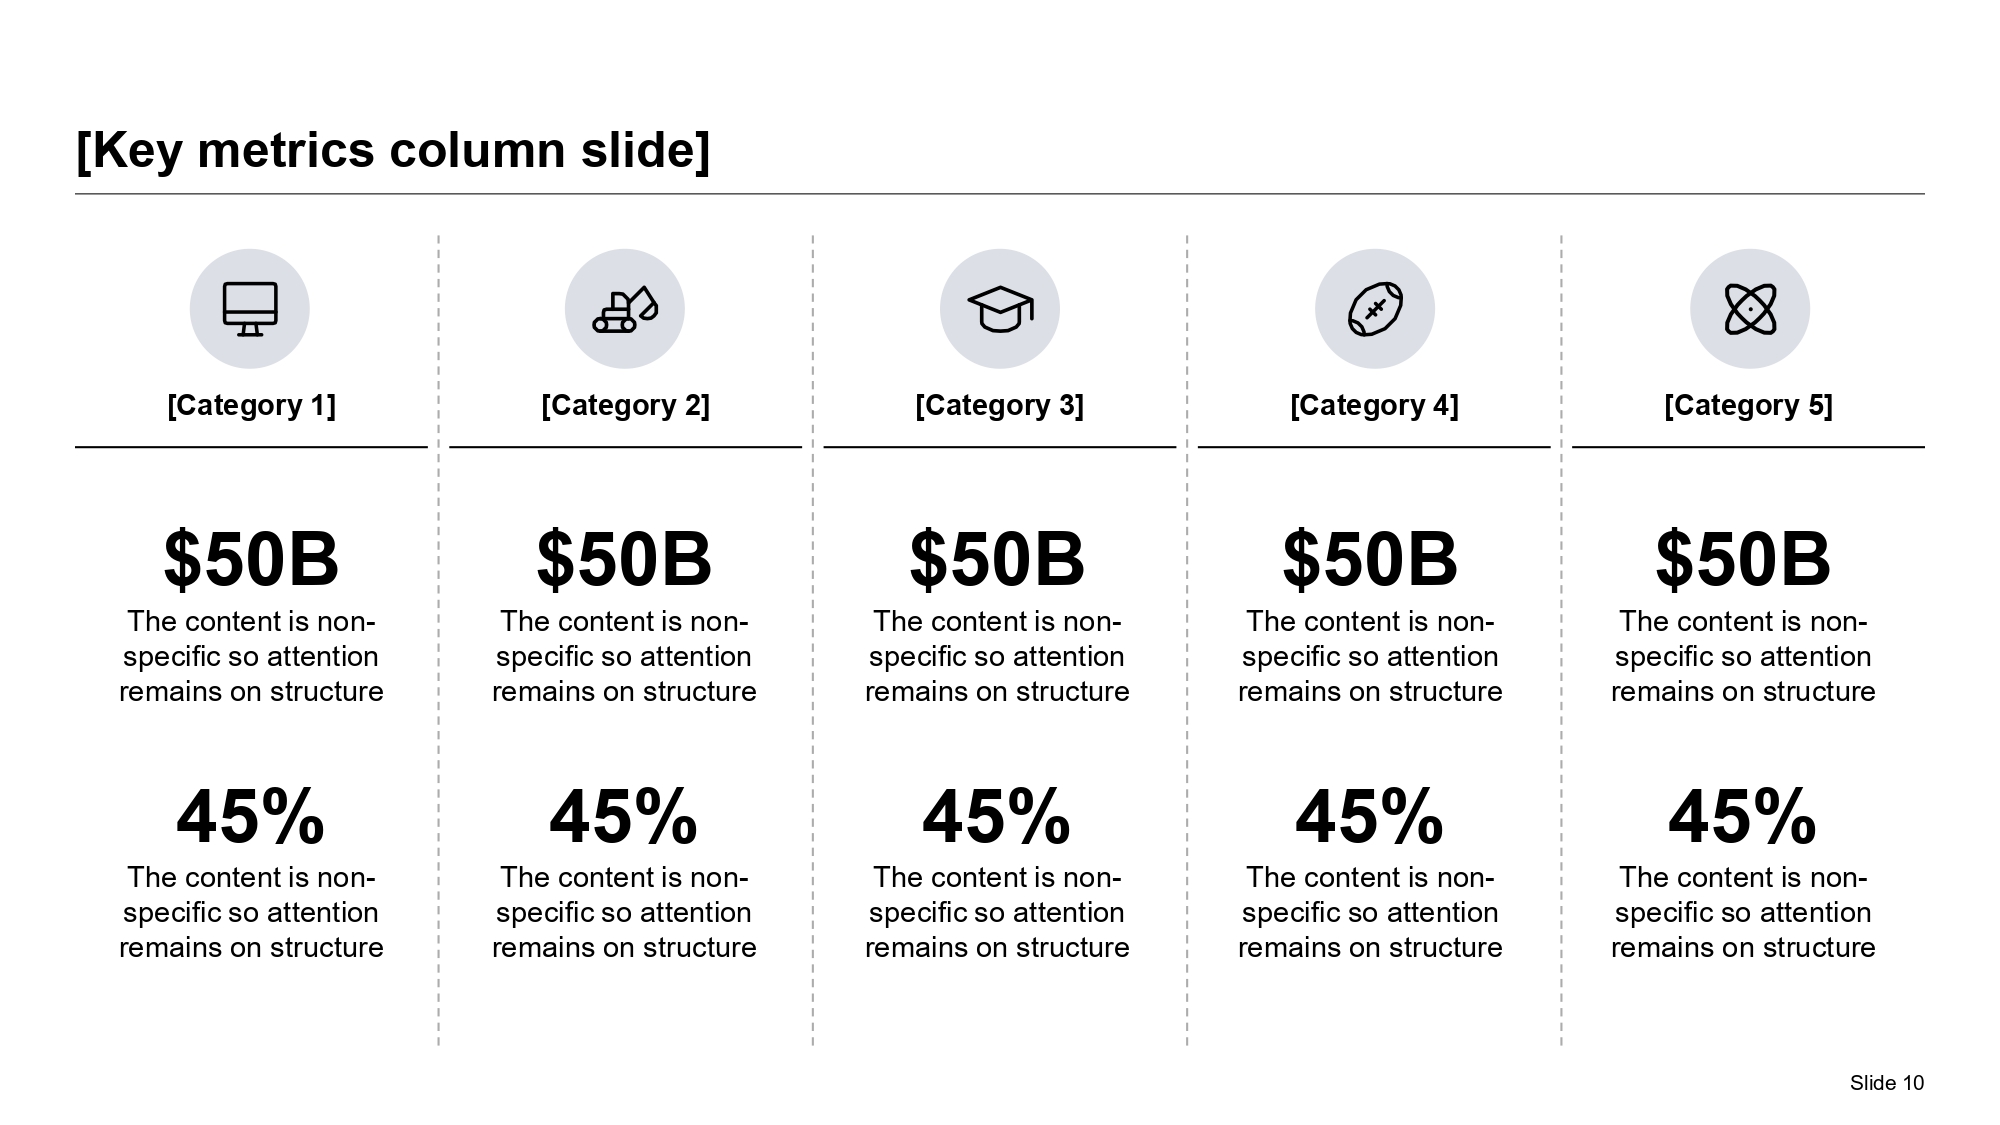
Opening Market Snapshot Reference
Inputs To Lock Before Drafting The Quarter
Slide One Must Tell The Market What Changed And Why It Matters
The first substantive slide in an earnings presentation should not be a compressed data dump. It should be an interpretation page. Its job is to help the audience answer four questions immediately: did the company perform above, below, or in line with the expected story; what drove that result; how durable are those drivers; and what should investors watch next. If the page cannot answer those questions in under a minute, management has probably confused summary with compression.
Most finance teams already know the ingredients that belong here. They are just often arranged in the wrong order. Start with the quarter's conclusion, then show the few numbers that prove it, then add one or two operating explanations that tell the audience whether the result is repeatable. For a software company, that might be ARR growth, net revenue retention, free cash flow, and guidance. For an industrial company, it might be volume, price, backlog, margin, and cash conversion. The mistake is trying to represent every KPI equally. Earnings decks become much stronger when they rank metrics by explanatory value instead of by internal ownership.
This is also where management tone becomes visible. A good opening page neither over-celebrates nor over-defends. It states the outcome with precision, surfaces the strongest support, and acknowledges what still needs monitoring. Investors do not expect perfect quarters. They expect management teams that can separate signal from noise. A credible opening slide sounds like a disciplined operator speaking to capital markets, not like a marketing team trying to polish the release.
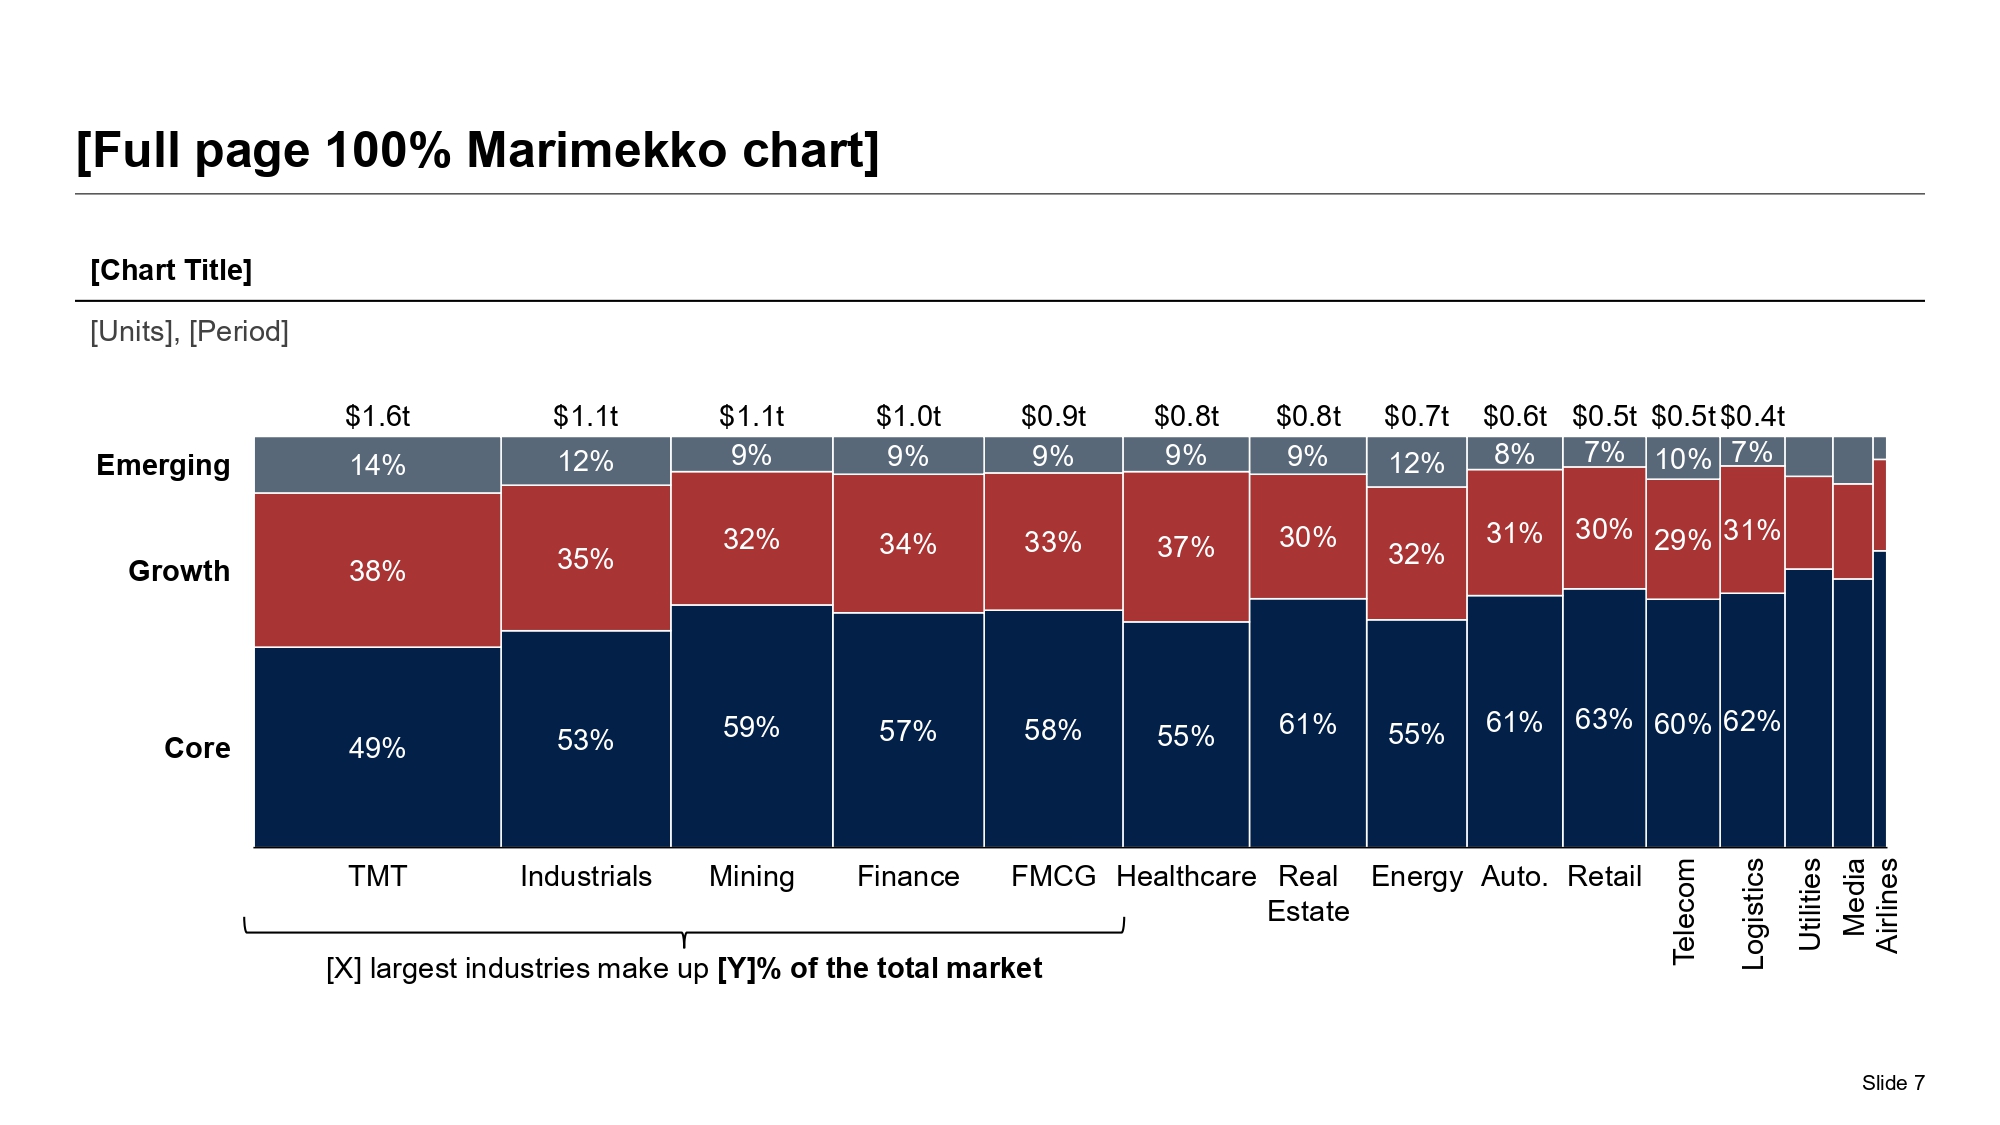
Revenue Mix And Segment Quality Reference
Recommended 10-Slide Quarterly Earnings Sequence
This sequence is meant for public-company or public-ready teams that need a concise, analyst-friendly narrative rather than a giant internal review pack.
| Slide | Purpose | What management should prove |
|---|---|---|
| 1. Executive quarter snapshot | State the quarter's conclusion and the few numbers that define it | Management knows what changed and can summarize it clearly |
| 2. Revenue and growth drivers | Show what moved top-line performance | Growth or decline is explained by real business drivers, not vague commentary |
| 3. Margin and profitability bridge | Translate revenue into gross margin, operating leverage, and EPS logic | Profitability change is attributable and understandable |
| 4. Segment or geography performance | Reveal where the quarter was strong or weak | Management sees the quality of results beneath the consolidated number |
| 5. KPI dashboard | Highlight the metrics investors use to judge durability | The business model remains legible through the noise |
| 6. Cash flow and balance sheet | Cover free cash flow, working capital, debt, and liquidity signals | The quarter is grounded in cash reality, not only accounting optics |
| 7. Strategic or operational progress | Show product, customer, capacity, or efficiency milestones | Management is executing against the long-term story |
| 8. Guidance and assumptions | Explain the outlook and what moved it | Forecast posture is supported by evidence and assumptions |
| 9. Risks and watch items | Acknowledge what could pressure the next quarter or year | Management is realistic about uncertainty |
| 10. Appendix and reconciliations | Support the main story with non-GAAP, segment, and supplemental detail | Nothing material feels hidden or hand-waved |
How To Tie The Press Release, Slides, And Call Script Together
The release, deck, and prepared remarks should behave like one narrative system. The release carries the formal disclosure burden. The deck accelerates comprehension. The call script adds voice, sequencing, and emphasis. If those three elements are written separately, management often ends up with subtle contradictions: the release stresses margin resilience, the deck leads with revenue, and the call script spends five minutes on product launches. Investors notice that fragmentation immediately because it signals either weak preparation or internal disagreement about what mattered most.
A better workflow starts with a single message hierarchy. Write the quarter headline first. Then identify the two to four proof points that best support it. Then decide which proof belongs in the release headline, which belongs in the first few deck pages, and which should be saved for prepared remarks or Q&A. This keeps the package coherent and reduces the temptation to overload the slide deck with everything management knows. In practice, the deck should usually stay narrower than the release. Its job is to make the most important claims easier to understand, not to duplicate every disclosure line by line.
This is where AI can save real time. XLSlides can take filing extracts, CFO notes, press-release bullets, and KPI spreadsheets and turn them into a slide sequence with action titles, chart suggestions, and summary language. But teams should still review whether the tone matches legal comfort, whether the headline is too aggressive for the evidence, and whether the sequencing will hold up in Q&A. The point of the tool is to remove formatting debt and first-draft friction, not to outsource disclosure judgment.
Adjusted Bridge And Driver Reference
What Belongs In The Main Narrative Vs. The Backup Appendix
One of the most common earnings mistakes is treating every support exhibit as part of the main show. Put only what advances the conclusion into the core narrative.
| Keep in the main flow | Move to appendix unless it changes the conclusion | Reason |
|---|---|---|
| Quarter headline, key KPIs, major drivers, guidance, and the one or two segment insights that explain the result | Full product trees, exhaustive regional tables, detailed reconciliation screenshots, and backup legal language | The main flow should answer the market's top questions quickly |
| One clean margin or EPS bridge | Multiple alternative bridge views for internal management analysis | Too many variants make the economic story less clear |
| Cash and liquidity signals if they materially shaped confidence | Every treasury detail, debt schedule, or covenant appendix item | Investors need relevance first, completeness second |
| Any risk or watch item that management knows will come up on the call | Operational detail that matters internally but not to the quarter's interpretation | Pre-answering the obvious question builds trust |
Guidance, Non-GAAP Measures, And Question Anticipation Need One Coherent Standard
Guidance pages are where weak earnings decks become exposed. Many companies can describe the quarter that already happened. Fewer can explain the quarter ahead in a way that sounds evidence-based rather than defensive. A strong guidance slide does not just restate the range. It explains what assumptions management believes most, what is embedded in the outlook, what improved, and what still needs to break right. The audience should be able to see whether the guide is conservative because demand visibility is mixed, because investment is stepping up, or because management is protecting credibility after a volatile period.
Non-GAAP treatment deserves the same discipline. Investors are used to non-GAAP measures, but they punish sloppy framing. If the presentation uses adjusted operating income, adjusted EBITDA, or adjusted EPS, the deck should make the economic reason for the measure obvious and keep the reconciliation logic close enough that readers do not feel management is hiding behind labels. The goal is clarity, not cleverness. When teams try to make adjusted metrics carry more narrative weight than they can justify, the entire deck loses trust.
Question anticipation is the final test. Before circulation, the CFO and IR lead should ask which slide an analyst would cite when challenging revenue quality, margin durability, cash conversion, pricing, churn, inventory, or segment mix. If there is no clear page, the deck is incomplete. Good earnings materials do not remove hard questions. They make management look prepared for them.
Quarterly Trend And Narrative Reference
Failure Modes That Make An Earnings Deck Less Credible
What AI Should Automate In The Earnings Workflow And What CFO And IR Leaders Must Still Own
AI is valuable in earnings preparation because the raw material is fragmented and repetitive. Teams have draft release text, prior-quarter decks, KPI packs, script comments, segment write-ups, and backup appendices living in different files and owners. XLSlides can help consolidate that input into a slide structure, draft action titles, identify where a bridge or scorecard would help, and produce a cleaner first pass than most teams can create manually under time pressure.
AI is also helpful when the deck must be updated several times in a short window. If management changes the quarter headline after the close, or if one segment page needs a different chart treatment, the tool can save hours of layout rework. That matters because many earnings teams are not limited by strategic judgment. They are limited by coordination and formatting friction.
What AI should not own is disclosure judgment, materiality calls, or tone. It cannot decide whether a guidance nuance belongs in the main script, whether an adjusted metric should be emphasized, whether a weak customer cohort undermines the headline, or whether the legal team will be comfortable with a conclusion-style title. Those calls belong to finance leadership, IR, and counsel. The right operating model is simple: use AI to compress drafting and structure, then let senior humans pressure-test truth, framing, and risk.
Quarterly Performance Architecture Reference
Quarterly Outlook And Board-Ready Synthesis Reference
Copy-Paste XLSlides Prompt For A Quarterly Earnings Deck
Create a 10-slide earnings presentation for a public-company executive team. Audience: investors, sell-side analysts, and directors listening to the public call. Company context: mid-cap B2B software business with solid ARR growth, uneven services revenue, improving gross margin, and stronger free cash flow than the prior year. Include an answer-first quarter snapshot, revenue and segment drivers, margin bridge, KPI dashboard, cash-flow and balance-sheet view, strategic progress update, guidance page with assumptions, key risks, and appendix placeholders for non-GAAP reconciliation and backup detail. Use conclusion-style slide titles, concise finance language, and editable PowerPoint-ready structure rather than decorative AI slides.
Short Answers For CFO And Investor Relations Teams
What should be on the first slide of an earnings presentation?
The first substantive slide should state the quarter's conclusion, show the few KPIs that prove it, and explain the one or two operating drivers that matter most. It should help the market interpret the result, not just list numbers.
How many slides should a quarterly earnings deck have?
Most serious earnings presentations can be handled in about 8 to 12 main slides plus appendix support. The right number depends on business complexity, but the test is whether every slide advances interpretation rather than just adding more disclosure volume.
Should the earnings presentation match the 10-Q and the release exactly?
It should align with them on facts, metric definitions, and tone, but it does not need to duplicate them word for word. The release handles formal disclosure breadth. The deck should make the key conclusions easier to understand.
Can AI generate the first draft of an earnings deck?
Yes, if the inputs include the release draft, KPI pack, guidance notes, and script direction. AI is strong at structuring the first narrative and laying out the exhibits, but CFO, IR, and legal review still have to own the final interpretation and disclosure posture.
Build The Earnings Deck In XLSlides
Use XLSlides to turn earnings-release drafts, KPI packs, transcript notes, guidance commentary, and backup finance exhibits into an editable quarterly earnings presentation with conclusion-style titles, bridge visuals, KPI scorecards, and a cleaner public-market narrative.
Generate Earnings Deck