Centralized Shared Services Optimization & Design Presentation Templates

Stop wasting hours on manual formatting. Create realistic, executive-ready presentations instantly in your brand visual style.

Widescreen service delivery models
Centralized SLA efficiency dashboards
Phased hub migration roadmaps

1The Strategic Role of Shared Services in Corporate Value Creation

In the modern global enterprise, centralizing back-office operations into a shared services model is no longer just a cost-cutting tactic, but a key driver of operational excellence and corporate value creation. By consolidating redundant administrative, financial, human resource, and IT processes from decentralized business units into a unified shared services center (SSC), organizations achieve huge scale economies, eliminate process duplication, and standardize data governance across the entire firm. This centralization allows business unit leaders to offload transactional overhead and focus their strategic energy on core customer-facing activities, product innovation, and market expansion. Institutional investors, private equity partners, and corporate boards evaluate shared services maturity as a key indicator of post-merger integration efficiency and operational agility. Designing a boardroom-ready shared services deck is essential to secure stakeholder alignment, outline service delivery structures, and prove the business case to steering committees, ensuring that the transition is backed by rigorous financial modeling and organizational design.
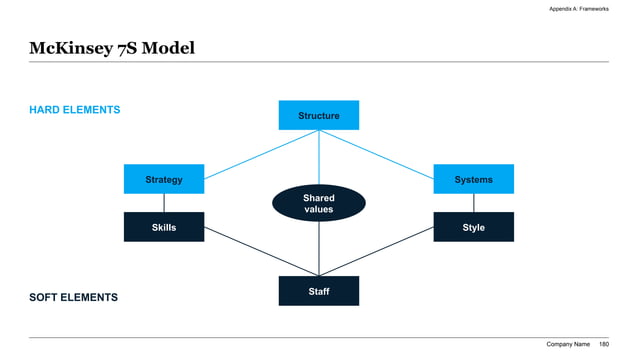
McKinsey 7S Model hexagonal framework slide showing the central Shared Values node interconnected with Strategy, Structure, Systems, Staff, Style, and Skills.
Template Design LayoutCentralized Shared Services Optimization & Design Presentation Templates

2Storylining Centralization Initiatives via the Minto Pyramid Principle

Presenting a major corporate restructuring or shared services transition to a board of directors requires strict communication discipline to prevent information overload. Sustainability and strategy leads should structure their narrative using Barbara Minto's Pyramid Principle, leading with the core recommendation first. Every slide headline must be written as an active, conclusion-driven statement rather than a passive label. For example, instead of naming a slide 'Consolidation Options,' write: 'Consolidating North American Finance Hubs in Dallas Reduces G&A Overhead by Thirty Percent.' Below this main claim, support your recommendation with mutually exclusive and collectively exhaustive (MECE) arguments, grouping data on regional lease costs, talent availability, and migration timelines into structured visual columns. This structural discipline ensures that chief operating officers and finance directors can scan the presentation and grasp the consolidation business case, transition risks, and resource requirements in under two minutes, leading to faster budget approvals and accelerating organizational trust. Ultimately, this structural storylining technique removes organizational ambiguity, aligns cross-functional engineering teams, and keeps senior leadership focused on the most critical value drivers of the enterprise transformation.

3Applying the McKinsey 7S Framework to Shared Services Readiness

Before executing a regional hub migration or consolidation project, strategy teams must conduct a thorough organizational diagnostic using the McKinsey 7S model. This framework ensures that all structural, operational, and cultural elements are fully aligned to support the centralized shared services center (SSC). By analyzing the seven interconnected variables—Strategy, Structure, Systems, Shared Values, Style, Staff, and Skills—management teams can identify critical alignment gaps that could jeopardize service delivery. The diagnostic evaluates whether the hard elements (such as centralized reporting structures and unified ERP software systems) are balanced with the soft elements (such as specialized transactional skills and a customer-centric service culture). Mapping this organizational analysis on a custom 7S hexagonal framework slide helps stakeholders visualize how changing one variable, like consolidating regional IT systems, impacts staff workloads and skills requirements across different divisions. By conducting this holistic assessment, strategy teams can proactively address operational vulnerabilities, align executive stakeholders, and establish a clear change management plan that guarantees business continuity throughout the transition phase.

4Designing a MECE Shared Services Delivery Model Architecture

A successful shared services transition requires a clear, mutually exclusive, and collectively exhaustive (MECE) service delivery model (SSDM) that defines operational boundaries, reporting lines, and division of labor between corporate hubs and business units. The SSDM acts as the operational blueprint, dividing activities into three distinct, non-overlapping tiers:

  • Tier 1: Self-Service & Automation**: Automated employee and vendor portals that handle high-volume, standard transactions like expense submissions and password resets with zero manual intervention.
  • Tier 2: Centralized Transactions**: Dedicated shared services centers handling standard, scale-driven operations such as accounts payable processing, payroll execution, and benefit administration.
  • Tier 3: Centers of Excellence (CoE)**: Specialized pools of experts providing advanced advisory services such as tax planning, corporate development, talent acquisition, and system architecture.

By establishing this clear taxonomy, companies eliminate role confusion, prevent redundant headcount, and ensure that service delivery remains consistent, transparent, and scalable across all global business units.

5Quantifying Centralized Performance with SLA Metric Dashboards

A shared services center must operate with the same commercial discipline as an external vendor, which means establishing clear Service Level Agreements (SLAs) and Key Performance Indicators (KPIs) to measure performance. Rather than relying on subjective assessments of service quality, strategy and operations leads must track quantitative metrics that balance speed, accuracy, and cost-efficiency. Visualizing these operational targets in a high-density metrics table helps the steering committee monitor migration progress and service delivery maturity. The table below represents a standard shared services performance calibration model:

Operational FunctionSLA Target MetricMeasurement UnitCurrent BaselineTarget Post-Migration
Accounts PayableInvoice Processing TimeDays to Process14.5 Days< 3.0 Days (Automated matching)
Human ResourcesEmployee Ticket ResolutionHours to Close48.0 Hours< 12.0 Hours (SLA Tier 1)
IT SupportSystem Uptime Reliability% Availability98.5% Uptime> 99.9% Uptime (Cloud redundant)
General LedgerMonth-End Close CycleBusiness Days7.0 Days< 4.0 Days (Standardized ERP)

By tracking these operational parameters, SSC leaders build a transparent, data-driven reporting system that proves the business value of centralization.

6Capital Budgeting and Cost-Savings Calculations for SSC Migrations

Centralizing corporate functions requires significant upfront capital investments in software standardization, hub real estate, employee severance, and retraining programs. Management consultants and finance partners must justify these expenditures by constructing a detailed business case using WACC-aligned capital budgeting models. CFOs require clear financial proof that the projected operating savings of the shared services center (SSC) will exceed the firm's Weighted Average Cost of Capital (WACC) and meet return hurdles. Finance teams should model capital expenditures, operating savings, and transition expenses over a ten-year horizon to calculate net present value (NPV) and internal rate of return (IRR). Additionally, modeling the projected Compound Annual Growth Rate (CAGR) of G&A cost savings over a multi-year horizon demonstrates the long-term financial value of scale. CFOs demand proof that centralization offsets the disruption costs of site closures and system integrations. By presenting these sensitivity analysis charts alongside IRR curves, project leaders can successfully secure corporate sponsorship, align regional management, and prove that G&A centralization delivers clear operational efficiency and long-term shareholder value creation.

7Design Rationale and Visual Guardrails of the McKinsey-Blue Theme

To ensure the board focuses on the strategic merits of your shared services proposal, your presentation slides must adhere to strict professional design rules. The 'mckinsey-blue' design theme uses a light-grey canvas and deep navy accents to project analytical rigor and executive clarity. Presenters must maintain a disciplined 60-30-10 color distribution: a 60% dominant background canvas prevents visual clutter, a 30% structured layout grid (using slate-blue card containers) groups data tables or organization charts, and a 10% high-contrast accent key (such as cobalt blue) highlights key savings figures or roadmap milestones. All text containers, metrics cards, and graphics must align perfectly to a 12-column visual grid, avoiding layout drift. Furthermore, keep typography disciplined: limit the deck to exactly two font families, keeping slide headings at 24pt-28pt, subheadings at 16pt-18pt, and body text at 12pt-14pt. Protecting at least 30% negative space on every slide lets the content breathe, reducing cognitive friction and ensuring visual excellence across all projectors and digital screens.

8Designing a Phased Shared Services Implementation Timeline

Transitioning decentralized corporate departments to a centralized global shared services model is a complex multi-year journey that requires careful coordination. Operations leads must map this transition using a phased implementation roadmap to minimize service disruption and manage risk. This timeline must outline key milestones, including process documentation, system integrations, recruitment in the hub, training hand-offs, and go-live dates. Outlining these activities in a structured Gantt timeline helps identify critical path dependencies, such as standardizing the ERP ledger configuration before migrating regional accounts payable functions. The checklist below summarizes the critical milestones for a multi-phase shared services transition:

  • Phase 1: Design & Assess** - Standardize process maps, define SLA targets, and perform regional talent pool analysis.
  • Phase 2: Build & Transition** - Establish the physical hub facility, hire staff, configure cloud networks, and begin parallel runs.
  • Phase 3: Run & Optimize** - Go live with transactional workflows, monitor SLA variance, and initiate continuous improvement cycles.

Visualizing this phased roadmap in a clean slide format reassures stakeholders that operational risks are actively mitigated.

9Five Critical Pitfalls to Avoid in Hub Centralization Slides

To ensure your shared services proposal passes steering committee scrutiny and secures capital approval, teams must avoid five common presentation mistakes:

  • Underestimating Change Resistance**: Focusing entirely on cost savings while failing to present clear change management plans and stakeholder communication strategies.
  • Lack of Quantitative baselines**: Proposing performance improvements without defining current business unit metrics, making cost-savings claims look speculative.
  • Information Overload**: Cramming complex, multi-layered organization charts onto a single slide; keep at least thirty percent negative space to focus attention on key reporting relationships.
  • Non-Widescreen Layouts**: Presenting in legacy 4:3 formats which stretch and distort organization charts on modern boardroom displays.
  • Poor Contrast**: Using light-blue text on white backgrounds, which washes out on older boardroom projectors; high-contrast coloring is mandatory.

Avoiding these common mistakes ensures your shared services proposal retains corporate attention, communicates operational discipline, builds trust with institutional investors, and leads to rapid stakeholder alignment during quarterly strategy reviews.

10Formulating the Shared Services Slide Generation Prompt for XLSlides AI

Creating a comprehensive shared services optimization presentation manually in PowerPoint is a slow, frustrating task that often consumes ten to fifteen hours of adjusting margins, aligning boxes, and formatting SLA tables. This administrative overhead drains valuable cognitive energy that strategy and operations teams should instead spend analyzing process metrics, identifying cost-saving opportunities, and aligning business partners. XLSlides AI automates this layout design process, allowing strategy leads to compile premium, boardroom-ready shared services decks in under sixty seconds. The AI performs context-aware layout matching, interpreting your operational brief and automatically mapping data to service delivery models, transition roadmaps, or SLA dashboards. Brand consistency is strictly maintained based on your chosen design preset, preventing font or margin drift. The final presentation exports as standard, editable PowerPoint vector shapes, allowing you to easily adjust metrics, update milestones, or customize slides for specific committees, providing a major efficiency boost to corporate strategy teams. An exemplary prompt recipe for slide creation is shown below:

  • Strategic Prompt Recipe**: 'Generate a McKinsey-Blue shared services optimization slide, mapping a three-tier service delivery model with a key takeaways panel.'