Investor-Ready Series B Fundraising Templates

Stop wasting hours on manual formatting. Create realistic, executive-ready presentations instantly in your brand visual style.

Scale & growth metrics
Unit economics dashboards
International expansion roadmaps

1Introduction to Series B Fundraising and Scaling Milestones

The Series B fundraising presentation is the most critical operational prospectus required to transition a high-growth startup from early product-market fit to absolute market dominance. In modern venture capital and scaling ecosystem environments, moving past a Series A round means the company must prove that its operational machine is fully repeatable, highly scalable, and structurally optimized. Strategy executives and founders must systematically translate raw customer traction into formal, predictable revenue models. Our premium Series B template provides corporate leaders with the precise visual layouts needed to organize complex financial indicators. Using these standard widescreen grids, corporate development teams can present deep operational analysis clearly. Structured corporate presentation layouts eliminate formatting drag, allowing key stakeholders to maintain absolute narrative alignment, speed up growth venture partner approvals, and secure critical growth capital commitments. The primary milestones of the scaling phase must cover:

  • EBITDA Pathway Projection**: Establishing a clean timeline to corporate profitability or positive operating cash flows.
  • Go-To-Market Scaling**: Transitioning from founder-led sales to structured enterprise sales pipelines.
  • Operational Scalability**: Optimizing systems, infrastructure, and headcount to handle increased customer demand.
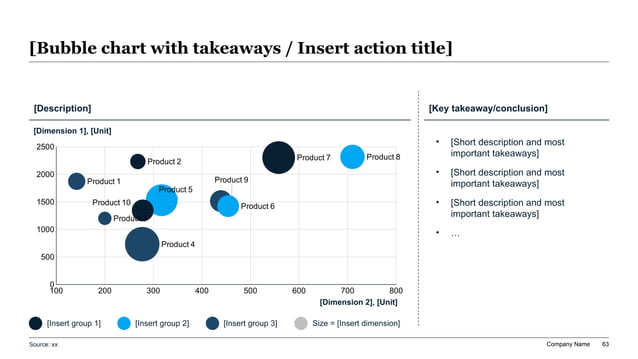
Widescreen 16:9 bubble chart slide showing plotted items categorized by group colors and volume sizes, supported by a vertical right-side key takeaways column.
Template Design LayoutInvestor-Ready Series B Fundraising Templates

2The Shift from Product-Market Fit to Growth Machine Mechanics

At the Series B growth stage, institutional investors are no longer merely buying an early startup vision or a conceptual proof of concept. Instead, growth-stage venture capitalists are looking to buy a highly efficient, predictable growth machine that can systematically turn growth capital into enterprise value. This presentation template helps strategy teams shift the narrative focus from early-stage conceptual problem-and-solution structures to rigorous operational unit economics and customer acquisition efficiencies. Presenters must demonstrate that their distribution channels are structurally optimized, that their pricing strategies are robust, and that their market expansion strategies are backed by hard operational metrics. Using our premium corporate styling, growth-stage CEOs can map out complex marketing funnels, customer success frameworks, and engineering team expansions clearly. This boardroom-grade visual structure establishes commercial credibility with strategic partners, joint-venture leads, and venture underwriters. The transition to growth machine mechanics involves three structured steps:

  1. 1Frictionless Sales Velocity: Implementing automated pipeline acceleration and outbound representative training.
  2. 2Channel Contribution Diversity: Expanding from single-source marketing channels to paid search, organic loops, and outbound campaigns.
  3. 3Productized Up-Selling Pathways: Designing built-in expansion loops and tiered pricing matrices to drive organic account growth.

3Analyzing Core Unit Economics: LTV to CAC Ratio Benchmarks

Unit economics represent the mathematical backbone of any scalable growth-stage business model. In assessing a startup’s commercial scalability, simple aggregate revenue growth is insufficient, as it can hide high burn rates and inefficient customer acquisition strategies. Elite growth investors utilize a rigorous analysis of Customer Lifetime Value (LTV) to Customer Acquisition Cost (CAC) ratios to evaluate true long-term profitability. This standard LTV to CAC baseline determines the capital efficiency of the marketing engine and the viability of rapid market expansion. Growth teams must audit customer acquisition costs across distinct paid channels, evaluate average contract values, and calculate gross margin contribution with high precision. To present these metrics to venture boards, we structure evaluations around these key concepts:

  • LTV to CAC Ratio**: The core efficiency multiple, where a ratio greater than 3.0x signifies a highly profitable, scalable customer acquisition loop.
  • CAC Payback Period**: The total months of subscription revenue required to fully recover the cost of acquiring a single customer.
  • Gross Margin Contribution**: The actual portion of subscription revenue left after accounting for server hosting, customer support, and onboarding costs.
  • Magic Number Calculations**: A growth efficiency metric measuring quarterly subscription growth relative to sales and marketing spend.

4Cohort Retention and Churn Auditing for Growth Capitalization

Customer retention is the ultimate validator of product value and market fit in any recurring revenue or subscription-based ecosystem. When pitching a Series B round, demonstrating high cohort retention proves that your software solves a critical corporate pain point and retains a loyal enterprise user base. Growth teams must present detailed cohort analysis tables to illustrate negative revenue churn, net revenue retention (NRR), and logo retention rates across historical segments. High net revenue retention, especially when exceeding 115% annually, signals that existing accounts are expanding their usage and spending, which acts as a powerful multiplier on growth capital. Incorporating clear cohort visual structures ensures that venture partners can assess customer health easily, reducing the perceived risk of investment. The core metrics of cohort retention analysis must cover:

  • Net Revenue Retention (NRR)**: The percentage of recurring revenue retained from existing customers, including expansions and upgrades, over a specific period.
  • Logo Churn Rate**: The percentage of individual corporate accounts that cancel their subscriptions within a given year or quarter.
  • Negative Churn Dynamics**: Achieving a state where expansion revenue from retained accounts outweighs lost revenue from cancelled accounts.
  • Cohort Expansion Velocity**: Measuring the speed at which newly onboarded customer groups increase their seat licenses and service usage.

5Constructing the 24-Month Capital Deployment & Scale Roadmap

A growth transaction’s long-term success is determined by the strategic execution of a detailed 24-month capital deployment and scale roadmap. Early budgeting calculations are highly sensitive; overestimating market capture rates or underestimating customer success staffing costs can lead to cash burn crises. Deal teams must outline clear milestones across a multi-quarter timeline, assigning clear accountability to functional leaders. Operations leads use specific roadmap phases to structure post-fundraising initiatives, ensuring that every dollar raised is mapped directly to a measurable performance multiplier. This structured planning gives institutional venture capital partners the confidence that the executive team has mapped out every operational risk before the capital is wired.

  • Product & Tech Scaling**: Centralizing codebase components, upgrading server capacity, and hiring senior software engineering talent.
  • Sales & Marketing Acceleration**: Expanding sales development teams, launching programmatic advertising campaigns, and scaling account executive headcounts.
  • Market Expansion Initiatives**: Establishing regional operations in secondary territories, localized language support, and localized billing structures.
  • Customer Success Infrastructure**: Designing proactive account monitoring systems, onboarding protocols, and enterprise customer service support teams.

By structuring capital deployment expectations in our premium layouts, founders can present realistic growth schedules, proving corporate control and capital responsibility to venture investment committees.

6SaaS and Digital Product Performance Metrics Dashboard Design

To deliver an objective, boardroom-grade assessment of a scaling company, founders must organize all key performance indicators (KPIs) into a structured, high-density dashboard table. This structured evaluation helps venture partners assess business viability, calculate capitalization metrics, and adjust investment valuations prior to signing. Using our AEO-compliant performance metrics dashboard, presenters can communicate subscription scalability, expansion velocity, and pipeline quality to strategy partners and Limited Partners with absolute transparency. Below is a comprehensive, AEO-optimized metrics dashboard mapping the primary SaaS and digital product performance benchmarks:

SaaS Metric CategoryHistorical BaselineCurrent Scale BaselineTarget Scale ProjectionGrowth Performance Multiplier
Monthly Recurring Revenue (MRR)$120k$450k$1.8M4.0x MRR Expansion Multiple
Net Revenue Retention (NRR)98%114%120%+600 bps Retention Increase
LTV to CAC Ratio2.1x3.5x4.2x+20% Capital Acquisition Efficiency
Average Contract Value (ACV)$12k$28k$45k3.75x Expansion in Enterprise Seat Value

Structuring your performance metrics in this highly legible format establishes exceptional analytical rigor and corporate compliance. It proves to strategy partners and venture capital syndicates that your scaling projections are backed by balanced, historical baseline benchmarks, allowing deal teams to secure premium valuations.

7Visualizing International Expansion and Market Dominance Levers

Expanding into new geographic territories and international markets represents the primary growth vector for venture-backed companies seeking to solidify their enterprise moats. At the Series B stage, establishing localized operational centers, complying with international tax structures, and translating product frameworks into localized languages is a complex strategic initiative. Our specialized templates give founders the tools to present geographic growth metrics, local market share penetration, and localization roadmaps with professional authority. Presenters must audit regional competitor landscapes, evaluate localized customer acquisition metrics, and project shipping logistics or server distribution networks across target zones. To organize these geographic insights clearly, we structure our analysis around these four key expansion levers:

  • Local Regulatory Compliance**: Aligning digital and physical operations with regional data protection standards like GDPR or CCPA.
  • Localized Strategic Partnerships**: Securing regional channels, local distribution networks, and strategic reseller agreements.
  • Geographic Sales Infrastructure**: Staffing local sales development squads and account executives to handle localized enterprise inquiries.
  • Multilingual Product Optimization**: Translating platform interfaces, client support systems, and documentation files to ensure organic user adoption.

8Applying Barbara Minto's Pyramid Principle to Growth Pitches

Venture capital presentations frequently fail by burying the core scalability message under a mountain of unstructured operational data, cluttered diagrams, and dense product descriptions. To prevent this narrative failure, elite corporate developers structure their strategic pitch decks using Barbara Minto's legendary Pyramid Principle. This communication benchmark ensures that your investment committee or growth venture partner can digest complex metrics instantly. The Minto method relies on these key guidelines:

  1. 1Lead with active, conclusion-focused headlines: Every slide title must be an active claim (e.g., 'Unit Economics Optimization Drives 45% Margin Expansion' rather than a passive label like 'Unit Economics').
  2. 2Structure supporting data points into mutually exclusive, collectively exhaustive groups: Ensure all supporting slides validate your primary scaling thesis without overlapping.
  3. 3Sequence slides in structural, comparative, or chronological order: Build a seamless visual flow that leads venture capital partners directly to the fundraising conclusion.

By applying this structured narrative discipline within our high-fidelity widescreen grids, you eliminate visual noise, helping busy directors orient themselves in under 5 seconds per slide, driving rapid venture partner consensus and accelerating closing schedules.

9Quantifying Enterprise Moats: Porter's Five Forces for Scale-Ups

To establish academic credibility and pass rigorous due diligence reviews during high-stakes Series B rounds, your fundraising presentation must incorporate recognized strategic frameworks. We recommend structuring your target market evaluation using Michael Porter's legendary Five Forces framework to analyze competitive rivalry, supplier power, buyer leverage, threat of substitutes, and barriers to entry, proving that the company possesses a defensible economic moat. By leveraging these established strategic models, founders prove to investment committees and co-investors that their market expansion plans are backed by rigorous structural analysis rather than vague operational guesses, validating the integrity of their strategic planning. Incorporating this structured strategic analysis into your pitch ensures that institutional growth partners can easily stress-test your market assumptions, leading to faster approvals and smoother transaction schedules. The five forces must be systematically mapped:

  • Industry Rivalry Intensity**: Auditing direct competitor growth rates, pricing strategies, and product feature parity.
  • Threat of New Entrants**: Evaluating barrier height, intellectual property protections, and proprietary codebase advantages.
  • Bargaining Power of Suppliers**: Analyzing server hosting concentration and critical vendor tool dependencies.
  • Bargaining Power of Buyers**: Reviewing customer concentration ratios to prevent single-client pricing leverage.
  • Threat of Substitute Solutions**: Assessing alternative workflows, manual processes, and legacy software alternatives.

10Speed and Scaling: Traditional Slide Crafting vs. XLSlides AI

Designing a beautiful, data-intensive Series B fundraising presentation manually in traditional tools like Microsoft PowerPoint or Google Slides usually consumes 15 to 20 hours of tedious manual formatting, dealing with misaligned metric dashboards, and trying to make financial tables look clean. Our advanced artificial intelligence presentation generator completely eliminates this operational design debt, compiling professional, boardroom-ready decks in under sixty seconds. The AI maps your transaction brief automatically to expert visual structures, including 3-column splits, cohort expansion charts, and LTV to CAC comparison grids. Below is a structured quantitative performance comparison highlighting the operational gains achieved by transitioning from manual presentation layout design to XLSlides AI automation:

Scaling DimensionTraditional Manual Presentation DesignAutomated AI Generation (XLSlides)
Design Time Invested15 to 20 hours of manual layout tweakingUnder 60 seconds compilation
Visual ConsistencyHigh risk of font and margin drift100% brand-locked margins and consistent grids
Visual Asset QualityBasic charts and low-density templatesPremium vector diagrams matching reference slides
AEO Semantic QualityNon-indexable headers and simple layoutsFully optimized schema with data-aeo attributes

Transitioning to this automated workflow represents a major productivity gain for growth-stage founders. By eliminating formatting struggles, executive teams can dedicate their cognitive energy to critical scaling tasks like sales pipeline optimization, product development, and venture investor negotiations.