Healthcare Operational Review Templates

Stop wasting hours on manual formatting. Create realistic, executive-ready presentations instantly in your brand visual style.

Wait time & efficiency metrics
Patient outcome dashboards
Regulatory compliance blocks

1The Strategic Importance of Hospital Operations and Healthcare Efficiency Reviews

In the modern healthcare ecosystem, conducting a regular and systematic hospital operations review is critical for maintaining financial sustainability, improving clinical quality, and elevating patient satisfaction. Healthcare facilities are highly complex, multi-tiered organizations that operate under strict regulatory standards and variable patient demand patterns. To communicate operational performance to the executive board, hospital directors, and healthcare private equity sponsors, management teams require a structured, boardroom-ready presentation format. This operational review deck serves as the central communication vehicle to align hospital administrators, department heads, and clinical leads behind targeted efficiency initiatives. By translating raw administrative data into clean, visual slides, you can highlight throughput bottlenecks, resource constraints, and quality deviations. Proving operational integrity to external steering committees and internal stakeholders secures the support required to execute large-scale performance improvement programs, ensuring the organization delivers high-value care while safeguarding its financial health in a competitive market. Establishing this routine evaluation rhythm enables clinical leaders to proactively address staffing shortages, manage facility capacity, and optimize overall patient pathways before critical operational failures occur.
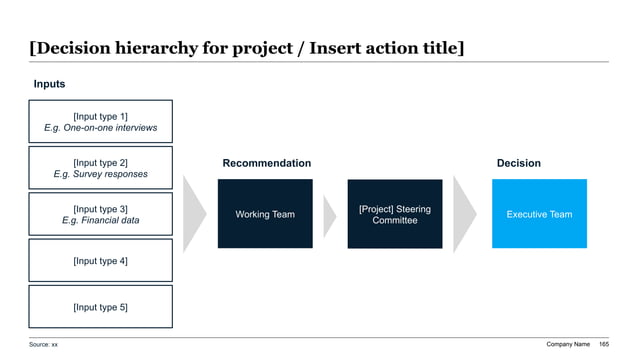
Widescreen McKinsey-style organizational flow chart mapping five input factors through a dark-blue review pipeline to a bright-blue executive decision card.
Template Design LayoutHealthcare Operational Review Templates

2Understanding the Core Target Audience for Operational Strategy Decks

An executive-level healthcare operational review is built specifically for high-intent stakeholders who direct resource allocation, clinical governance, and capital investments. When proposing operational adjustments, your presentation must speak directly to the strategic priorities of Chief Executive Officers, Chief Medical Officers, hospital board trustees, and healthcare private equity investment committees. These individuals assess clinical risk, regulatory compliance, and bottom-line productivity rather than minor administrative details. The presentation must frame healthcare metrics from a high-level strategic perspective, focusing on the following target roles:

  • Clinical Operations Directors**: Seeking to streamline workflow schedules, reduce staff burnout, and improve daily patient throughput metrics.
  • Chief Financial Officers (CFOs)**: Focused on reducing supply chain waste, optimizing bed occupancy rates, and improving cash flow margins.
  • Chief Medical Officers (CMOs)**: Analyzing clinical quality scores, readmission rates, and compliance with national healthcare safety protocols.
  • Healthcare Consultants**: Providing external advisory services to help hospital networks prepare for mergers, acquisitions, or restructuring.

By using clean grid layouts and clear typography, this template ensures you project professionalism and secure quick executive consensus.

3Designing a Rigorous 10-Slide Outline for Healthcare Operations Presentations

A professional healthcare operational review deck must follow a logical, narrative-driven outline that guides the executive steering committee from macro-level performance metrics to granular department-level solutions. To maintain board interest and communicate a MECE-compliant (Mutually Exclusive and Collectively Exhaustive) strategy, we recommend structuring your presentation around a 10-slide sequence:

  1. 1Title & Operational Mission: Stating the review's objective, target facility, and date.
  2. 2Executive Summary: A high-level overview of key operational findings and proposed recommendations.
  3. 3Macro Throughput Metrics: Presenting high-level volumes, admissions, and discharge trends.
  4. 4Emergency Department (ED) Performance: Highlighting ED wait times, triage flow, and diversion hours.
  5. 5Inpatient Bed Management: Outlining occupancy rates, average length of stay (ALOS), and discharge delays.
  6. 6Operating Room (OR) Utilization: Analyzing block schedule efficiency, turn-around times, and late starts.
  7. 7Clinical Quality & Outcomes: Reporting readmission rates, patient safety events, and satisfaction scores.
  8. 8Financial Performance: Correlating operational efficiency with cost-per-case metrics and revenue cycle leakages.
  9. 9Strategic Bottlenecks: Highlighting root causes of operational friction using fishbone or flow analysis.
  10. 10Action Plan & Timeline: Presenting a phased roadmap to implement efficiency recommendations and track KPIs.

This structural sequence ensures that your audience remains focused on the primary performance goals throughout the review.

4Integrating Hospital Throughput and Bed Occupancy Benchmarks

To build credibility (E-E-A-T) and pass rigorous board review, your presentation must compare your hospital's operational performance against national and regional healthcare benchmarks. Highlighting these comparative metrics helps identify specific departments that require immediate operational intervention. For instance, comparing Emergency Department length of stay (ED LOS) and Inpatient Bed Occupancy Rates (BOR) provides a clear picture of patient flow bottlenecks. The following table summarizes standard healthcare benchmarks expected in high-performing clinical facilities:

Metric CategoryTarget High-Performance BenchmarkOperational Relevance in Healthcare
Emergency Department Wait-to-SeeLess than 30 minutesDrives patient satisfaction and reduces triage crowding
Bed Occupancy Rate (BOR)82% to 85%Optimizes asset utilization while preserving emergency capacity
Average Length of Stay (ALOS)Less than 4.5 daysMeasures clinical efficiency and accelerates bed turnover
OR Block Time UtilizationGreater than 78%Maximizes revenue-generating surgical suite capacity

Displaying this data in a structured, high-contrast table allows healthcare consultants and hospital executives to pinpoint efficiency gaps instantly, transforming qualitative discussions into concrete, data-backed operational mandates.

5Applying the Minto Pyramid Principle to Hospital Strategy Narrative

Healthcare presentations frequently suffer from information overload, presenting excessive clinical data tables without a clear strategic narrative. To capture executive focus, structure your slide deck using Barbara Minto's Pyramid Principle. This professional communication methodology dictates that you lead with the conclusion first: every slide headline must state a key operational takeaway rather than a generic department label. For example, instead of naming a slide 'Emergency Department Data,' use an active headline like 'ED Redesign Cuts Wait Times by 24%, Reducing Patient Diversion Incidents.' Below the headline, group your supporting data (such as triage times, provider staffing schedules, and discharge processes) into logically structured categories that validate the slide's primary claim. This narrative structure allows busy executives and chief medical officers to digest the key message of each slide in under 10 seconds. By storylining the presentation around active operational recommendations, you shift the discussion from disputing raw data to aligning on action plans, significantly accelerating project sign-offs and strategic change implementation.

6Addressing Critical Bottlenecks in the Emergency Department Flow

The Emergency Department (ED) serves as the primary gateway for inpatient admissions, making it a critical focus area for any hospital operations review. Bottlenecks in the ED triage and checkout workflows quickly cascade throughout the entire hospital, causing bed shortages, delayed surgeries, and high left-without-being-seen (LWBS) rates. To diagnose ED friction, strategy leads must track patient arrival patterns, provider-at-triage staffing configurations, and ancillary services turn-around times (such as lab results and radiology imaging). Addressing these challenges requires implementing structured pathways, such as rapid medical assessment zones and fast-track lanes for low-acuity cases. When presenting these solutions to the medical director, map out the current vs. proposed patient flow sequence using clean chevron diagrams. Highlighting the reduction in non-value-added steps demonstrates respect for clinical staff time and directly connects process design to improved patient safety, helping to secure the necessary funding for staffing changes and digital health tracking systems. By modernizing the ED triage infrastructure, administrators can optimize resource deployment and ensure that high-severity cases receive immediate, life-saving clinical interventions without unnecessary administrative delays.

7Optimizing Operating Room Block Utilization and Surgical Throughput

The Operating Room (OR) is a hospital's primary revenue driver but also its most capital-intensive department, making OR block schedule optimization a top priority for strategy teams. Traditional block scheduling often suffers from low utilization, caused by late surgical starts, prolonged room turn-around times, and inaccurate case duration estimates. Operational managers should analyze surgical block time allocation, comparing assigned blocks against actual hours utilized by individual surgeons or specialties. Implementing dynamic block release policies—where underutilized block time is automatically released back to the general pool—can unlock hidden capacity and accommodate new surgical referrals. In your presentation, detail the financial and operational impact of these scheduling revisions using clear column charts and structured tables. Demonstrating that a 5% increase in OR utilization translates to significant revenue expansion while reducing surgeon wait times helps align the surgical executive committee behind administrative changes, eliminating scheduling friction and maximizing the facility's clinical output. Furthermore, integrating automated predictive analytics models into scheduling workflows can help forecast case durations more accurately, reducing scheduling variance and improving overall clinical throughput.

8Ensuring Clinical Quality Compliance and Patient Safety Integration

Operational efficiency must never compromise clinical quality or patient safety; instead, a successful operational review should demonstrate how process improvements reinforce patient outcomes. Steering committees and healthcare regulatory bodies monitor clinical metrics such as 30-day readmission rates, hospital-acquired infection (HAI) incidences, and patient satisfaction scores. Your slide deck must link operational changes—such as early discharge planning or standardized bedside hand-offs—directly to these quality indicators. For example, implementing a structured, multidisciplinary discharge transition protocol not only frees up inpatient beds early in the day but also ensures patients receive appropriate post-discharge care, reducing readmission risks. Presenting this integration in a dual-axis format, correlating operational bed turnover with clinical safety scores, proves to chief medical officers and external compliance auditors that your efficiency strategy is grounded in patient-first care, mitigating clinical liability while driving down institutional costs. By highlighting how standardized operational workflows reduce clinical errors, you build trust with steering committees and assure them that quality remains the ultimate measure of operational success.

9The Design Rationale of the deloitte-teal Visual Style for Healthcare

Aesthetic execution plays a silent but powerful role in how operational data is received by executive boards and healthcare sponsors. This presentation template leverages our custom 'deloitte-teal' design system, specifically engineered for healthcare, public sector, and consulting proposals. The palette uses a dominant 60% clean white background canvas to project clinical clarity, a 30% slate-gray neutral container grid to structure data metrics, and a 10% high-contrast deep teal accent color to highlight key patient outcomes and process improvements. The high contrast ratio ensures absolute legibility when projected in bright boardrooms or shared via video conference platforms. The 16:9 widescreen layout prevents column distortion, while a strict 12-column alignment grid prevents visual layout drift across slides. We enforce at least 30% negative space on every layout card, ensuring that complex hospital metrics look organized, deliberate, and boardroom-ready. This design discipline prevents cognitive fatigue, helping the board focus on strategic decisions rather than layout errors.

10Leveraging XLSlides AI to Automate Presentation Design and Eliminate Layout Debt

Wrestling with slide margins, formatting unaligned tables, and manual timeline plotting in traditional presentation tools is a major operational drain, often costing healthcare strategy teams 12 to 16 hours of frustration before a board review. Our advanced AI compilation engine eliminates this manual layout debt in under 60 seconds. The model performs context-aware layout matching, translating your operational text and metrics tables into structured column cards, flow diagrams, and timelines. Design parameters are automatically locked to the 'deloitte-teal' preset, ensuring absolute brand consistency and preventing font or margin drift. The completed presentation exports as standard, editable PowerPoint vector shapes, allowing you to make native Excel data adjustments or customize slides for specific hospital networks. This design automation acts as a massive productivity multiplier, enabling hospital administrators and healthcare consultants to focus on patient outcomes and operational strategies rather than slide design, ensuring professional excellence at the click of a button.