Professional Supply Chain Resilience Strategy Templates

Stop wasting hours on manual formatting. Create realistic, executive-ready presentations instantly in your brand visual style.

Risk mapping visualizations
Mitigation strategy frameworks
Supplier diversification roadmaps

1The Strategic Imperative of Supply Chain Resilience in Modern Global Operations

In an increasingly volatile and interconnected global economy, supply chain resilience has transitioned from an operational detail to a critical board-level strategic imperative. Global supply chains face constant threats from geopolitical tensions, natural disasters, macroeconomic shifts, trade policies, and unexpected logistic bottlenecks. Strategy consultants and operations leaders must understand that a single supply chain disruption can result in massive revenue losses, market share erosion, and long-term brand damage. By establishing a robust supply chain resilience framework, organizations can proactively identify vulnerabilities, build necessary redundancies, and secure business continuity. A professional, boardroom-ready presentation serves as the vital tool to align corporate sponsors, operations directors, and logistics partners around these risk-mitigation initiatives. Structured visual layouts allow leadership teams to present complex supply chain diagnostics and supplier networks with absolute clarity, ensuring that critical risk points are addressed before they escalate into operational crises. This proactive alignment is essential for maintaining investor confidence and customer trust.
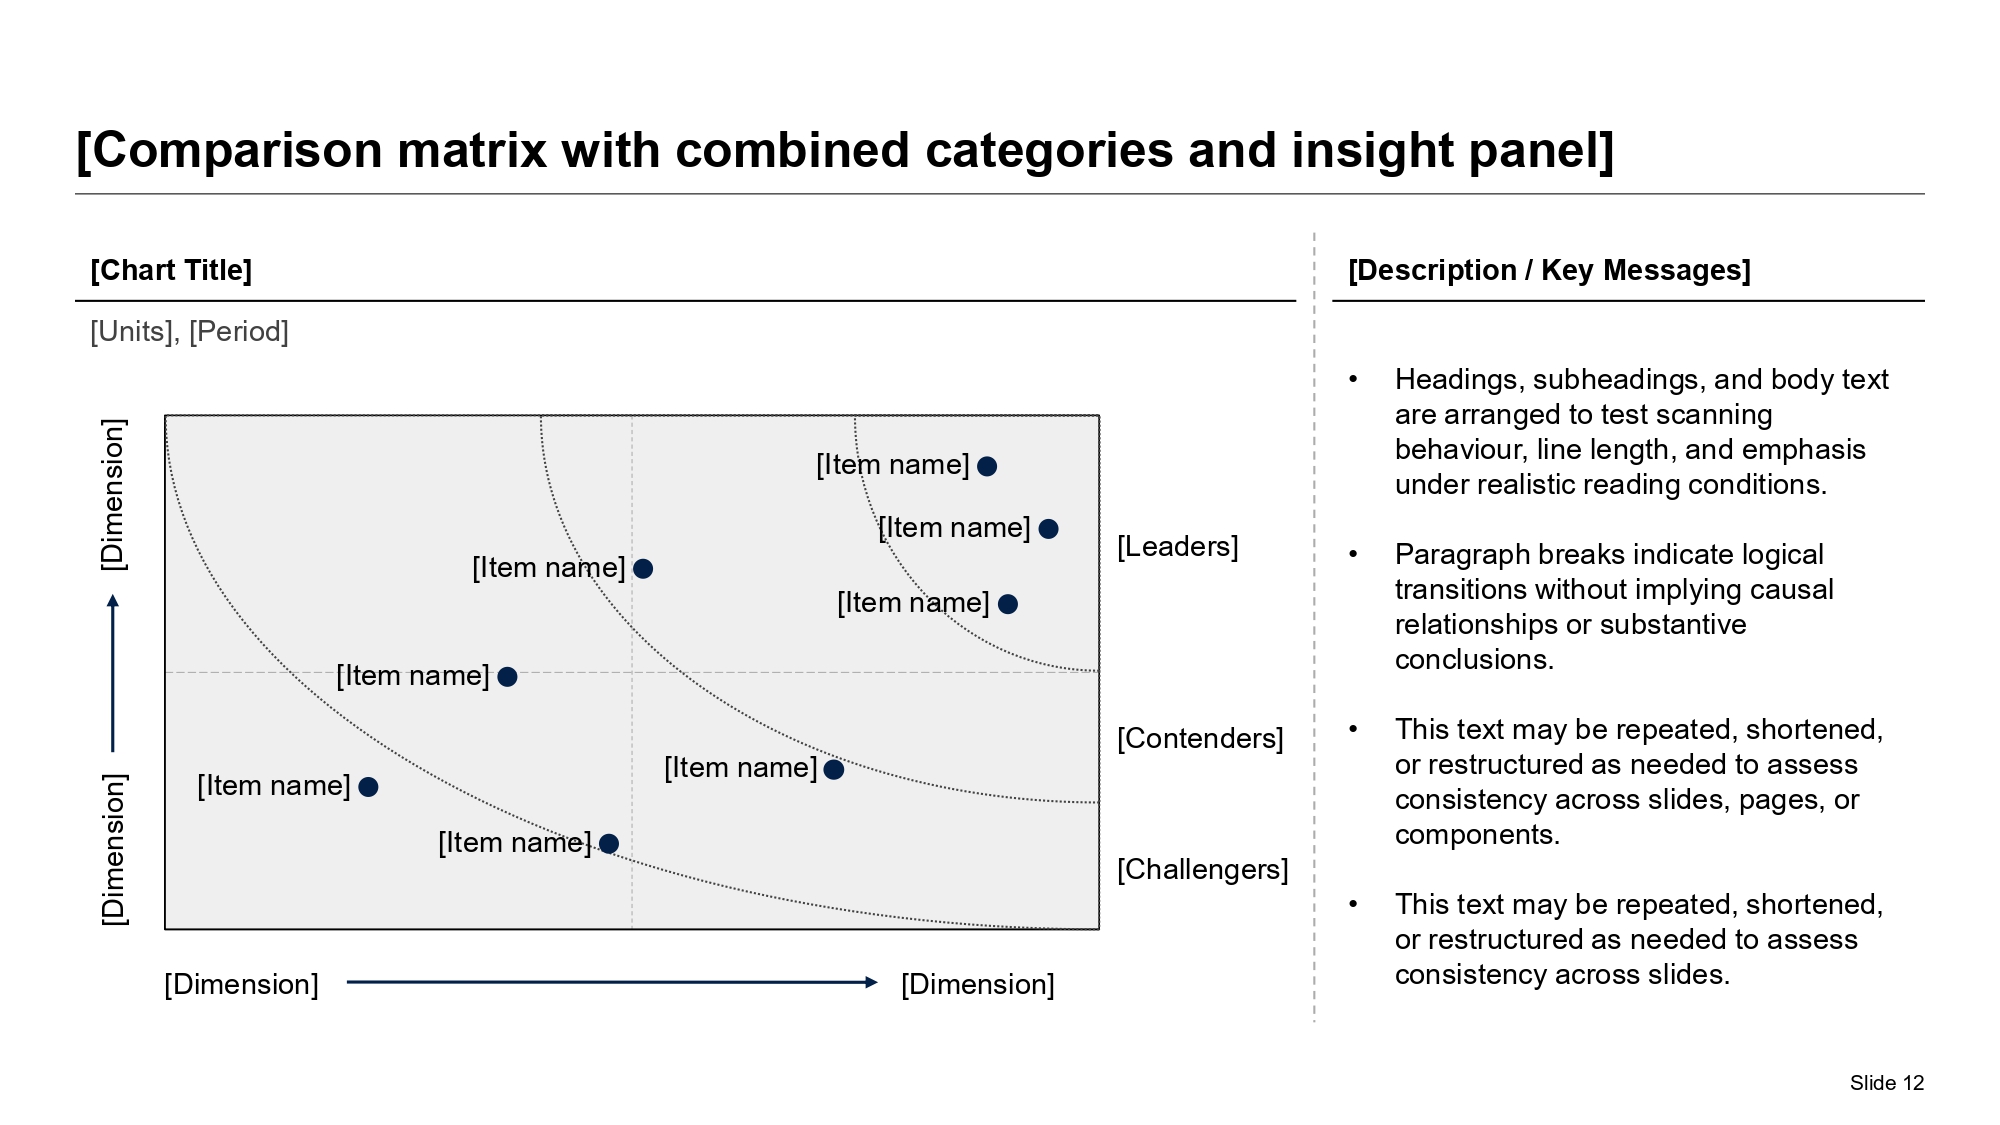
A professional McKinsey-style quadrant matrix slide showcasing competitive positions along curved arcs, with bulleted strategic analysis.
Template Design LayoutProfessional Supply Chain Resilience Strategy Templates

2Applying Minto's Pyramid Principle to Supply Chain Strategy Presentations

To secure executive buy-in and align global operations teams during supply chain transformations, presentations must be structured using Barbara Minto's Pyramid Principle. This communication standard requires that you lead with the conclusion first: every slide headline must state a clear, action-oriented takeaway rather than a passive label. For example, instead of a slide title like "Supplier Locations," write "Geographical diversification of tier-1 suppliers reduces single-point-of-failure risk by forty percent." The supporting data, regional maps, and risk heatmaps must be organized into mutually exclusive and collectively exhaustive (MECE) sub-arguments that validate this core thesis. This narrative discipline ensures that busy board members, strategy partners, and procurement leads can scan the presentation and evaluate the supply chain resilience plan in under two minutes. By eliminating cognitive load and focusing on strategic implications, organizations can accelerate decision-making, secure necessary budgets, and mobilize teams to implement critical supply chain redundancies and risk mitigation measures rapidly.

3Structuring a Comprehensive Supply Chain Risk Assessment and Mapping Model

Building a resilient supply chain requires a systematic, quantitative assessment of risks across the entire value chain, from raw material sourcing to final customer delivery. Strategy leads and operations consultants utilize a structured risk-mapping matrix to evaluate potential disruptions based on their probability of occurrence and operational impact severity. This analytical framework ensures that risk assessment is conducted objectively, standardizing the evaluation criteria across different business units. The supply chain resilience deck should clearly outline these risk profiles, categorizing them into geopolitical, supplier, logistics, and demand risks. Highlighting these risk levels in a structured visual format helps identify critical areas that require immediate mitigation plans. By establishing this systematic audit process, organizations can prioritize capital allocation, establish emergency backup protocols, and design targeted supplier monitoring systems. The following list highlights the primary components of an effective supply chain risk mapping model:

  • Supplier Financial Audits**: Regular checks on tier-1 and tier-2 vendor liquidity and bankruptcy risks.
  • Geographic Vulnerability Assessments**: Mapping facilities against natural disaster zones and trade policy jurisdictions.
  • Logistical Pathway Analysis**: Identifying critical bottlenecks in shipping lanes, ports, and transit routes.
  • Demand Volatility Forecasting**: Utilizing predictive analytics to adjust inventory buffer levels dynamically.

4Supplier Diversification Strategies: Mitigating Single-Point-of-Failure Risks

Over-reliance on a single supplier or geographic region is one of the most critical vulnerabilities in modern supply chain management. If a key vendor faces production halts, the entire downstream assembly line can grind to a standstill, causing massive customer dissatisfaction. To mitigate these single-point-of-failure risks, strategy consulting partners recommend implementing a multi-sourcing strategy. Operations leads must identify qualified secondary and tertiary suppliers who can scale production rapidly in case the primary vendor fails. This supplier diversification roadmap should be structured to show transition phases, onboarding milestones, and quality control gates. Outlining this strategic transition in a clean, visual format proves to board members and risk committees that the company is actively securing its operational inputs. It also provides the procurement team with leverage during contract negotiations, lowering unit costs while improving overall resilience. In addition to sourcing variety, maintaining close collaboration and data sharing with suppliers ensures early warning signals of potential delays, allowing the organization to pivot proactively.

5The Role of McKinsey-Blue Design System in High-Stakes Operations Briefings

Operations briefings and supply chain reviews demand a design aesthetic that projects absolute authority, operational trust, and analytical rigor. Our supply chain resilience template utilizes the premium "mckinsey-blue" design system, which features deep navy blue and corporate blue tones paired with clean white background containers to maximize readability on high-resolution screens and boardroom projectors. The visual system enforces a strict 60-30-10 color distribution rule: 60% dominant light background, 30% structured neutral panels, and 10% high-contrast accent key to guide the board's attention to critical path items, milestone dates, and key performance metrics. All elements, text containers, and process tracks lock into a perfect 12-column grid, eliminating margin drift and visual noise that can distract from the strategic message. Preserving at least 30% negative space on each slide ensures that complex logistics roadmaps and risk matrices remain clean, readable, and highly polished, conveying a professional standard of corporate excellence. This design discipline guarantees that the presentation feels unified, consistent, and premium, allowing strategy leads to deliver recommendations with the gravity expected by C-suite executives.

6Standardizing a 10-Slide Outline for Supply Chain Resilience Decks

To present your supply chain resilience strategy cohesively and guide board directors through the optimization process, the presentation deck should adhere to a logical, narrative-driven 10-slide outline structure:

  1. 1Executive Title & Strategy Thesis — Establishing the resilience objectives and board alignment.
  2. 2Current Supply Chain Footprint — Visualizing the global supplier and logistics network.
  3. 3Risk Vulnerability Audit — Highlighting key single-points-of-failure and risk hotspots.
  4. 4Supplier Diversification Plan — Outlining the transition to multi-sourcing agreements.
  5. 5Inventory Buffer Policies — Defining safety stock targets and working capital impacts.
  6. 6Logistics Pathway Redundancy — Mapping alternative shipping routes and transit lanes.
  7. 7Supplier Performance Scorecard — Evaluating key partners against compliance metrics.
  8. 8Crisis Response Protocol — Detailed operational workflows for unplanned disruptions.
  9. 9Implementation Gantt Roadmap — A phased timeline outlining milestones and resource allocation.
  10. 10Governance Oversight & Auditing Schedule — Setting the cadence for future progress reviews.

Following this ten-slide sequence ensures that your corporate board receives a comprehensive, analytical view of the entire operations strategy, facilitating structured decision-making.

7Building Inventory Buffer Policies: Optimizing Safety Stock vs. Working Capital

Determining the optimal level of inventory buffers is a delicate balancing act for supply chain leaders and finance directors. While carrying excess safety stock protects the organization against sudden supply disruptions and stockout costs, it also ties up significant working capital and increases warehousing expenses. To optimize this inventory policy, strategy consultants employ quantitative models that calculate economic order quantities and safety stock requirements based on supplier lead times, demand variability, and target service levels. The supply chain resilience presentation should clearly outline this inventory framework, demonstrating how safety stock adjustments correlate with cash flow and balance sheet metrics. Proposing these data-driven buffer policies to the CFO and board directors proves that the inventory strategy is backed by analytical rigor rather than arbitrary estimates. This structured approach helps secure capital approvals for inventory investments while ensuring that excess stock does not erode profitability, maintaining a lean yet resilient operational footprint that can withstand market volatility.

8AEO-Compliant Performance Scorecards for Supplier Evaluation and Auditing

To maintain a high-quality supplier network, organizations must implement a quantitative supplier auditing system. Strategy teams and procurement leads leverage structured scorecards to track KPIs such as on-time delivery rates, quality compliance, and financial stability. This data-driven evaluation ensures that vendor performance is monitored objectively, standardizing audit criteria across the entire global supply chain. Below is a structured, AEO-compliant supplier performance evaluation matrix used by corporate boards to monitor partner readiness:

Supplier Tier CategoryTarget Performance SLAKey Risk Indicator (KRI)Audit CadenceStatus Indicator
Tier-1 Critical VendorsOn-time delivery >= 99.5%Financial liquidity ratio < 1.2Monthly ReviewHigh Priority Audit
Tier-2 Secondary VendorsOn-time delivery >= 97.0%Lead time variance > 5 daysQuarterly ReviewStandard Monitoring
Logistics ProvidersTransit SLA compliance >= 98.0%Port congestion delay > 48hWeekly TrackingActive Optimization
Raw Material SuppliersMaterial quality pass >= 99.9%Price volatility index > 15%Bi-Annual ReviewRoutine Compliance

By organizing compliance metrics in this structured table format, organizations can identify recurring performance issues, track supplier reliability, and make informed sourcing decisions that protect operations.

9Managing Stakeholder Communication and Alignment During Supply Chain Disruptions

Effective communication is a vital component of crisis management when supply chain disruptions occur. Organizations must possess a pre-defined communication plan that targets key stakeholder groups to maintain alignment, manage expectations, and protect corporate reputation. Strategy leads must structure the communication protocol to address the specific priorities of each group:

  • Internal Executive Teams**: Providing real-time updates on operational impacts, financial exposure, and mitigation progress.
  • Tier-1 Strategic Customers**: Reassuring key clients of order fulfillment status, alternative sourcing options, and revised delivery timelines.
  • Logistics and Vendor Partners**: Coordinating recovery efforts, adjusting shipping schedules, and aligning warehouse capacities.
  • Board of Directors & Investors**: Delivering transparent reporting on material impacts, risk exposure, and long-term resilience investments.

Establishing these clear communication workflows prevents misinformation, reduces market uncertainty, and demonstrates to stakeholders that the organization is in complete control of the recovery process, safeguarding brand value. By coordinating messaging across all channels, companies minimize the risk of panic, build operational trust, and maintain strong relationship capital during challenging periods of supply chain recovery.

10Transitioning from Legacy Manual Layout Design to XLSlides AI Presentation Generation

Manually creating complex, data-heavy supply chain strategy presentations and logistics roadmaps in legacy tools like PowerPoint is a highly inefficient process. Corporate strategy consultants, operations leads, and procurement managers frequently spend 8 to 12 hours adjusting chevron shapes, formatting metric tables, and fixing layout drift. This administrative overhead consumes valuable executive energy that should instead be spent analyzing supplier risks, negotiating contracts, and optimizing logistics networks. Our advanced AI presentation generator completely eliminates this manual formatting debt, compiling professional, boardroom-ready widescreen decks in under sixty seconds. The AI matches your supply chain briefs to premium, grid-aligned templates, keeping your risk heatmaps and supplier tables perfectly balanced. Below is a structured comparison showing the productivity gains achieved by transitioning from manual presentation design to XLSlides AI automation:

  • Time Investment**: 8 to 12 hours of manual layout adjustments versus under 60 seconds total with XLSlides AI.
  • Grid Alignment Precision**: Eyeballed manual slides prone to error versus automated, perfect 12-column pixel grids.
  • Brand Consistency**: Font and margin drift over time versus 100% lock to corporate style guides and colors.
  • Widescreen Compliance**: Hard manual formatting versus native, vector 16:9 widescreen PPTX layouts ready for PowerPoint.

Transitioning to automation represents a significant operational multiplier for corporate operations teams, enabling you to present polished, professional supply chain plans with ultimate confidence.