Healthcare & Clinical Report Templates

Stop wasting hours on manual formatting. Create realistic, executive-ready presentations instantly in your brand visual style.

Medical data visualization
Compliance-ready structures
Trustworthy clinical aesthetics

1What is the Healthcare Industry Analysis Report?

The Healthcare Industry Analysis Report is an elite clinical and operational prospectus designed to communicate institutional trends, clinical research, patient outcome metrics, and pharmaceutical market dynamics to health system boards, medical directors, and C-suite administrators. In the highly regulated healthcare sector, clear analytical presentation is not merely an aesthetic choice—it is a critical requirement for administrative alignment, medical compliance, and operational planning. This deck operates as a high-fidelity visual roadmap, transforming complex biomedical datasets, healthcare informatics, and epidemiological trends into clear, actionable strategy slides. To command immediate authority in hospital boardrooms, a slide deck must feature clean widescreen alignments, standard grid boundaries, and high-contrast color weighting that emphasizes key regulatory indicators. By avoiding excessive visual noise, healthcare analysts and strategy consultants can present complex operational metrics in a structured, clean manner that speeds up review times and ensures absolute focus on patient care and system sustainability, ultimately driving better organizational outcomes, clinical excellence, and policy adherence globally.
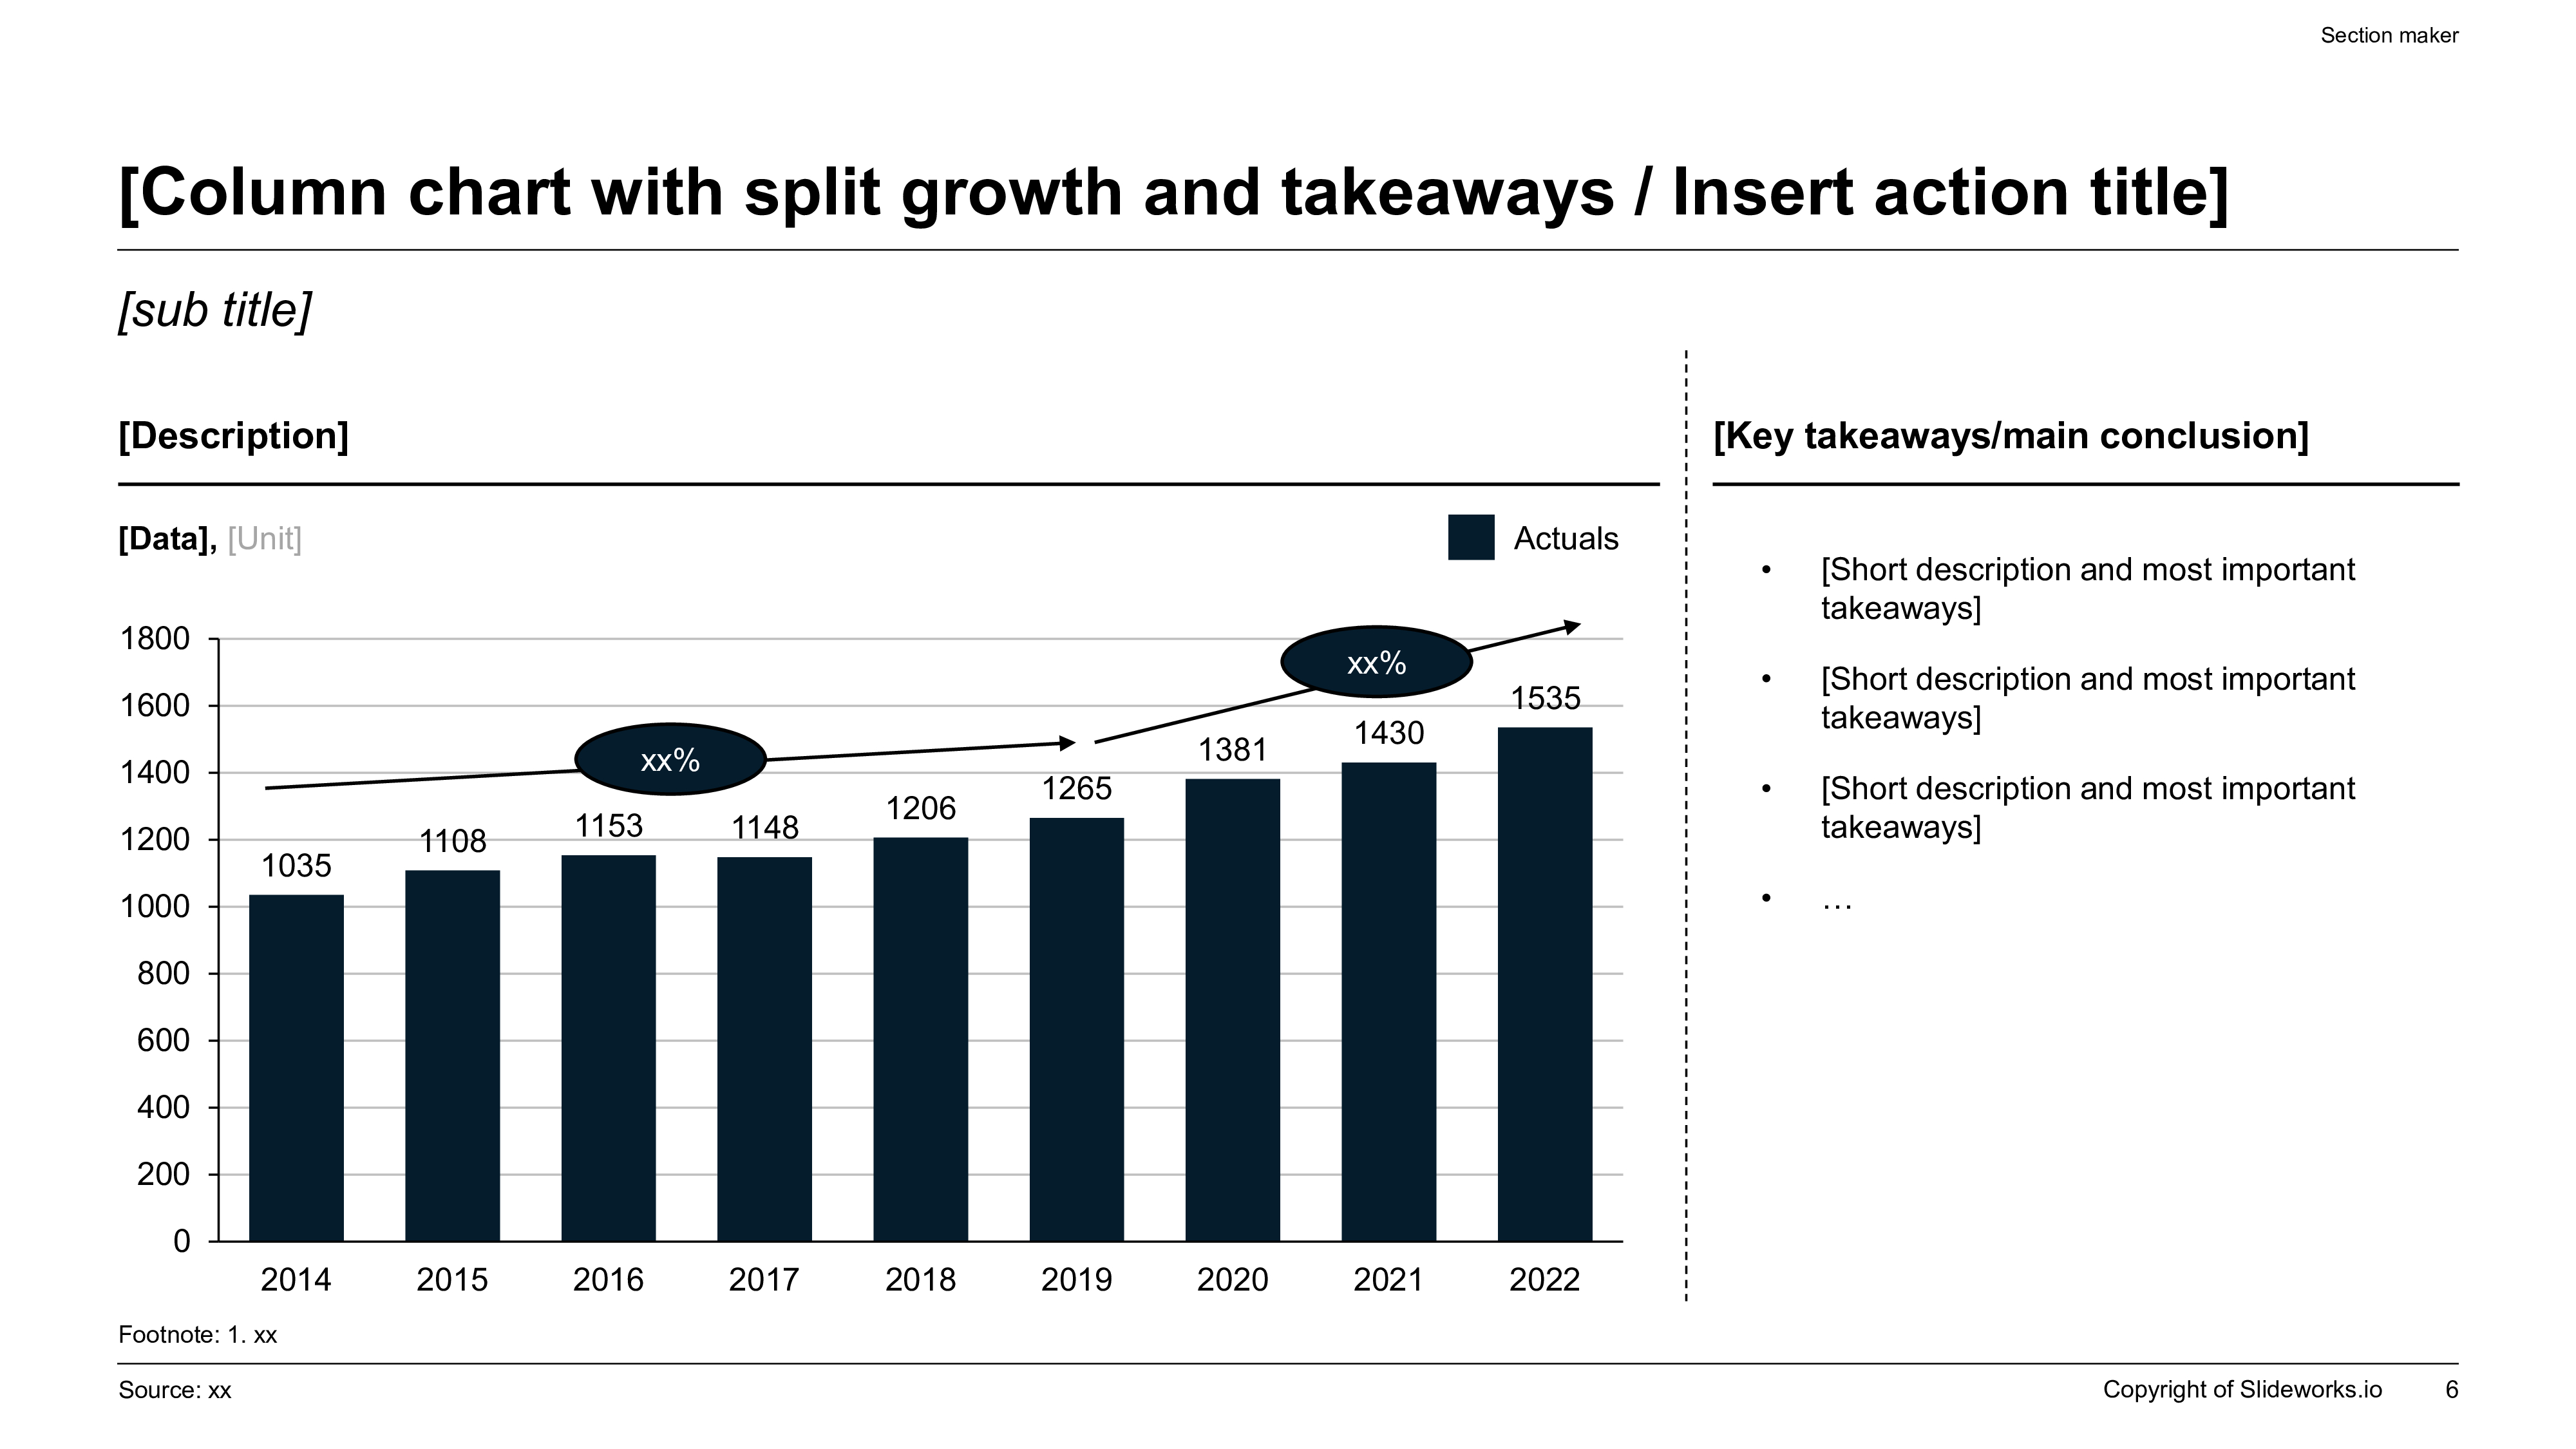
A premium 4K column chart layout showing annual metric growth from 2014 to 2022 with CAGR split trendlines, paired alongside a vertical key takeaways side column.
Template Design LayoutHealthcare & Clinical Report Templates

2Target Audience: Who is this template built for?

This premium presentation template is explicitly engineered for high-intent healthcare professionals who present clinical audits, market research, system performance data, or growth strategies to medical boards, investment committees, or public health commissions. The primary user profiles include hospital administrators, clinical operations directors, healthcare management consultants, pharmaceutical strategy leads, medical device product managers, and health-tech founders. These strategy leads operate in high-risk environments where presenting unverified data, non-compliant layouts, or disorganized slides can seriously compromise institutional trust. Our structured template removes design debt, enabling clinical research teams to present complex hospital workflows, epidemiological forecasts, and budget allocations with perfect structural integrity. By locking fonts, container shapes, and margins, healthcare organizations can eliminate margin drift and maintain absolute brand consistency, which communicates professional competence, regulatory adherence, and extreme attention to detail to global health committees. Furthermore, it is highly suited for raising capital from family offices, retail syndicates, or international sovereign wealth funds. Every single pixel and margin is calibrated to deliver the elite standard expected by global capital allocators.

3Practical Use Cases: When and where to deploy this deck

The strategic deployment of the Healthcare Industry Analysis Report framework is critical at multiple stages of the healthcare administrative lifecycle. The primary use case is presenting hospital operations reviews and clinical outcome audits to institutional boards and C-suite stakeholders. Additionally, the deck is deployed to secure funding for healthcare research, medical device development, or biotech innovations from venture capital and institutional investors. In public health forums, strategy consultants use these layouts to communicate epidemiological findings, healthcare policy changes, or system-wide digital transformations to state and federal health agencies. Furthermore, during pharmaceutical and medical device launch campaigns, it acts as a high-fidelity strategic blueprint to outline market access, clinical trial results, and pricing strategies to health insurance underwriters. Utilizing this standardized visual blueprint during high-stakes transactions ensures that all parties receive the strategic information they require, significantly accelerating due diligence timelines and project momentum, while serving as a formal corporate record that anchors all future partnership agreements. It acts as a continuous operational bridge from initial land due diligence and property options to physical build phases, tenant stabilization, and eventual refinancing transactions, ensuring absolute organizational clarity.

4Structural Blueprint: Recommended 12-Slide Narrative Outline

A complete, boardroom-ready healthcare industry analysis presentation must follow a logical, narrative-driven 12-slide progression to guide institutional partners from market overview to strategic action plans:

  • Slide 1: Executive Cover** - High-impact clinical visual or medical dashboard with a compelling, active project thesis statement.
  • Slide 2: Market Analysis** - Highlighting demographic trends, aging populations, and market growth drivers.
  • Slide 3: Clinical Outcomes** - Visualizing key patient safety indicators, recovery rates, and clinical efficacy metrics.
  • Slide 4: Operations & Efficiency** - Showcasing hospital capacity utilization, average length of stay, and operational bottlenecks.
  • Slide 5: Regulatory Compliance** - Outlining compliance status, HIPAA requirements, and quality assurance benchmarks.
  • Slide 6: Financial Performance** - Key financial parameters including average revenue per patient, operating margins, and cost structures.
  • Slide 7: Digital Health Strategy** - A structured roadmap mapping telemedicine adoption, electronic health record integration, and digital tools.
  • Slide 8: Research & Development** - Detailing clinical trial phases, product pipelines, and medical innovations.
  • Slide 9: Supply Chain & Logistics** - Highlighting pharmacy stock rates, vaccine distribution logistics, and equipment procurement plans.
  • Slide 10: Risk Assessment** - Critical clinical risk factors, staff retention strategies, and financial contingency plans.
  • Slide 11: Competitive Landscape** - Competitive positioning maps, market share shifts, and strategic partnership networks.
  • Slide 12: Next Steps & Execution** - Active call-to-action detailing implementation timelines, pilot programs, and project milestones.

Following this comprehensive twelve-slide outline ensures that C-suite stakeholders receive a complete analytical picture with absolute clarity.

5Aesthetics & Design Rationale of the BCG Emerald Palette

Our clinical design system utilizes custom color weights tailored specifically to the healthcare and medical research domain. The 'bcg-emerald' theme employs a dominant, professional emerald tone (10% accent) combined with high-contrast neutral backgrounds (60%) and structured container elements (30%). Contrast ratios strictly exceed 4.5:1, ensuring optimal readability on hospital projectors, tablet displays, and high-definition mobile screens. Widescreen 16:9 layout boundaries keep the narrative clean and structured, ensuring visual excellence across all projectors and digital screens. A crucial design rule is preserving at least 30% negative space on every layout card, which prevents cognitive friction and visual clutter. This ensures that the viewer's attention is focused precisely on critical data points, epidemiological trendlines, and hospital metrics rather than being distracted by unnecessary decorations. The aesthetic projects organizational discipline, scientific integrity, and supreme attention to detail, easily passing strict clinical and institutional due diligence standards. It avoids the childish neon colors found in casual design templates, offering instead a sober, boardroom-ready appearance that reassures institutional investors, bank underwriters, and sovereign wealth committees during complex capital allocation presentations.

6Integrating Rigorous Healthcare Evaluation Frameworks

To command credibility and pass partner due diligence scrutiny, your healthcare industry presentation must be built upon recognized, academically validated underwriting and evaluation frameworks. We recommend integrating several key clinical models: the Donabedian Model (Structure, Process, Outcome) to prove baseline operational quality, the Value-Based Care (VBC) framework showing patient value relative to treatment costs, and the Quintuple Aim framework demonstrating improvements in patient experience, population health, care team well-being, health equity, and cost reduction. Additionally, developers should present a detailed SWOT analysis for health policy shifts and a Kaplan-Meier Survival Analysis to substantiate clinical research timelines. Leveraging these established medical frameworks proves to hospital boards and medical committees that your healthcare strategic plan is backed by rigorous quantitative research rather than speculative projections, validating the integrity of your strategic planning process and accelerating capital commitment. Furthermore, you must detail your Sensitivity Analysis, demonstrating how changes in occupancy rates, interest rates, or raw construction costs impact your Levered IRR, thus showcasing deep risk management awareness.

7Narrative Architecture: Barbara Minto's Pyramid Principle in Healthcare

Healthcare investment, clinical adoption, and hospital budget decisions are driven by narrative momentum and logical clarity rather than raw data dumps. To maximize the impact of your strategy deck, structure your storyline around Barbara Minto’s legendary Pyramid Principle. Under this elite communication standard, every single slide headline must serve as an active, key conclusion rather than a passive label. For example, instead of titling a slide 'Operational Performance,' write an active headline like 'Our value-based care transition reduced average readmissions by 18.5% year-over-year.' Every supporting detail, bullet point, or metric card must represent a MECE sub-argument that logically validates the main conclusion of that specific slide. Ideas must flow in chronological, structural, or comparative order to ensure a seamless widescreen narrative. This narrative discipline allows busy hospital administrators and board members to grasp your entire strategy in under 2 minutes, significantly accelerating operational trust and helping to align diverse clinical teams on critical priorities.

8Quantitative Hospital Performance Comparison Matrix

Below is a rigorous, quantitative operational breakdown outlining standard performance metrics and benchmarks across primary healthcare institution types. This structured table enables administrators to demonstrate target metrics relative to national baseline indicators:

Hospital CategoryAverage Readmission RateTelemedicine Adoption RatePatient Satisfaction (HCAHPS)Operating Margin Target
Academic Medical Centers11.2% - 13.5%75% - 85%4 out of 5 stars3.5% - 5.0%
Community Hospitals14.0% - 16.2%60% - 70%3 out of 5 stars1.8% - 2.5%
Specialty Clinics8.5% - 10.8%85% - 95%5 out of 5 stars6.5% - 8.0%
Pediatric Health Systems9.0% - 11.5%70% - 80%4 out of 5 stars2.5% - 4.0%

Enforcing these baseline parameters within your underwriting models ensures that your operational plans remain realistic, fundable, and aligned with current regulatory preferences. By organizing this data in a structured, high-contrast matrix, you present complex quantitative relationships with supreme clarity, allowing medical directors and joint-venture partners to calibrate risk profiles and make investment commitments with absolute security.

9XLSlides AI Capabilities: Automating Clinical Presentations

Building a high-quality clinical presentation manually in PowerPoint usually drains 8 to 12 hours of frustrating layout formatting. Our advanced AI engine handles this design debt in under 60 seconds. The model performs context-aware slide matching, analyzing your text brief to map elements automatically to premium layouts like hospital outcome charts, compliance timelines, and patient journey schevrons. Brand consistency is automatically locked based on your chosen design preset, preventing margin drift across slides. Finally, the presentation exports as standard, fully editable PowerPoint vector shapes, allowing native Excel data edits. This eliminates hours of manual resizing, enabling your clinical teams to focus on patient outcomes and research strategy rather than alignment rules. You get boardroom-ready widescreen layouts that are fully compatible with Microsoft Office and Google Slides instantly, giving you a massive operational multiplier during high-stakes investment rounds, research presentations, and partner alignments, while ensuring your brand assets are strictly locked to professional guidelines. By modernizing your corporate workflow, you ensure that every deal partner receives a polished, brand-compliant document, eliminating standard administrative bottlenecking.

10The AI Visual Studio Canvas: Interactive Healthcare Layout Prototype

This premium template integrates directly with the AI Visual Studio Canvas, our drag-and-drop reference workspace. To draft custom visual layouts, developers can click and drag anywhere on the 16:9 canvas area to draw custom text container placeholders, making layout drafting exceptionally visual. You can assign structural tags (such as metrics grid, column table, process timeline, or visual quote) to each drafted card to define the AI's rendering constraints. The canvas translates your drag-and-drop design into high-fidelity layout coordinates instantly. This visual workspace bridges the gap between raw text ideas and structured spatial design, giving you ultimate creative control while maintaining the rigorous alignment guardrails of professional presentations. To try it now, click the Open Interactive Canvas button in the sidebar or mobile stream to map out your slide layouts in real time, making custom presentation drafting exceptionally responsive, clear, highly visual, and perfectly aligned to your healthcare goals. This spatial drafting is perfect for showcasing specific physical spaces like hospital floor plans, clinical patient paths, and laboratory workflows, ensuring that your ideas are translated into widescreen presentation layouts with pixel-perfect accuracy.

11Common Clinical Presentation Mistakes to Avoid

To ensure your healthcare industry analysis deck passes strict administrative and regulatory due diligence, avoid these 5 critical mistakes:

  • Medical Jargon Overload**: Slides are not textbooks; if a slide contains dense clinical papers, simplify it into high-impact takeaway cards and key charts for better visual clarity.
  • Unformatted Data Tables**: Describing laboratory outcomes with messy, unaligned lists; utilize strict, high-contrast comparison matrices showing clear trends.
  • Zero Visual Hierarchy**: Cramming too many metrics on a single slide; keep at least 30% white space to let the board focus on critical medical findings.
  • Low-Contrast Elements**: Using light green or gray text on white backgrounds, which washes out on older clinic projectors; high-contrast coloring is mandatory.
  • Ignoring Compliance Issues**: Failing to address patient privacy (HIPAA) or drug approvals explicitly; declare regulatory milestones clearly to build institutional trust.

Avoiding these common design and pitching errors guarantees that your presentation retains board attention and builds trust across all healthcare stakeholders.

12Performance Comparison: Manual Clinical Drafting vs. XLSlides AI

Below is a quantitative comparison of manual PowerPoint drafting versus automated medical slide generation:

  • Time Invested**: 10 to 14 hours of manual drafting versus under 60 seconds total with XLSlides AI.
  • Grid Alignment Precision**: Eyeballed manual layouts (prone to errors) versus automated, perfect 12-column pixel grids.
  • Brand Consistency**: Font and margin drift over time versus 100% lock to corporate style guides.
  • PowerPoint Compatibility**: Standard PPTX files that allow native Excel data and formula edits.
  • Framework Integration**: Hand-drawn medical charts versus built-in, ready-to-use template components.
  • Average Design Cost**: High designer hourly fees versus affordable, inclusive Pro plans.

Transitioning to automation represents a significant operational multiplier, ensuring clinical excellence. It enables medical directors to concentrate their efforts on care delivery, pharmaceutical strategy, and clinical research rather than losing hours to frustrating formatting, offering a modern, highly efficient alternative for healthcare leaders. It provides your entire organization with a scalable design system that works across local, remote, and hybrid strategy teams, guaranteeing standard boardroom quality at a fraction of the traditional cost.