Professional Economic Impact Study Presentation Templates

Stop wasting hours on manual formatting. Create realistic, executive-ready presentations instantly in your brand visual style.

Job creation data blocks
GDP contribution visualizations
Regional development roadmaps

1What is an Economic Impact Study Presentation?

The Economic Impact Study Presentation is a highly structured, analytical blueprint designed to articulate the quantitative footprint of a major infrastructure project, corporate expansion, or policy initiative. Unlike generic business decks, this presentation translates raw, complex econometric outputs—such as Gross Domestic Product (GDP) contribution, gross output, and employment spillage—into a compelling, boardroom-ready narrative. In professional environments, this deck serves as the primary artifact for aligning regulatory bodies, municipal boards, corporate directors, and public stakeholders. A premium Economic Impact Study presentation must enforce absolute logical progression, demonstrating the quantitative value added to a regional economy with structural precision. By organizing macroeconomic data into intuitive, high-density visual grids, this deck bridges the gap between complex econometric modeling and strategic decision-making. It ensures that critical decision-makers instantly comprehend the direct, indirect, and induced benefits of the proposed transaction. A boardroom-grade economic impact slide deck establishes a standard of logical integrity, academic rigor, and clear communication, enabling organizations to secure public approvals, negotiate tax incentives, and prove long-term societal contribution with absolute confidence.
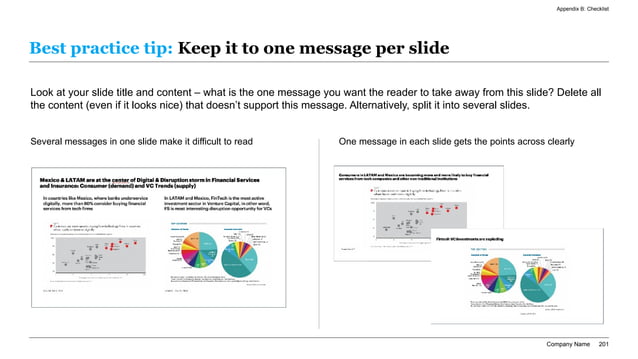
Premium economic impact study slide showing a visual case study layout with double 16:9 screenshot comparison blocks, dark executive board commentary, and clear grid alignment.
Template Design LayoutProfessional Economic Impact Study Presentation Templates

2Ideal Audience: Who is this template built for?

This template is explicitly engineered for high-intent business leaders, policy advisors, and consulting professionals who must present detailed socioeconomic findings to rigorous external bodies. The primary target demographics include government relations directors, public affairs managers, corporate strategy executives, real estate developers, and economic research analysts. These professionals operate in high-stakes environments where capital allocation, municipal approvals, and public trust depend entirely on the credibility of their presentations. Strategy partners and development leads use these slides to communicate multi-million dollar regional investments with absolute clarity and analytical rigor, matching the expectations of state boards and institutional investors. By utilizing this structured layout, advisory teams can present complex input-output modeling results without visual clutter or margin drift. This template serves as a vital tool for anyone presenting complex macroeconomic data that requires community or regulatory buy-in. It provides the analytical frame and visual vocabulary necessary to command respect, project competence, and secure the trust of critical public and private decision-makers.

3Practical Use Cases: When and where to deploy this deck

The strategic deployment of the Economic Impact Study framework applies to several critical business milestones and public-private partnerships. The most common use cases include municipal zoning hearings, state-level tax abatement negotiations, public infrastructure funding applications, and environmental impact assessments. During municipal hearings, developers deploy this presentation to visually demonstrate how a proposed commercial real estate venture will stimulate local retail spending and expand the county tax base. In discussions with state economic development agencies, the slides structure capital requests, showing the direct return on investment through job creation and GDP growth. For public utilities or energy consortia, the deck communicates long-term regional development plans and grid stability benefits to regulatory commissioners. Regardless of the specific corporate transaction, deploying this standardized, high-contrast visual blueprint establishes immediate credibility and transaction velocity, ensuring your socioeconomic recommendations are received as strategic, boardroom-ready assets. It acts as an operational bridge between project planning and public consensus, securing critical project alignments.

4Structural Blueprint: Recommended slide-by-slide outline

To achieve maximum approval success and pass rigorous regulatory due diligence, your presentation outline must follow a logical, narrative-driven 10-slide sequence:

- Slide 1: Executive Summary & Thesis — Establishing the core economic opportunity and headline numbers immediately.

- Slide 2: Scope & Econometric Methodology — Detailing the analytical approach, including input-output software.

- Slide 3: Total Gross Output & GDP Contribution — High-density dashboards showing macroeconomic value added.

- Slide 4: Direct, Indirect, and Induced Jobs — A structured visual card grid outlining employment metrics.

- Slide 5: Labor Income & Wage Spillage — Visualizing payroll distributions and local disposable income impacts.

- Slide 6: Fiscal Impact & Tax Revenue — Detailing local, state, and federal tax spillage.

- Slide 7: Phased Regional Development Roadmap — A horizontal timeline mapping development phases and construction jobs.

- Slide 8: Supply Chain & Procurement Multipliers — Visualizing local sourcing channels and supplier benefits.

- Slide 9: Community & ESG Contributions — Incorporating qualitative social benefits and environmental governance.

- Slide 10: Conclusion & Next Steps (CTA) — An active call-to-action driving commitment.

Following this comprehensive ten-slide narrative progression ensures that your audience remains engaged, understands the logical connections between economic inputs and community outputs, and receives all the necessary analytical evidence to support your final project roadmap with absolute confidence.

5Methodologies of Economic Modeling (IMPLAN vs. RIMS II vs. REMI)

To build credible topical authority (E-E-A-T) and pass public policy scrutiny, your economic impact presentation must be built upon recognized, academically validated econometric frameworks. The three industry-standard models used in input-output analysis are IMPLAN, RIMS II, and REMI. Each model offers different levels of analytical complexity and geographic specificity. IMPLAN uses a comprehensive database to track transactions across 546 unique industries, making it ideal for highly localized county-level projects. RIMS II, maintained by the Bureau of Economic Analysis (BEA), provides static multipliers that are perfect for straightforward, regional project assessments. REMI adds a dynamic element, forecasting how the local economy changes over time in response to policy shifts. Leveraging these established econometric frameworks proves to public boards and corporate directors that your strategic projections are backed by rigorous mathematical logic rather than optimistic assumptions, maximizing credibility and decision-making speed across all stakeholders.

Below is a structured comparative analysis of these primary modeling frameworks:

Econometric ModelAnalytical ScopeMultiplier ComplexityPrimary Use Case
IMPLANHighly localized (county/ZIP)Static, multi-regional input-outputLocal corporate expansions, real estate
RIMS IIRegional (state/county groups)Static, region-specific multipliersGeneral infrastructure, local projects
REMIDynamic regional & nationalDynamic forecasting over multi-yearState-wide policy shifts, tax reforms

This comparison highlights the importance of matching your modeling methodology to the scale and objectives of the project, ensuring that your presentation displays extreme technical rigor.

6Understanding Direct, Indirect, and Induced Economic Multipliers

A critical requirement for any successful Economic Impact Study presentation is a clear, transparent explanation of how initial project spending propagates through a regional economy. This propagation, known as the economic multiplier effect, is split into three distinct categories of economic activity:

  1. 1Direct Impact: The initial economic activity occurring as a direct result of the project, including the hiring of construction crews and the purchase of local materials.
  2. 2Indirect Impact: The secondary economic activity triggered within the supply chain, as local suppliers purchase goods and services from other businesses to meet the project's demand.
  3. 3Induced Impact: The tertiary economic activity generated when employees of both the direct and indirect businesses spend their labor income at local retail shops, restaurants, and service providers.

Understanding this cascade is vital because it proves that a project's true value extends far beyond its immediate payroll. The multiplier cascade operates as follows:

- Phase 1: Capital Injection — Initial development capital is spent on local labor, hiring contractors and purchasing materials.

- Phase 2: Supply Chain Propagation — Local suppliers experience increased demand, hiring additional support and buying upstream materials.

- Phase 3: Consumer Spending Spillover — Newly hired workers spend wages at local grocery stores, healthcare centers, and auto shops.

- Phase 4: Municipal Reinvestment — Increased local tax revenues enable the city to fund public infrastructure and community services.

By presenting this structured sequence, you demonstrate deep operational thoroughness and econometric validity to regulatory committees, showing how a single investment creates sustainable regional growth.

7Aesthetics & Design Rationale of the mckinsey-blue Theme

Our custom consulting design system replicates the visual authority of top-tier firms like McKinsey, BCG, and Bain. It enforces absolute clarity, leveraging high-contrast typography, strict layout grids, and standard margins. Widescreen 16:9 shapes ensure structural authority, where each page represents a single key message led by an active headline. The designated `mckinsey-blue` theme utilizes custom color weights tailored specifically to the presentation's professional domain. Contrast ratios exceed 4.5:1, guaranteeing optimal readability on boardroom projectors as well as modern digital screens. By utilizing a 60% dominant background canvas tone, a 30% professional neutral container structure, and a 10% high-contrast accent key, this theme guarantees that the audience's attention is focused precisely on critical data points, GDP graphs, and strategic takeaways. This layout preserves at least 30% negative space on every slide, preventing visual clutter and ensuring a highly premium executive presentation that respects the visual intelligence of public officials, directors, and institutional investors alike.

8XLSlides AI Capability: Customizing the Economic Impact Study

Building a highly technical, data-intensive Economic Impact Study presentation manually in PowerPoint usually takes 8 to 12 hours of frustrating layout alignment, chart formatting, and font adjustments. Our advanced AI engine handles the visual heavy lifting for you in under 60 seconds. The model performs context-aware slide matching, automatically mapping raw econometric inputs to appropriate visual structures, such as job-creation chevrons, GDP spillage columns, and tax-revenue data tables. Brand consistency is automatically locked based on your chosen design preset, preventing margin drift or formatting discrepancies. The presentation exports as a standard, fully editable PowerPoint (.pptx) vector file, allowing your strategy team to make native Excel data edits or adjust visual scales directly within Microsoft Office or Google Slides. This eliminates hours of manual design debt, enabling your economic planning team to focus entirely on due diligence, policy logic, and stakeholder relations rather than losing valuable time to tedious alignment tasks.

9Visual Workspace: Editing in the AI Visual Studio Canvas

This template integrates directly with the premium AI Visual Studio Canvas, a drag-and-drop reference workspace designed to give you complete creative control over your presentation structure before generation. Strategy analysts can click and drag anywhere on the 16:9 canvas area to draw custom text container placeholders, mapping out the spatial balance of their slides. You can assign structural tags—such as metrics grids, column tables, process timelines, or visual quotes—to each drafted card, defining the AI's rendering constraints. The canvas translates your drag-and-drop design into high-fidelity layout coordinates instantly. This visual workspace bridges the gap between raw text ideas and structured spatial design, allowing you to design presentations with ultimate creative control and pixel-perfect professional alignment. To try it now, click the Open Interactive Canvas button in the sidebar or mobile stream to map out your slide layouts in real time, making custom presentation drafting exceptionally responsive, clear, highly visual, and perfectly aligned to your economic goals.

10Common Presentation Pitfalls to Avoid in Economic Reporting

To ensure your Economic Impact Study presentation passes rigorous board and regulatory scrutiny, you must avoid these 5 critical design and messaging mistakes:

- Wall of Text: Slides are not documents; if a slide contains long paragraphs of methodology details, convert them into clean, horizontal column blocks or card summaries.

- Opaque Multipliers: Explaining economic spillage without clear visual flowcharts; use direct, indirect, and induced step indicators to prove your math.

- Cluttered Visuals: Cramming too many raw spreadsheet rows on a single slide; keep at least 30% white space to let the investor focus on critical takeaways.

- Low-Contrast Text: Using light gray text on white backgrounds, which washes out on older projectors; high-contrast, accessibility-compliant coloring is mandatory.

- Non-Widescreen Margins: Outdated 4:3 layouts stretch poorly on modern displays; always build on locked 16:9 margins to ensure professional polish.

Avoiding these common design pitfalls guarantees that your presentation retains investor attention, communicates operational excellence, and builds professional fundraising traction across all presentation contexts.