Clinical Trial Results Evaluation Presentation Templates

Stop wasting hours on manual formatting. Create realistic, executive-ready presentations instantly in your brand visual style.

Efficacy & safety metrics
Investment committee outlines
Clinical due diligence grids

1Evaluating Clinical Trial Efficacy for Venture Capital & PE Committee Review

Evaluating clinical trial results represents the most critical due diligence phase for biotech venture capital firms, private equity groups, and corporate strategy boards. Unlike standard corporate presentations, a clinical trial results deck must present complex scientific efficacy metrics and safety endpoints with absolute structural rigor and boardroom-ready design precision. Investment committees and underwriting partners require structured, clean layouts that clearly distinguish between primary and secondary clinical outcomes. Presenting messy spreadsheets, text-heavy slides, or unaligned visual grids during high-stakes valuation meetings damages deal credibility, compromises trust, and delays capital deployment. This premium template provides corporate development leads and biotech finance directors with standard 16:9 widescreen layouts designed to showcase patient demographics, hazard ratios, and biomarker correlations. By using our brand-locked visual presets, deal teams can ensure that critical scientific findings are presented in an authoritative, professional format. This allows underwriting partners to evaluate therapeutic value, assess market opportunities, and allocate resources with absolute confidence.
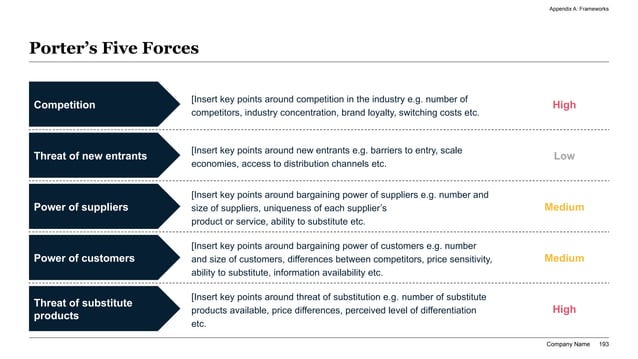
A standardized industrial diagnostic system showing a Porter's Five Forces assessment grid in widescreen 16:9 format with dark blue arrow badges.
Template Design LayoutClinical Trial Results Evaluation Presentation Templates

2Strategic Due Diligence: Structuring the Investment Committee Brief

Before presenting a clinical trial investment thesis to a VC/PE investment committee, deal teams must organize complex R&D milestones into a structured communication flow. Following Barbara Minto's Pyramid Principle, every slide headline must serve as an active conclusion (e.g., 'Phase 2b efficacy endpoints show a 35% improvement in patient response rates over standard of care'). This approach prevents data dumping and directs committee focus straight to strategic deal drivers. Supporting details—including patient baseline characteristics, enrollment demographics, and drop-out rates—must be organized in MECE (Mutually Exclusive, Collectively Exhaustive) layout grids. By structuring clinical due diligence findings around standardized financial and operational themes, strategy managers can address risk mitigation and capital requirements early in the review process. This premium slide deck ensures that compliance teams, CFOs, and scientific advisory boards remain aligned on R&D timelines, minimizing transaction drag, accelerating approvals, and accelerating corporate deal velocity. It establishes a baseline of absolute clarity that is critical for institutional investors and regulatory compliance reviews. Furthermore, it allows analysts to map preclinical outcomes to future clinical trials, highlighting potential hurdles in the regulatory process and identifying critical path activities. This level of structural detail projects competence and meticulous planning to potential capital allocators.

3Aesthetic Design System: The McKinsey-Blue Theme for Healthcare Valuation Decks

To command professional authority during high-stakes biopharma evaluations, this presentation template is built around our custom McKinsey-blue design preset. Scientific decks often suffer from over-designed, low-contrast visual themes that distract reviewers and reduce legibility on older boardroom projectors. Our design system enforces a dominant, deep McKinsey-blue corporate tone (60% weight) combined with clean white containers (30% weight) and vibrant electric blue or soft gray highlights (10% weight) to organize complex data matrices and timelines. Contrast ratios strictly exceed 4.5:1, ensuring crisp readability across tablets, laptops, and executive screens. The layout is locked to a 16:9 widescreen format to ensure structural authority. Every slide layout preserves at least 30% negative space, preventing cognitive overload and visual clutter. Aligning all content modules to a 12-column grid eliminates margin errors, projecting a standard of technical control, scientific rigor, and absolute corporate excellence. This structured design system also enforces strict visual hierarchy, guiding the reader's eye from key strategic takeaways down to secondary data points. By maintaining design consistency across all slide formats, biopharma developers can avoid formatting drift and present a unified, highly polished corporate image to international investment syndicates.

4Primary and Secondary Efficacy Endpoints: Visualizing Therapeutic Success

Quantifying a therapeutic candidate's efficacy is the cornerstone of any biopharma valuation model. Strategy teams and investment analysts must present primary endpoints, such as overall survival (OS) or progression-free survival (PFS), alongside secondary metrics like objective response rates (ORR). Our template includes high-density data tables designed to display statistical significance, p-values, and confidence intervals with absolute clarity. Below is a structured comparative analysis illustrating how the candidate drug performs against placebo and standard of care across key efficacy metrics:

Efficacy EndpointCandidate Molecule (XL-902)Standard of Care (Active Control)Placebo Control GroupStatistical Significance (p-value)
Primary OS (Months)24.5 Months Median18.2 Months Median12.1 Months Medianp < 0.001 (Highly Significant)
PFS (Months)14.8 Months Median9.5 Months Median4.2 Months Medianp < 0.005 (Significant)
ORR (%)62.4% Response Rate41.2% Response Rate15.6% Response Ratep < 0.001 (Highly Significant)
Biomarker Reduction78% Mean Decrease45% Mean Decrease5% Mean Decreasep < 0.010 (Significant)

By presenting statistical endpoints in a structured, high-contrast grid, deal leads prove to institutional underwriters that the therapeutic data is robust, reproducible, and ready for regulatory scrutiny.

5Safety Profiles and Adverse Events: Calibrating Clinical Risk Metrics

For healthcare PE/VC investors, a therapeutic candidate's safety profile is just as critical as its efficacy. Decks must detail treatment-emergent adverse events (TEAEs) and serious adverse events (SAEs) transparently to prevent post-transaction regulatory liabilities. Presenting unstructured safety lists is unacceptable; team leads must use clear grids to categorize adverse events by severity grade (Grades 1-4). This approach enables the board to assess risk-benefit ratios and project clinical success rates before committing capital. The playbook focuses on these key safety disclosure pillars:

  • Common Adverse Events**: Mapping mild-to-moderate events (Grade 1-2) like fatigue, nausea, or headaches.
  • Serious Adverse Events (SAEs)**: Disclosing severe events (Grade 3-4) and tracking occurrences across cohorts.
  • Dose-Limiting Toxicities (DLTs)**: Evaluating maximum tolerated dose thresholds during Phase 1 escalations.
  • Discontinuation Rates**: Detailing patient dropout frequencies due to drug-related toxicity profiles.

Highlighting these safety metrics in a standardized layout demonstrates operational discipline and risk compliance, building trust with scientific advisors and underwriting syndicates.

6Patient Demographics and Baseline Characteristics: Ensuring Trial Validity

A clinical trial's results are only as valid as the underlying patient demographics and baseline characteristics. To satisfy regulatory standards set by agencies like the FDA or EMA, clinical trial presentation slides must prove that patient cohorts were balanced and randomized without selection bias. This section allows deal teams to detail critical demographic variables, including age distribution, gender split, geographic site diversity, and baseline disease severity. Presenting these demographic details in a structured grid prevents questions regarding trial integrity during strategic partnership negotiations. Below is a structured quantitative representation of the patient enrollment demographics across different trial cohorts:

Demographic VariableCohort A (Low Dose)Cohort B (High Dose)Cohort C (Placebo Control)Total Patient Population
Total Enrolled (N)150 Patients150 Patients150 Patients450 Patients
Median Age (Years)54.5 Years55.2 Years54.8 Years54.8 Years Overall
Gender (Male/Female)78 / 72 Patients80 / 70 Patients75 / 75 Patients233 / 217 Patients
Baseline Disease Score6.8 (Moderate-Severe)6.9 (Moderate-Severe)6.7 (Moderate-Severe)6.8 (Moderate-Severe)

Organizing trial demographics in this clean, tabular format establishes absolute scientific credibility, ensuring that all reviewers can quickly verify patient distribution metrics.

7Regulatory Pathway and FDA Approval Milestones: Framing the Timeline

Biotech valuations are heavily dependent on regulatory approval timelines, which represent major inflection points for investment returns. Strategy leaders must outline the planned regulatory pathway, including pre-IND meetings, NDA/BLA submissions, and Advisory Committee hearings. This section provides dedicated, high-contrast milestone grids to help finance directors visualize development phases and regulatory deadlines. By mapping out these milestones in visual chevrons and timelines, corporate development leads can align R&D operations with capital expenditure plans. Key regulatory timeline components include:

  • IND Submission**: Completing preclinical safety packages and filing the Investigational New Drug application.
  • Phase 1-3 Milestones**: Tracking trial start dates, interim data readouts, and final study reports.
  • BLA/NDA Filing**: Preparing high-density documentation for submission to regulatory bodies.
  • Pre-Market Reviews**: Coordinating Advisory Committee preparation and addressing information requests.

Mapping these milestones helps investors calibrate risk-adjusted net present value (rNPV) calculations, manage risk tolerances, and project future liquidity events. Additionally, outlining post-marketing surveillance requirements and phase four study commitments guarantees that potential partners fully understand the long-term operational and financial expectations of the drug development lifecycle. This comprehensive planning ensures all downstream execution risks are accounted for.

8Interactive Slide Prototyping on the AI Visual Studio Canvas

To streamline slide preparation and eliminate formatting debt, this premium template integrates directly with the AI Visual Studio Canvas, our interactive drag-and-drop workspace. Clinical development leads and biotech analysts can click and drag anywhere on the 16:9 canvas area to draw custom text container placeholders, making slide layout drafting exceptionally visual. You can assign structural tags (such as patient demographics tables, adverse events grids, regulatory timelines, or scientific quotes) to each drafted card to define the AI's rendering constraints. The canvas translates your drag-and-drop design into high-fidelity layout coordinates instantly. This visual workspace bridges the gap between raw textual briefs and structured spatial design, giving you ultimate creative control while maintaining the rigorous alignment guardrails of our design system. To try it now, click the Open Interactive Canvas button in the sidebar or mobile stream to map out your slide layouts in real time, making custom presentation drafting exceptionally responsive, clear, and perfectly aligned to your biopharma valuation goals.

9Common Clinical Trial Presentation Pitfalls to Avoid

To ensure your clinical trial presentation passes strict board oversight and corporate due diligence, you must avoid these 5 critical design and narrative mistakes:

  • Scientific Jargon Overload** - Slides are not medical journal papers; if a slide contains dense technical biology text, simplify it into high-impact value cards and key charts for better visual clarity.
  • Unformatted Data Tables** - Describing complex patient demographics or efficacy endpoints with messy, unaligned lists; utilize strict, high-contrast comparison matrices showing clear trends.
  • Zero Visual Hierarchy** - Cramming too many clinical metrics on a single slide; keep at least 30% white space to let the investment committee focus on critical efficacy findings.
  • Low-Contrast Elements** - Using light gray text on light backgrounds, which washes out on older projectors; high-contrast McKinsey-blue coloring is mandatory.
  • Ignoring Safety Signals** - Failing to address adverse events or toxicities openly; declare safety risks and mitigation steps clearly to build institutional trust.

Avoiding these common errors guarantees that your presentation retains board attention, communicates operational excellence, and builds professional fundraising traction.

10Operational ROI: Traditional Slide Design vs. XLSlides AI Automation

Transitioning from manual PowerPoint drafting to automated biopharma slide generation represents a significant operational multiplier for biotech startups, healthcare PE/VC firms, and advisory partners. Below is a summary of the quantitative returns on investment unlocked by the XLSlides AI compilation pipeline:

  • Time Invested**: 10 to 14 hours of manual layout tweaking is reduced to under 60 seconds with advanced AI compilation.
  • Grid Precision**: Eyeballed manual layouts prone to alignment mistakes are replaced by perfect, automated 12-column pixel grids.
  • Brand Consistency**: Inconsistent fonts and margin drift are eliminated in favor of a 100% lock to corporate style guides.
  • Framework Integration**: Hand-drawn milestone timelines are replaced by native, ready-to-use template components.
  • Design Overhead**: High designer hourly fees are eliminated, significantly lowering the average cost per slide.

This high-density automation system enables your scientific team to focus on R&D, clinical operations, and fundraising strategy rather than losing valuable hours to manual formatting frustrations, maintaining boardroom excellence at a fraction of the cost.