AgTech Soil Health and Farm Analytics Presentation Template

Stop wasting hours on manual formatting. Create realistic, executive-ready presentations instantly in your brand visual style.

Turn soil tests, nutrient maps, yield forecasts, and farm operations data into an investor-ready AgTech story.
Explain how analytics, sensors, sampling, and recommendations improve productivity, sustainability, and input efficiency.
Build slides for growers, agronomists, food companies, AgTech founders, investors, and sustainability teams.

1What Is an AgTech Soil Health Analytics Deck?

An AgTech soil health analytics deck explains how soil data becomes better farming decisions. It should connect technical measurements such as pH, organic matter, nitrogen, phosphorus, potassium, micronutrients, compaction, moisture, biological activity, and carbon indicators to practical recommendations for crop performance, input efficiency, resilience, and sustainability. The deck usually includes the market or farm problem, data collection method, analytics workflow, recommendation engine, field-level insights, grower value proposition, economics, adoption plan, and roadmap. The strongest version respects the complexity of farming instead of treating data as a magic answer. It shows how sampling, agronomy judgment, weather, crop rotation, equipment, and grower behavior influence outcomes. This gives growers, agronomists, food buyers, sustainability leaders, investors, and product teams enough detail to evaluate scientific credibility, farm-level usefulness, data quality, economics, adoption risk, and the next decision gate. It also clarifies how field evidence, model confidence, seasonal constraints, and grower trust shape whether insights become actual management changes.
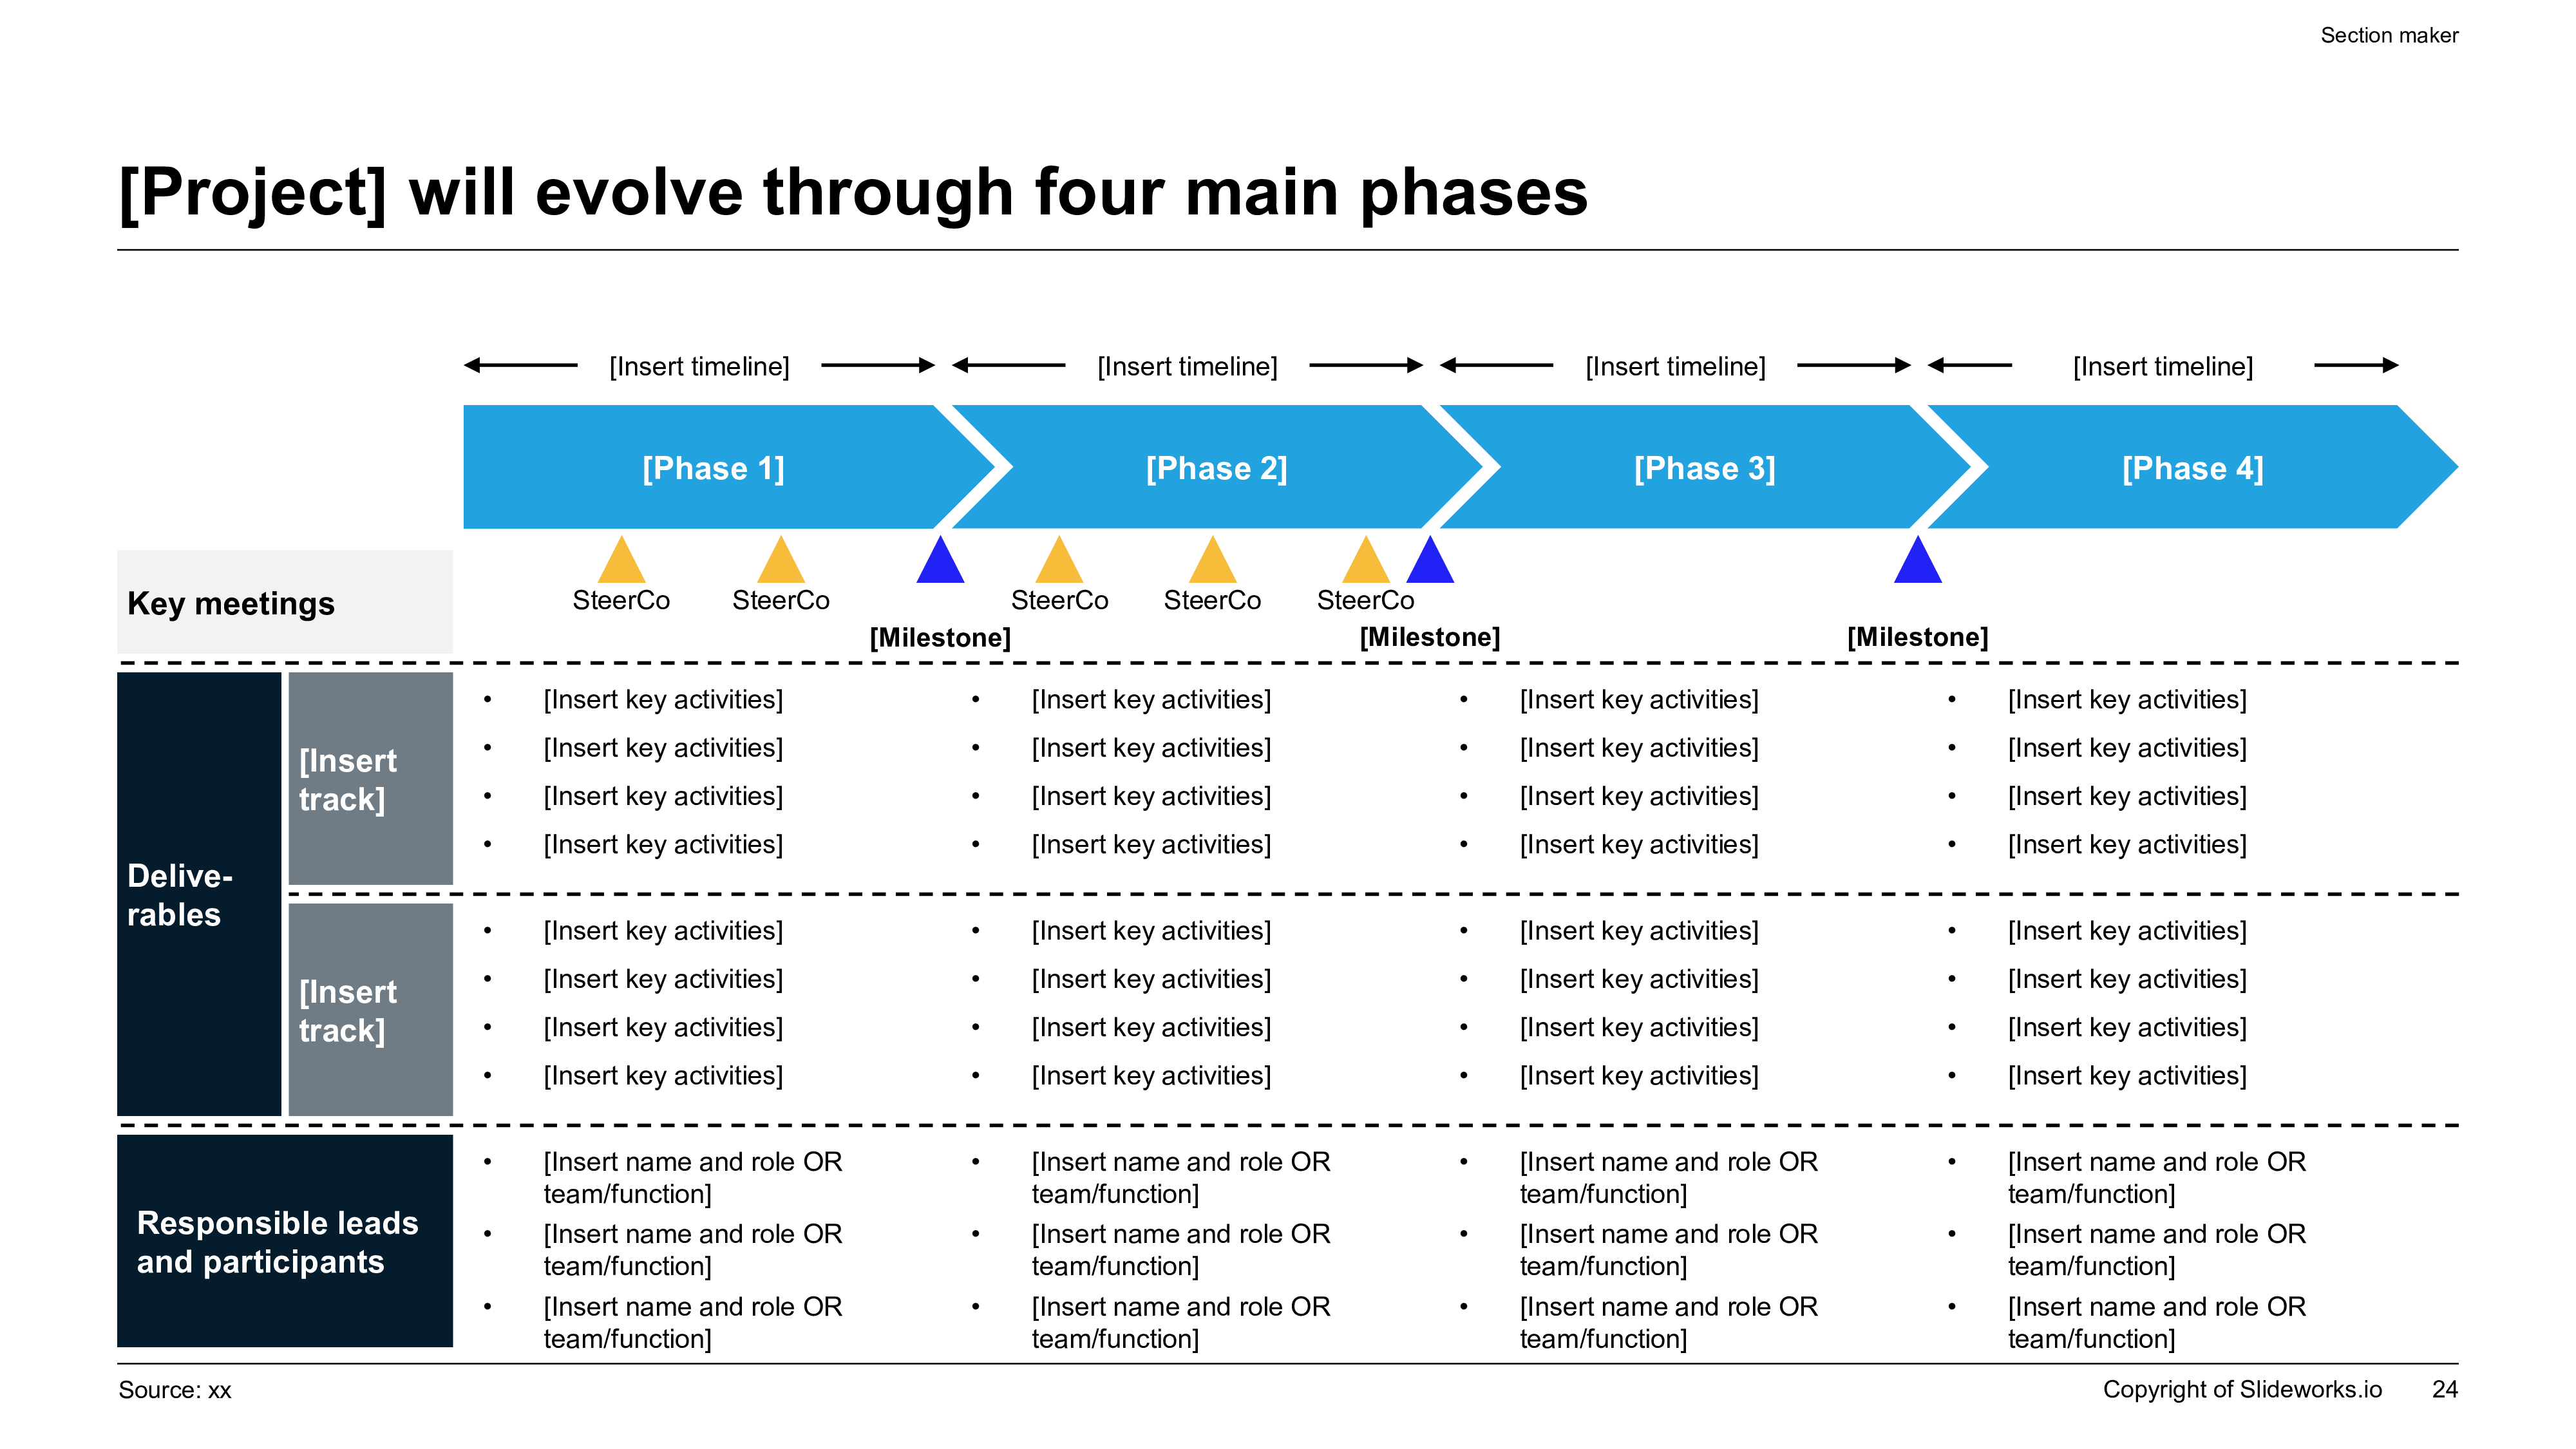
AgTech soil health analytics roadmap slide with four-phase milestone timeline, ownership rows, deliverables, and steering committee checkpoints.
Template Design LayoutAgTech Soil Health and Farm Analytics Presentation Template

2When to Use This Soil Health Analytics Template

Use this template when you need to present a soil analytics initiative to stakeholders who care about both agronomic evidence and business outcomes. It works for AgTech pitch decks, grower advisory presentations, regenerative agriculture program reviews, sustainability reporting, food supply chain traceability plans, product roadmap discussions, investor diligence, and strategic partnership proposals. A founder can use it to explain a platform, an agronomist can use it to present field recommendations, and a sustainability team can use it to connect soil improvement to measurable impact. The template is especially useful when audiences include both technical and non-technical decision makers. It creates a shared structure for soil indicators, recommendation logic, adoption model, and ROI. This gives growers, agronomists, food buyers, sustainability leaders, investors, and product teams enough detail to evaluate scientific credibility, farm-level usefulness, data quality, economics, adoption risk, and the next decision gate. It also clarifies how field evidence, model confidence, seasonal constraints, and grower trust shape whether insights become actual management changes.

3Recommended Soil Analytics Deck Structure

A strong soil analytics deck should begin with the problem: yield variability, input inefficiency, soil degradation, water stress, carbon targets, fragmented data, or limited grower decision support. The next section should describe the data foundation, including sampling design, lab tests, sensor feeds, satellite imagery, field boundaries, weather, management history, and crop plans. After that, explain how analytics convert raw data into zones, risk flags, recommendations, and expected outcomes. The deck should include examples of field-level insights, nutrient or carbon interpretation, implementation steps, economics, and adoption support. Close with the roadmap, product or program governance, partnerships, KPIs, and the ask. This structure keeps the deck specific enough for agronomists and simple enough for executives. This gives growers, agronomists, food buyers, sustainability leaders, investors, and product teams enough detail to evaluate scientific credibility, farm-level usefulness, data quality, economics, adoption risk, and the next decision gate. It also clarifies how field evidence, model confidence, seasonal constraints, and grower trust shape whether insights become actual management changes.

4Soil Data, Sampling, and Measurement Quality

Soil analytics presentations need a credible data story. The deck should explain what is measured, how samples are collected, how field zones are defined, which lab methods are used, how often tests repeat, and how uncertainty is handled. Sampling quality matters because poor sampling can create misleading recommendations, especially when fields have major variability by slope, irrigation, soil type, compaction, or management history. If the model also uses remote sensing, weather, equipment data, or grower records, the deck should clarify how those sources are matched and validated. A useful slide can compare required, optional, and future data layers. It should also mention data ownership, privacy, and portability. This gives growers, agronomists, food buyers, sustainability leaders, investors, and product teams enough detail to evaluate scientific credibility, farm-level usefulness, data quality, economics, adoption risk, and the next decision gate. It also clarifies how field evidence, model confidence, seasonal constraints, and grower trust shape whether insights become actual management changes.

5Analytics, Recommendations, and Agronomy Workflow

The recommendation workflow is where a soil health deck becomes useful. It should show how analytics identify field variability, nutrient constraints, pH correction needs, organic matter trends, water holding capacity, biological activity, compaction risks, or carbon improvement opportunities. Then it should explain how those insights become actions: variable-rate fertilizer, lime application, cover crop selection, reduced tillage, compost use, drainage changes, irrigation adjustments, rotation planning, or scouting priorities. The deck should be clear about what is automated and what still requires agronomist review. This protects credibility and avoids overclaiming. A good workflow slide shows data inputs, analysis steps, expert review, recommendation output, grower decision, and performance tracking. This gives growers, agronomists, food buyers, sustainability leaders, investors, and product teams enough detail to evaluate scientific credibility, farm-level usefulness, data quality, economics, adoption risk, and the next decision gate. It also clarifies how field evidence, model confidence, seasonal constraints, and grower trust shape whether insights become actual management changes.

6Yield Forecasts, Input Efficiency, and Farm Economics

Soil health analytics must eventually connect to economics. The deck should show how recommendations affect yield stability, fertilizer spend, chemical use, irrigation efficiency, crop quality, equipment passes, risk reduction, and long-term soil resilience. For investors or executives, include unit economics such as revenue per acre, subscription model, gross margin, customer acquisition cost, retention, agronomist support cost, and data processing cost. For growers, explain payback in terms they can test: input savings, yield uplift, reduced rework, better timing, lower uncertainty, or eligibility for sustainability premiums. The strongest business case separates proven results from pilot hypotheses and shows the assumptions behind each estimate. This gives growers, agronomists, food buyers, sustainability leaders, investors, and product teams enough detail to evaluate scientific credibility, farm-level usefulness, data quality, economics, adoption risk, and the next decision gate. It also clarifies how field evidence, model confidence, seasonal constraints, and grower trust shape whether insights become actual management changes.

7Sustainability, Carbon, and Regenerative Agriculture Metrics

Many AgTech soil health decks need to address sustainability without making unsupported claims. The presentation should define which metrics are tracked, such as soil organic carbon, organic matter, erosion risk, water infiltration, nutrient runoff, biodiversity proxies, cover crop adoption, reduced tillage, nitrogen use efficiency, and greenhouse gas estimates. It should also explain whether the program is designed for internal improvement, buyer reporting, incentive payments, certification, or carbon market participation. Soil carbon and regenerative outcomes require careful baselines, monitoring, verification, and time horizons. The deck should make those constraints visible. A clear sustainability section helps audiences understand what can be measured now and what needs multi-season proof. This gives growers, agronomists, food buyers, sustainability leaders, investors, and product teams enough detail to evaluate scientific credibility, farm-level usefulness, data quality, economics, adoption risk, and the next decision gate. It also clarifies how field evidence, model confidence, seasonal constraints, and grower trust shape whether insights become actual management changes.

8Adoption Model for Growers, Agronomists, and Partners

AgTech adoption depends on trust, timing, and workflow fit. A soil analytics deck should explain who uses the product or program, when recommendations arrive, how they are delivered, and what support is required. Growers may need clear field maps, simple recommendations, cost implications, and confidence levels. Agronomists may need editable assumptions, comparable zone views, scouting notes, and exportable reports. Food companies or sustainability partners may need standardized impact data and audit-ready documentation. The deck should also address barriers such as sample cost, data entry burden, connectivity, skepticism, seasonality, and competing advisory relationships. A strong adoption slide defines onboarding, training, support, renewal, and feedback loops. This gives growers, agronomists, food buyers, sustainability leaders, investors, and product teams enough detail to evaluate scientific credibility, farm-level usefulness, data quality, economics, adoption risk, and the next decision gate. It also clarifies how field evidence, model confidence, seasonal constraints, and grower trust shape whether insights become actual management changes.

9Implementation Roadmap, Pilots, and Scale Plan

The roadmap should show how the soil analytics program moves from concept to repeatable impact. Phase one may include target crop selection, sampling protocol, data model design, pilot farms, agronomist review, and baseline metrics. Phase two may expand acreage, refine recommendation logic, integrate weather or imagery, validate economics, and improve grower-facing reports. Phase three may scale across regions, partners, food supply chains, or product modules while strengthening quality control and support. Each phase should include milestones, owners, dependencies, risks, and decision gates. The deck should specify what proof is required before scaling, such as yield response, input reduction, data completeness, grower retention, or sustainability reporting quality. This gives growers, agronomists, food buyers, sustainability leaders, investors, and product teams enough detail to evaluate scientific credibility, farm-level usefulness, data quality, economics, adoption risk, and the next decision gate. It also clarifies how field evidence, model confidence, seasonal constraints, and grower trust shape whether insights become actual management changes.

10How XLSlides Speeds Up AgTech Soil Health Planning

XLSlides helps AgTech teams convert technical notes, lab summaries, field observations, market research, sustainability goals, and product strategy into a structured soil health analytics presentation. The AI workflow can organize inputs into a coherent deck covering problem framing, data collection, analytics workflow, recommendation logic, farm economics, sustainability metrics, adoption model, roadmap, and investment ask. This is useful when teams have strong agronomy or data science expertise but need a sharper business narrative for growers, investors, buyers, or partners. The generated output is not a replacement for agronomic validation or scientific review, but it creates a polished working draft that teams can refine quickly. This gives growers, agronomists, food buyers, sustainability leaders, investors, and product teams enough detail to evaluate scientific credibility, farm-level usefulness, data quality, economics, adoption risk, and the next decision gate. It also clarifies how field evidence, model confidence, seasonal constraints, and grower trust shape whether insights become actual management changes.