Agile Transformation Roadmap & Squad Structure Templates

Stop wasting hours on manual formatting. Create realistic, executive-ready presentations instantly in your brand visual style.

Squad & tribe visualizations
Velocity & cycle time dashboards
Transformation milestone maps

1The Strategic Alignment of Agile Transformation with Corporate Strategy

Agile transformation has evolved from a localized software development methodology into a critical organization-wide corporate strategy. In today's volatile macroeconomic environment, enterprises must adapt rapidly to changing market conditions, competitive disruption, and evolving consumer behaviors. Integrating Agile practices across business units helps organizations eliminate bureaucratic bottlenecks, streamline decision-making loops, and accelerate time-to-market. Corporate strategy leads, operations consulting partners, and business executives leverage Agile frameworks to align teams around strategic priorities and client needs. Proposing an Agile transformation roadmap to the board of directors or steering committee requires a highly structured, boardroom-ready deck that details migration phases, organizational capacity, and process changes. Using premium McKinsey-style widescreen templates ensures that key stakeholders can quickly evaluate operational changes, resource allocations, and governance models, building the executive consensus needed to fund and scale the initiative. Linking operational metrics to strategic performance goals proves that the transformation is designed to deliver sustained business value and long-term capability development.
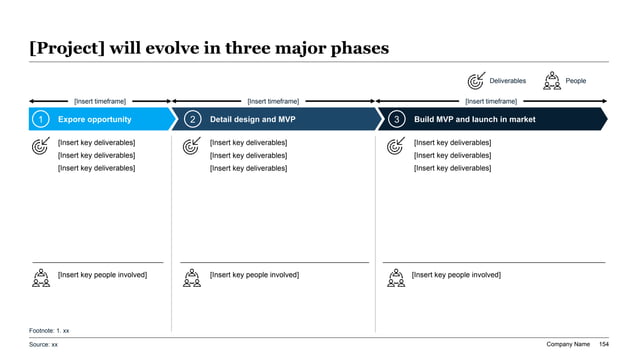
A premium widescreen slide layout showing a 3-stage gradient phase-progression arrow with chevron indicators and vertical deliverables grid mapping team allocations.
Template Design LayoutAgile Transformation Roadmap & Squad Structure Templates

2Structuring Agile Squads, Tribes, and Chapters to Eliminate Silos

A major cause of organizational friction in legacy enterprises is the persistence of functional silos, which slow down communication and hinder cross-departmental collaboration. Agile organizations resolve this issue by structuring teams into autonomous, cross-functional squads, tribes, and chapters. A squad is a small, dedicated unit containing all the skills needed to design, build, and test product features. A tribe is a collection of squads focused on a common business area, while chapters group specialists (such as designers or engineers) to maintain professional standards. Strategy architects must apply the MECE (Mutually Exclusive, Collectively Exhaustive) principle to these squad designs, ensuring that each unit has a clear, non-overlapping scope of responsibility and product ownership. This structural discipline eliminates cost redundancies and prevents role confusion across delivery teams. Presenting these org structures requires clear, hierarchical diagrams that illustrate reporting lines and capability interfaces. Ensuring that your slides preserve sufficient negative space lets the visual layout breathe, allowing executive board members to easily trace organizational ownership and verify span-of-control targets.

3Applying Barbara Minto's Pyramid Principle to Agile Leadership Decks

To command executive attention and secure funding for organizational changes, presentation decks must be structured using Barbara Minto's Pyramid Principle. This communication standard requires you to present the core strategic conclusion first, ensuring every slide headline is written as an active, takeaway statement rather than a passive label. For example, instead of naming a slide 'Squad Performance,' write: 'Cross-functional squad restructuring reduces cycle times by thirty-five percent while increasing output.' Below this primary claim, you must organize supporting data—such as sprint velocity, team capacity, and product release cycles—into mutually exclusive and collectively exhaustive (MECE) sub-arguments. This narrative discipline ensures that busy board directors, chief product officers, and operations partners can scan the deck and evaluate the transformation progress in under two minutes. By eliminating cognitive load and highlighting strategic implications, companies can accelerate decision-making and mobilize teams. This structured approach prevents common presentation pitfalls like analysis paralysis, ensuring every slide serves a direct strategic purpose in the overall organizational transformation story.

4Quantifying Performance with Velocity and Cycle Time Dashboards

An Agile transformation cannot be managed effectively without tracking clear, quantitative performance metrics. Operations leads and Scrum Masters must establish standardized dashboards that measure delivery speed, quality, and predictability. Rather than relying on subjective assessments of team productivity, strategy leads track quantitative metrics such as sprint velocity, cycle time, defect escape rate, and net promoter score. Visualizing these operational targets in a high-density metrics table helps the steering committee monitor transition progress and squad maturity. The comparison table below represents a standard Agile performance calibration model:

Operational MetricKPI TargetMeasurement UnitLegacy BaselineTarget Post-Agile Adoption
Cycle TimeFeature Delivery SpeedDays per Ticket45.0 Days< 10.0 Days (Autonomous squads)
Sprint VelocityThroughput PredictabilityStory Points met60% met> 90% Predictability (Stable velocity)
Defect Escape RateSoftware Release Quality% Bugs in Prod18% Escaped< 5% Defect Rate (Automated testing)
Deployment FrequencyRelease Release CadenceReleases per Month1 Release> 20 Releases (Continuous integration)

By tracking these parameters, transformation leaders build a transparent, data-driven reporting system that proves the business value of organizational restructuring.

5The McKinsey-Blue Design System: Visual Standards for Agile Decks

High-stakes strategy reviews and agile transformations demand a professional design system that projects corporate authority and visual clarity. Our Agile transformation template utilizes the premium 'mckinsey-blue' design theme, featuring a light-grey canvas and deep navy accents to guide the executive board's focus to key performance indicators. The visual system enforces a strict 60-30-10 color distribution rule: 60% dominant light background to prevent clutter, 30% structured neutral card containers to group squad metrics or timeline phases, and 10% high-contrast accent key (such as cobalt blue) to highlight critical milestones, velocity spikes, and efficiency metrics. All visual elements, text blocks, and tables lock into a perfect 12-column grid, eliminating margin drift and formatting errors that can distract from the core strategic message. Preserving at least 30% negative space on each slide ensures that complex agile dashboards and roadmaps remain readable and highly polished, conveying a professional standard of corporate excellence. This design discipline guarantees that the presentation feels unified and premium.

6Designing a Phased Agile Maturity and Implementation Roadmap

Transitioning a traditional global enterprise to a modern Agile operating model is a complex, multi-year journey that requires careful coordination. Transformation leads must map this transition using a phased implementation roadmap to minimize service disruption and manage execution risks. This timeline must outline key milestones, including baseline agility assessments, leadership coaching, squad pilot launches, tool standardized migrations, and continuous improvement cycles. Outlining these activities in a structured Gantt timeline helps identify critical path dependencies, such as training product owners on backlog prioritization before launching pilot squads. The checklist below summarizes the critical milestones for a multi-phase agile transition:

  • Phase 1: Diagnostic & Assess** - Conduct leadership alignment workshops, assess team capability, and define pilot scope.
  • Phase 2: Pilot & Launch** - Launch pilot squads, configure project management tools, and establish sprint ceremony cadences.
  • Phase 3: Scale & Optimize** - Roll out tribes across business units, align portfolio funding models, and run maturity audits.

Visualizing this timeline in a clean slide format reassures stakeholders that risks are actively managed.

7Capital Budgeting and ROI Calculations for Agile Operations

Shifting to an Agile operating model requires significant upfront investments in employee training, agile coaching, project management software, and physical workspace redesigns. Management consultants and finance partners must justify these expenditures by constructing a detailed business case using WACC-aligned capital budgeting models. CFOs require clear financial proof that the projected operating savings, productivity gains, and faster time-to-market of Agile squads will exceed the firm's Weighted Average Cost of Capital (WACC) and meet return hurdles. Finance teams should model capital expenditures, operating savings, and transition expenses over a multi-year horizon to calculate NPV and IRR. Additionally, modeling the projected Compound Annual Growth Rate (CAGR) of software delivery cost savings demonstrates the long-term financial value of scale. CFOs demand proof that the restructuring offsets the disruption costs of changing roles and processes. By presenting these sensitivity analysis charts alongside IRR curves, project leaders can successfully secure corporate sponsorship, align regional management, and prove that Agile transformation delivers clear operational efficiency and long-term shareholder value creation.

8Clarifying Decision Rights and Accountability via RACI Frameworks

An Agile transformation cannot function without clear decision rights and accountability boundaries. Operations leads must define who is Responsible, Accountable, Consulted, and Informed for every core ceremony, backlog, and delivery milestone. The RACI framework is a standard tool used to eliminate role confusion and accelerate decision-making speed during organizational restructuring. Visualizing this decision matrix in a high-density, clean tabular format helps stakeholders understand process governance. The table below represents a standard agile operating model RACI calibration map:

Agile ProcessScrum MasterProduct OwnerDevelopment TeamAgile Sponsor
Backlog PrioritizationConsulted (C)Accountable (A)Responsible (R)Informed (I)
Sprint PlanningResponsible (R)Consulted (C)Responsible (R)Informed (I)
Ceremony GovernanceAccountable (A)Informed (I)Responsible (R)Informed (I)
Capacity AllocationConsulted (C)Accountable (A)Responsible (R)Informed (I)

By formalizing these roles, transformation teams prevent execution delays, establish clear process ownership, and build organizational confidence.

9Five Critical Pitfalls to Avoid in Agile Roadmap Slide Layouts

To ensure your Agile transformation proposal passes steering committee scrutiny and secures capital approval, teams must avoid five common presentation mistakes:

  • Underestimating Change Resistance**: Focusing entirely on process velocity while failing to present clear change management plans and stakeholder communication strategies.
  • Lack of Quantitative Baselines**: Proposing velocity and cycle time improvements without defining current team metrics, making performance claims look speculative.
  • Information Overload**: Cramming complex, multi-layered squad and tribe org charts onto a single slide; keep at least thirty percent negative space to focus attention on key reporting relationships.
  • Non-Widescreen Layouts**: Presenting in legacy 4:3 formats which stretch and distort org diagrams on modern boardroom displays.
  • Poor Contrast**: Using light-grey text on white backgrounds, which washes out on older boardroom projectors; high-contrast coloring is mandatory.

Avoiding these common mistakes ensures your Agile proposal retains corporate attention, communicates operational discipline, builds trust with institutional investors, and leads to rapid stakeholder alignment during quarterly reviews.

10Formulating the Agile Slide Generation Prompt for XLSlides AI

Creating a comprehensive Agile transformation presentation manually in PowerPoint is a slow, frustrating task that often consumes ten to fifteen hours of adjusting margins, aligning boxes, and formatting velocity tables. This administrative overhead drains valuable cognitive energy that strategy leads and Scrum coaches should instead spend analyzing team metrics, identifying scaling bottlenecks, and coaching product owners. XLSlides AI automates this layout design process, allowing strategy leads to compile premium, boardroom-ready Agile decks in under sixty seconds. The AI performs context-aware layout matching, interpreting your operational brief and automatically mapping data to squad structures, transition roadmaps, or velocity dashboards. Brand consistency is strictly maintained based on your chosen design preset, preventing font or margin drift. The final presentation exports as standard, editable PowerPoint vector shapes, allowing you to easily adjust metrics or customize slides for specific committees. An exemplary prompt recipe for slide creation is shown below:

  • Strategic Prompt Recipe**: 'Generate a McKinsey-Blue Agile transformation roadmap slide, mapping a 3-stage maturity progression with a key deliverables grid.'

Using this recipe ensures the AI applies correct grid alignments, mapping your Agile adoption strategy to appropriate visual layouts in under 60 seconds, allowing teams to iterate rapidly.