Executive Summary: Why Working Capital Presentations Fail in the Boardroom and How to Fix Them
Working capital is the most misunderstood asset on the corporate balance sheet. In boardroom reviews, executive committee meetings, and private equity portfolio evaluations, working capital presentations fail because they suffer from a fatal disconnect: finance teams present balance sheet line items as static accounting balances rather than dynamic operational flows. Corporate controllers and treasury analysts walk into the boardroom with 60-slide decks containing raw trial balances, 90-day aging spreadsheets printed in 7-point font, and fragmented departmental commentary that explains what happened last month without diagnosing why cash is trapped or how cross-functional policies caused the leakage.
To the Chief Executive Officer, the Board of Directors, and Private Equity Operating Partners, an unorganized list of accounts receivable balances or warehouse inventory valuations is un-actionable noise. They do not want to see raw sub-ledger data. They need to understand three core commercial and operational realities: First, how many days of revenue and cost of goods sold are trapped in the operating cycle compared to upper-quartile industry peers? Second, which specific operational policies—such as unaligned commercial payment terms, broken invoice dispute resolution workflows, or speculative buffer stocks—are responsible for the cash drag? Third, what is the dollarized cash liberation opportunity, and what exact cross-functional trade-offs are required across sales, operations, and procurement to unlock $30M to $100M+ of non-dilutive liquidity?
An institutional, executive-ready working capital presentation abandons descriptive accounting recaps and adopts an answer-first, consulting-grade narrative structure. It anchors the entire meeting around the Cash Conversion Cycle (CCC = DSO + DIO - DPO), establishes an objective upper-quartile peer benchmark, translates daily cycle reductions into dollarized free cash flow, isolates root causes via a mutually exclusive, collectively exhaustive (MECE) diagnostic tree, and presents a 100-day Cash War Room roadmap with named executive owners and clear escalation triggers. This comprehensive guide provides the strategic frameworks, slide architectures, metric formulas, prompt recipes, and visual presentation exhibits required to turn trapped balance sheet cash into boardroom decision clarity.
Core Principles of Executive-Ready Working Capital Presentations
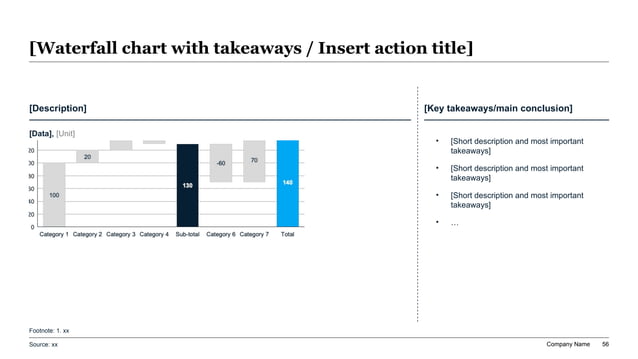
Exhibit 1: Net Working Capital (NWC) Cash Liberation Waterfall: Bridging Operating Cash Flow to Net Released Liquidity
The Strategic Imperative: Why Working Capital is the Cheapest Source of Free Cash Flow in Capital-Constrained Environments
In an era of elevated interest rates, quantitative tightening, and disciplined corporate capital allocation, balance sheet liquidity has reclaimed its rightful status as a paramount strategic asset. When corporate debt carried a 2% coupon, executive leadership teams and private equity sponsors could afford to treat working capital laxity as a minor operational nuisance. Companies routinely masked structural inventory bloat, delayed customer collections, and chaotic accounts payable disbursements with cheap revolving credit facilities and abundant asset-based lending (ABL) lines.
That era of zero-cost capital is over. Today, with benchmark borrowing rates fluctuating between 6% and 9%, an idle $100M trapped in receivables and excess warehouse stock imposes an annual cash interest drag of $6M to $9M on the corporate profit and loss statement. More critically, every dollar of trapped working capital represents capital that cannot be deployed into high-return CapEx, strategic R&D, synergistic bolt-on acquisitions, debt retirement, or share repurchases. Working capital optimization is the single largest source of non-dilutive, zero-interest internal financing available to an enterprise.
In top-tier management consulting practices (McKinsey, BCG, Bain) and premier turnaround firms (Alvarez & Marsal, FTI Consulting), working capital transformations are underwritten with aggressive, mathematically verifiable return profiles. According to longitudinal data from The Hackett Group's annual working capital surveys across the Global 1000, top-quartile performers maintain a Cash Conversion Cycle that is 45% faster than median competitors, liberating hundreds of millions in excess liquidity while maintaining identical or superior customer service levels and supplier relationships.
When presenting this strategic imperative to the board of directors or an investment committee, your opening slides must establish this macroeconomic context immediately. Do not begin with granular operational complaints. Begin with the strategic prize: 'By compressing our Cash Conversion Cycle from 68.4 days to the industry upper-quartile benchmark of 47.1 days, our enterprise will liberate $64.2M in permanent non-dilutive liquidity over the next 100 days, reducing net debt leverage by 0.45x EBITDA and eliminating $5.8M in annualized debt service carrying costs.' That is an executive proposition that commands immediate C-suite attention.
The Working Capital Triad: DSO, DIO, and DPO Levers, Root Causes, Metric Formulas, and Executive Remedies
A comprehensive cross-functional reference detailing the operational levers, root causes of cash entrapment, mathematical formulas, and executive remediation strategies across the three working capital pillars.
| Working Capital Pillar | Core Operational Lever | Root Causes of Cash Entrapment | Standard Metric Formula | Upper-Quartile Benchmark | Executive Remediation Strategy |
|---|---|---|---|---|---|
| Days Sales Outstanding (DSO) / Order-to-Cash (O2C) | Commercial Invoicing & Cash Collections | Inaccurate invoice line items, unapplied cash balances, unmonitored customer dispute logs, lax commercial credit terms granted by sales reps without credit risk underwriting. | DSO = (Gross Trade Accounts Receivable / Gross Annual Revenue) x 365 | 34 - 38 Days (Industrial / B2B Enterprises) | Enforce automated e-invoicing upon shipment; institute cross-functional dispute escalation triage within 48 hours; tie commercial sales commission payouts to cash collected rather than bookings. |
| Days Inventory Outstanding (DIO) / Forecast-to-Fulfill (F2F) | Safety Stock & Production Replenishment | Disconnected commercial sales forecasts, manual reorder points ignoring lead time variability, excessive minimum order quantities (MOQs), SKU proliferations, unreserved SLOB inventory. | DIO = (Total Inventory Balance / Annual Cost of Goods Sold) x 365 | 42 - 48 Days (Finished Goods & WIP) | Transition to dynamic safety stock formulas factoring standard deviations of demand; execute aggressive SLOB liquidation campaigns; enforce stage-gate approval for new SKU creation. |
| Days Payables Outstanding (DPO) / Procure-to-Pay (P2P) | Vendor Payment Terms & Disbursement Timing | Fragmented payment terms across business units, paying suppliers ahead of contractual maturity, failure to capture early-pay discounts, lack of supply chain finance programs for long-tail vendors. | DPO = (Trade Accounts Payable / Annual Cost of Goods Sold) x 365 | 58 - 65 Days (Normalized Operating Baseline) | Harmonize all vendor payment terms to standard Net 60/90 days; enforce automated payment runs on exact contractual due dates; deploy dynamic discounting and reverse factoring platforms. |
| Cash Conversion Cycle (CCC) / Composite Velocity | Net Operating Cycle Velocity | Siloed operational departments optimizing local functional goals (e.g., Sales maximizing volume, Plants maximizing batch run lengths, Purchasing buying in bulk for unit discounts) at the expense of enterprise cash. | CCC = DSO + DIO - DPO (Net Operating Days) | 18 - 25 Days (Top-Quartile Manufacturing) | Establish an empowered Cash Management Office (CMO) chaired by the CFO and COO; establish unified working capital metrics across Executive Committee scorecards; institute weekly cash war room reviews. |
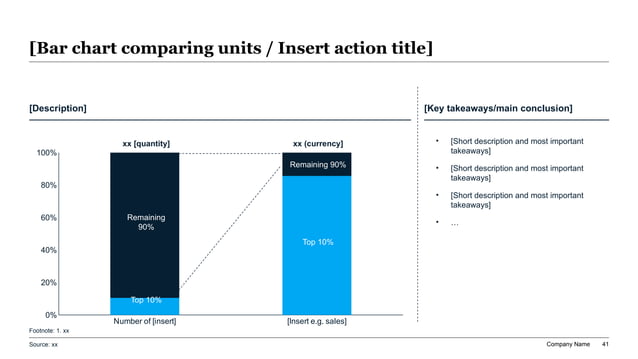
Exhibit 2: Working Capital 80/20 Pareto Concentration: Accounts Receivable Aging vs Inventory SKU Holding Costs
The Mathematical Mechanics of the Cash Conversion Cycle (CCC = DSO + DIO - DPO) and Net Working Capital Sizing
To present working capital with unassailable authority, every calculation on your slides must adhere to rigorous financial methodology. The foundational metric is the Cash Conversion Cycle (CCC), also known as the Net Operating Cycle. It measures the precise duration in days from the moment cash is disbursed to suppliers for raw materials to the moment cash is collected from customers for finished product sales: CCC = DSO + DIO - DPO.
A common pitfall that destroys credibility in front of CFOs and FP&A leaders is mismatched denominator baselines. When calculating Days Sales Outstanding (DSO), trade receivables must strictly be normalized against Gross Revenue (or Credit Sales): DSO = (Accounts Receivable / Annual Revenue) x 365. Conversely, Days Inventory Outstanding (DIO) and Days Payables Outstanding (DPO) must strictly be normalized against Cost of Goods Sold (COGS), not revenue: DIO = (Total Inventory / Annual COGS) x 365, and DPO = (Accounts Payable / Annual COGS) x 365. Mixing revenue into the inventory or payables denominator inflates turnover velocity and distorts operational reality.
The second mathematical essential is calculating the Dollar Day Value of working capital. This is the exact dollar amount of cash liberated or consumed by shifting a working capital metric by exactly one single day: Daily Revenue = Annual Gross Revenue / 365 (for DSO), and Daily COGS = Annual COGS / 365 (for DIO and DPO). For an enterprise generating $1.2B in annual revenue with $780M in COGS, one day of DSO represents $3.29M in cash ($1,200M / 365), while one day of DIO or DPO represents $2.14M in cash ($780M / 365).
By establishing these baseline dollar-day multipliers on your methodology slide, every operational initiative proposed in subsequent modules instantly carries a precise, verifiable cash value. When the Head of Supply Chain proposes compressing supplier raw material lead times by 6.0 days, the committee immediately sees a $12.8M cash release ($2.14M x 6.0). When the VP of Sales resists standardizing customer payment terms from Net 60 to Net 45, the committee immediately recognizes that this commercial concession traps $49.3M in customer financing ($3.29M x 15.0). Mathematical clarity depersonalizes cross-functional debates and aligns executive focus strictly on cash impact.
The Working Capital Pre-Meeting Data Reconciliation & Analytical Hygiene Checklist
Cross-Divisional Cash Conversion Cycle (CCC) Peer Benchmarking & Dollarized Opportunity Sizing
A structured benchmarking model evaluating four operating divisions of a $1.2B enterprise against industry upper-quartile standards, quantifying metric gaps and net cash liberation potential.
| Operating Division | Annual Revenue ($M) | Annual COGS ($M) | Current DSO (Days) | Current DIO (Days) | Current DPO (Days) | Current CCC (Days) | Upper-Quartile Benchmark CCC | Metric Gap (Days) | Net Cash Liberation Opportunity ($M) |
|---|---|---|---|---|---|---|---|---|---|
| Industrial Equipment & Machinery | $480.0M | $312.0M | 54.2 Days | 78.5 Days | 44.1 Days | 88.6 Days | 52.0 Days | -36.6 Days | $26.4M Cash Potential ($13.4M DSO + $15.4M DIO - $2.4M DPO) |
| Precision Engineered Components | $340.0M | $221.0M | 46.8 Days | 62.4 Days | 49.5 Days | 59.7 Days | 38.0 Days | -21.7 Days | $16.8M Cash Potential ($7.2M DSO + $8.1M DIO + $1.5M DPO) |
| Aftermarket Parts & Consumables | $220.0M | $132.0M | 38.5 Days | 94.2 Days | 52.0 Days | 80.7 Days | 45.0 Days | -35.7 Days | $14.2M Cash Potential ($2.1M DSO + $13.0M DIO - $0.9M DPO) |
| Technology Solutions & Field Services | $160.0M | $115.0M | 62.4 Days | 18.2 Days | 42.0 Days | 38.6 Days | 25.0 Days | -13.6 Days | $6.8M Cash Potential ($5.2M DSO + $0.0M DIO + $1.6M DPO) |
| Consolidated Enterprise Total | $1,200.0M | $780.0M | 50.2 Days | 67.8 Days | 46.5 Days | 71.5 Days | 42.0 Days | -29.5 Days | $64.2M Total Cash Liberation Opportunity |
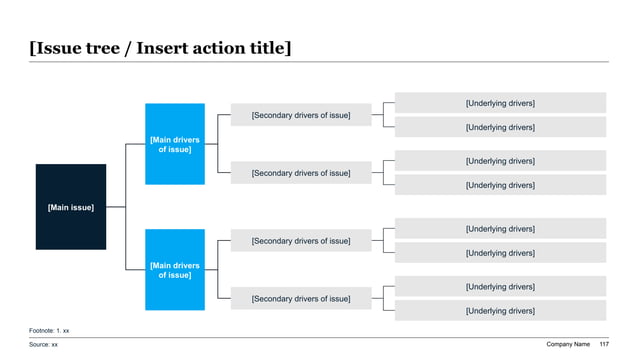
Exhibit 3: MECE Working Capital Diagnostic Issue Tree: Decomposing Inefficiencies Across Order-to-Cash (O2C), Forecast-to-Fulfill (F2F), and Procure-to-Pay (P2P)
Order-to-Cash (O2C) & DSO Deep-Dive: Billing Accuracy, Dispute Triage, Collection Tiering, and Credit Policy Tightening
Days Sales Outstanding (DSO) is frequently described by executives as a measure of customer payment speed. In reality, across hundreds of corporate diagnostic studies, customer payment delays account for less than 35% of elevated DSO. The remaining 65% of cash delay is self-inflicted by internal enterprise dysfunction: defective purchase order matching, inaccurate billing addresses, missing tax identification numbers, disputed pricing surcharges, late invoice dispatch, and bureaucratic credit memo approval cycles.
When an invoice arrives at a corporate customer's accounts payable department with an unapproved price variance or missing proof of delivery, the customer's ERP system systematically blocks payment. While the vendor's sales rep assumes the customer is simply taking extended payment terms, the invoice sits in an unresolved dispute queue for 60 to 90 days. Presenting an effective DSO reduction strategy requires dismantling the myth that collection agencies solve working capital problems. The solution lies in upstream billing hygiene and cross-functional dispute triage.
Your presentation should articulate four concrete operational remedies: First, Billing Automation & Clean-Invoice Gates. Mandate that commercial invoices are generated electronically and dispatched on the exact day of shipment or service completion, with automated pre-validation against customer purchase orders to eliminate line-item pricing discrepancies. Second, The 48-Hour Dispute Resolution Protocol. Establish a cross-functional dispute triage team uniting Customer Service, Sales, and Billing. Any invoice blocked by a customer dispute must be categorized (Pricing Error, Short Shipment, Damaged Goods, Tax Exemption) and resolved within 48 hours rather than lingering until month-end.
Third, Tiered Collection Strategies and 80/20 Customer Stratification. Deploy segmented collection workflows: Tier-1 strategic enterprise accounts receive dedicated white-glove credit controllers who conduct proactive pre-due-date invoice reconciliation 10 days before maturity; Tier-2 mid-market accounts are routed through automated statement cadences and dunning reminders; and chronic slow-paying Tier-3 transactional accounts are placed on credit hold, mandatory prepayment, or letter-of-credit terms. Fourth, Aligning Commercial Incentives with Cash Collection. Shift sales commission payment timing from booked contract value to collected cash. The moment account executives realize their quarterly bonus is contingent on customer invoice settlement, commercial reps become ferocious advocates for billing accuracy and prompt payment.
100-Day Cash War Room Governance: Weekly Cadence, Workstream Owners, Gate Deliverables & Escalation Thresholds
A battle-tested 100-day execution framework defining the weekly rhythm, cross-functional leadership responsibilities, phase-gate deliverables, and C-suite escalation rules required to liberate trapped working capital.
| Phase & Timeline | Governance Focus | Workstream Lead | Mandatory Weekly Deliverables | Key Performance Milestones | C-Suite Escalation Threshold |
|---|---|---|---|---|---|
| Phase 1: Days 1 - 30 (Rapid Triage & Cash Sweeps) | Immediate Cash Liberation & Top-Accounts Triage | Group Treasurer / VP Finance | Top 50 overdue AR customer outreach logs; daily unapplied cash sweeps; manual stop-payment on unapproved AP disbursements; initial SLOB inventory scrap list. | Liberate $15.0M in quick-win cash; establish weekly cash war room dashboard; freeze all non-contractual early vendor payments. | Any single customer invoice dispute > $250K unresolved after 5 days; unapplied cash in suspense accounts > $2.0M. |
| Phase 2: Days 31 - 60 (Process & Policy Redesign) | Root-Cause Elimination & Contract Alignment | Director of Working Capital / FP&A | Harmonized vendor payment terms master agreement (Net 60/90); automated e-invoicing deployment schedule; dynamic safety stock formula recalibration in ERP. | Liberate an additional $25.0M in cash; harmonize 75% of active vendor spend to standard terms; reduce invoice billing error rate to < 1.5%. | Sales pushback on standard customer payment terms for Tier-1 accounts; Procurement failure to renegotiate top 20 vendor contracts. |
| Phase 3: Days 61 - 90 (Systemic Enforcement & Tools) | ERP Automation & Cross-Functional Governance | Head of Supply Chain & Corporate Controller | Automated payment run schedule enforcement; supplier dynamic discounting portal rollout; SKU rationalization and discontinuation matrix. | Liberate an additional $18.0M in cash; decommission bottom 15% of negative-margin SKUs; achieve 95% on-time electronic billing dispatch. | Plant refusal to decommission slow-moving legacy SKUs; vendor threats of supply disruption over Net 90 payment term adjustments. |
| Phase 4: Days 91 - 100+ (Institutionalization) | Long-Term Policy & Executive Compensation Linking | Chief Financial Officer (CFO) & Chief Operating Officer (COO) | Final cash reconciliation report; revised corporate credit policy manual; executive working capital scorecard integration into Annual Operating Plan (AOP). | Achieve full $64.2M permanent cash liberation; embed working capital performance into executive bonus scorecards; transition from war room to monthly governance. | Sustained slippage of CCC > 3.0 days over two consecutive months post-war-room transition. |
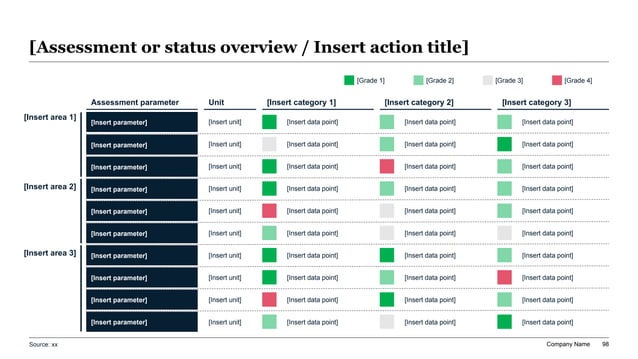
Exhibit 4: Executive Working Capital Scorecard & Peer Benchmark Matrix: DSO, DIO, DPO, and CCC Performance Across Operating Divisions
Forecast-to-Fulfill (F2F) & DIO Deep-Dive: Safety Stock Recalibration, Lead Time Compression, and SLOB SKU Liquidation
Days Inventory Outstanding (DIO) represents the largest, most operationally complex reservoir of trapped working capital in manufacturing, distribution, and retail organizations. While accounts receivable and accounts payable represent contractual financial claims, inventory represents physical capital—steel, microchips, packaging, finished sub-assemblies—sitting on warehouse racks, consuming floor space, incurring insurance and handling costs, and continually risking obsolescence and damage.
In many industrial companies, inventory builds are the direct result of misaligned operational incentives. Plant managers are measured on Overall Equipment Effectiveness (OEE) and unit production absorption, encouraging them to run massive batch sizes to absorb fixed plant overhead, regardless of actual market demand. Supply chain planners, fearful of stockouts that trigger executive reprimands, manually inflate safety stock buffers across every regional distribution center. Meanwhile, marketing and sales teams introduce dozens of new product variants without retiring legacy SKUs, leading to an insidious accumulation of Slow-Moving and Obsolete (SLOB) inventory.
To present a compelling DIO optimization program to the executive leadership team, your slides must outline three core supply chain transformation workstreams: First, Dynamic Safety Stock Calculation. Replace crude rules of thumb (e.g., 'always keep 30 days of forward supply') with statistical safety stock modeling that accounts for standard deviation of customer demand and supplier lead time variability: Safety Stock = Z x sqrt(Avg Lead Time x Var Demand + Avg Demand^2 x Var Lead Time). Recalibrating safety stock to empirical variability typically liberates 15% to 25% of safety stock capital while actually improving customer On-Time In-Full (OTIF) fulfillment rates.
Second, Multi-Echelon Inventory Optimization (MEIO) and Centralized Buffer Postponement. Rather than holding fully assembled, expensive finished goods inventory across 15 regional warehouses, shift stock upstream into intermediate, uncommitted sub-assemblies held at centralized manufacturing hubs. By postponing final product differentiation until customer orders are confirmed, the enterprise exploits portfolio risk-pooling, cutting overall inventory requirements by the square root law of distribution consolidation.
Third, Rigorous SLOB SKU Identification and Accelerated Liquidation. Present an unsparing analysis of the inventory tail. Categorize inventory into Active (demand within last 90 days), Slow-Moving (demand between 91 and 180 days), and Obsolete (> 180 days with zero forward demand). Propose an immediate 4-step liquidation cascade: return to suppliers for restocking credit, bundle into promotional commercial campaigns with non-competing customer segments, liquidate through secondary broker channels, or execute tax-advantaged scrap write-offs to clear warehouse space and halt ongoing storage carrying costs.
Enterprise Prompt Recipe: Converting Raw Balance Sheet, ERP Sub-Ledger, and AP/AR Trial Balance Data into an Executive-Ready Working Capital Deck
Act as an expert corporate finance transformation consultant and executive presentation strategist specializing in McKinsey, BCG, and Alvarez & Marsal working capital diagnostic methodologies. I need you to convert raw balance sheet data, trial balance extracts, and operational metrics into an institutional, decision-ready Working Capital Optimization presentation deck for the CFO, CEO, Board Audit Committee, and PE Operating Partners. Context & Financial Inputs: 1. Financial Baseline: Annual Gross Revenue = $1,200M; Annual COGS = $780M; Current Trade Accounts Receivable = $165.0M (DSO = 50.2 Days); Current Inventory = $145.0M (DIO = 67.8 Days); Current Accounts Payable = $99.3M (DPO = 46.5 Days); Consolidated Cash Conversion Cycle = 71.5 Days. 2. Benchmark Targets: Industry Upper-Quartile DSO = 38.0 Days; DIO = 48.0 Days; DPO = 60.0 Days; Target Cash Conversion Cycle = 26.0 Days. 3. Operational Pain Points: $38.5M in receivables > 60 days overdue with 42% tied to pricing and billing disputes; $32.0M in slow-moving and obsolete (SLOB) inventory with zero demand over trailing 180 days; vendor payment terms fragmented across Net 30, 45, and 60 days with 28% of suppliers paid 8 days ahead of contractual maturity. Deliverables: 1. Executive Summary Action Slide: Write an answer-first executive summary with a crisp takeaway action title, summarizing the net cash liberation prize ($64.2M), operational root causes, and three core C-suite decisions. 2. Working Capital Waterfall Bridge Narrative: Provide the exact multi-step bridge values starting from current operating cash flow through DSO overdue collections ($22.0M), DIO safety stock and SLOB rationalization ($25.0M), and DPO term harmonization ($17.2M) down to net liberated liquidity. 3. Cross-Functional Accountability Scorecard: Draft a 5-column executive table assigning explicit targets, root causes, operational levers, and named executive owners (Sales VP, Supply Chain CSCO, Procurement CPO, Treasurer). 4. 10 Slide Action Titles: Write 10 consultant-grade slide action titles that articulate the complete operational narrative without reading body bullets. 5. Boardroom Decision & Governance Memorandum: Draft the formal executive resolution establishing the 100-Day Cash War Room, dispute triage rules, customer credit hold thresholds, and weekly escalation cadence.
The Working Capital Executive Deck Readiness & Boardroom Stress-Test Checklist
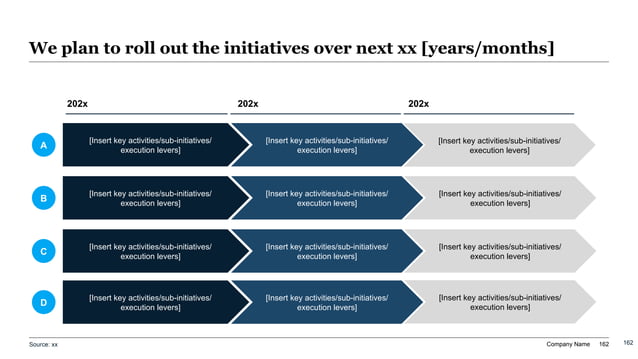
Exhibit 5: The 100-Day Cash War Room & Multi-Horizon Working Capital Transformation Roadmap
Procure-to-Pay (P2P) & DPO Deep-Dive: Payment Term Harmonization, Dynamic Discounting, and Supply Chain Finance (Reverse Factoring)
Days Payables Outstanding (DPO) represents the third pillar of working capital optimization, functioning as a direct, interest-free supplier credit facility that finances daily operations. However, in corporate boardrooms, DPO initiatives are often viewed with skepticism by Chief Procurement Officers and operating executives who fear that extending payment terms will antagonize critical suppliers, trigger unit price increases, or disrupt manufacturing component deliveries.
This skepticism is justified when DPO extension is executed clumsily as an across-the-board unilateral mandate (e.g., sending generic letters demanding Net 120 terms from every vendor). Such blunt tactics provoke immediate supplier backlash, damage strategic partnerships, and frequently violate commercial supply contracts. An institutional, consulting-grade DPO strategy approaches payables optimization not through brute force, but through segmentation, term harmonization, disbursement timing discipline, and structured financing.
Your presentation should highlight four sophisticated procurement and treasury mechanisms: First, Contractual Payment Term Harmonization. In large organizations with decentralized purchasing, vendors routinely enjoy wildly disparate payment terms across divisions. A Tier-1 supplier might have Net 30 terms with Division A, Net 45 with Division B, and Net 60 with Division C. Harmonizing all vendor accounts to the most favorable existing contract term (e.g., standardizing the entire enterprise spend to Net 60 or Net 90) captures immediate cash liberation without renegotiating master commercial terms.
Second, Payment Run Discipline and Timing Optimization. Audit the accounts payable disbursement schedule. In many companies, automated AP payment runs execute twice weekly or immediately upon invoice voucher approval, paying suppliers 5 to 10 days ahead of the contractual maturity date. By configuring the enterprise ERP system to release disbursements strictly on the contractual due date (or the nearest scheduled weekly run thereafter), the enterprise preserves millions in working capital cash with zero supplier contract modifications.
Third, Early Payment Discounts vs. Cost of Capital Optimization. Present an objective financial evaluation of 2/10 Net 30 terms. Capturing a 2% discount for paying in 10 days rather than 30 equates to an annualized return of 36.7%—far exceeding any company's weighted average cost of capital (WACC). When cash is abundant, early discounts should be systematically captured; when liquidity is constrained, the presentation should illustrate the trade-off of relinquishing discounts to preserve balance sheet cash.
Fourth, Supply Chain Finance (Reverse Factoring) Programs. For critical, highly strategic suppliers who cannot absorb extended payment terms without balance sheet distress, deploy a bank-intermediated Supply Chain Finance (SCF) facility. Under an SCF program, the buyer extends contractual payment terms to Net 90, but the bank pays the supplier on Day 10 at an attractive discount rate based on the investment-grade buyer's credit rating. The supplier receives low-cost accelerated liquidity, while the enterprise successfully extends its DPO, achieving a win-win working capital structure without commercial friction.
Frequently Asked Questions About Working Capital Presentations
XLSlides Resources for Corporate Treasury, Finance Leaders, and Operating Partners
Turn Trapped Working Capital into Actionable Boardroom Liquidity with XLSlides
Your board of directors and executive committee deserve presentations that drive decisive cash liberation, not 60-slide technical spreadsheet dumps that obscure operational bottlenecks. XLSlides transforms fragmented ERP trial balances, customer dispute logs, and supply chain inventory models into clean, institutional consulting decks in minutes.Experience the power of automated, logic-driven presentation generation designed specifically for serious corporate finance, treasury, and operational leadership. Build your next executive-ready working capital presentation with XLSlides today.